Weather models are continuing to struggle in the aftermath of the stratospheric sudden warming on January 1st. The GFS and ECMWF have flip-flopped: on one run decent northern blocking extends southward only for the dreaded European high to appear on the next.
Using a combination of QBO and ENSO data featured in my winter forecast and statistics from previous SSWs (including 2013 and 2018) achieved the following results shown in this graphic.
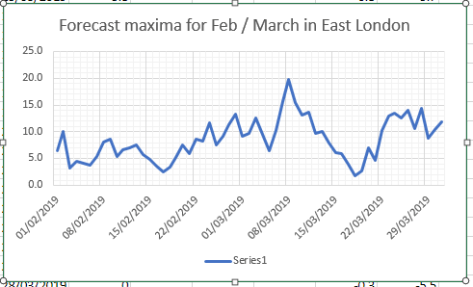
Although some days in the next week or so will be cold it is not until the 14th that conditions start to bite, the start of a week-long cold spell that will probably be more notable for cold than snowfall.
The rapid recovery in temperature would suggest that the Azores / European high making a return. With the MJO moving back and forth between phase 7 and 8, and looking at the behaviour of previous cold spells, this would make sense.
The GFS has been churning out some very strange charts of late
As for February, unless there are further SSWs to disrupt the polar vortex, and depending on its recovery, it is unlikely we will see a repeat of the winter of 1984/85 that I hinted at last month. The graphic below, however, would suggest another cold spell in the third week of February.
With the mean temperature of both October and September finishing 0.2C below average it is probably safe to say that the weather is in an average kind of mood.
Conditions during the first part of November look changeable, according to the Met Office’s 30-day forecast . After mid month, however, the agency says the forecast is uncertain.
Now that much of the UK has had its first frost any warm spell in November will, correctly, be called an Indian summer. A singularity called the St Martin’s Summer occurs in 66 per cent of years, occurring between 15th and 21st and peaking on the 18th.
And, as if by magic, the GFS model today has this chart for the 16th, an Atlantic ridge of high pressure with daytime temperatures about 6C to 8C above average. Though warm during the day I would imagine there being a risk of fog forming at night
Beyond that there could be a tendency for much more unsettled weather at the end of the month. The early December storms singularity occurs in 98 per cent of years, starting between November 24th and December 14th, often peaking on December 9th.
November, the last autumn month, can often surprise with its extremes, though it can also often be characterised by days of anticyclonic gloom. The warmest, coldest and wettest November conditions in London back to 1959 can be found here.
Although many parts of the UK have already recorded their first air frost this part of the capital, being so built up and close to the City, remains frost free.
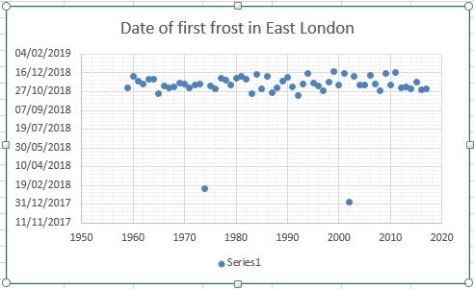
Although many may think that frosts are getting later a look back through local statistics to 1959 shows these events are very random.
The scatter graph below illustrates this.
Taking out the winters of 1974/75 and 2002/03, which didn’t see frosts until February and January respectively, the scatter can be seen better here.
The median for the first frost is November 6th with an average minimum of -1.4C.
October frosts can be a precursor to a mild winter much in the same way that heavy October snowfall in the Alps has lead to an awful season. But there are exceptions, as happened in 2008/09.
* To record an air frost the temperature must fall to -0.1C or lower.
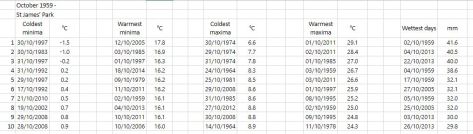
October is one of those months that can see both ends of the spectrum; from calm ‘mists and mellow fruitfulness’ and, rarely, frost, to wet and wild systems whistling in off the Atlantic, best known being the 1987 Great Storm and, more recently, the St Jude storm.
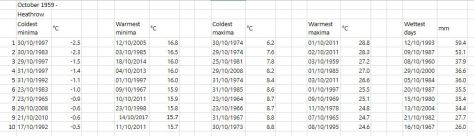
I’ve put together a few top 10s of stats for Wanstead, St James’s Park and Heathrow for the month of October.
Some national UK October values according to TORRO
In terms of climatology October maxima, considering the 1981-2010 average, shows a decline through the month, though around the 8th and 20th there is often a spike. This would reflect the October singularities; early October storms, between 5th and 12th, peaking on the 9th, occur in 67 per cent of years. St Luke’s summer, between 16th and 20th, peaking on 19th, also has a 67 per cent probability.
Mid-autumn storms occur between 24th and 29th October, with a 100% probability.
The average rainfall graphic shows that downpour amounts are variable through the month. A tendency for dry weather around the 17th and 18th before the wettest days on the 20th and 21st.
The long range weather models are causing much excitement on various forums with one run predicting an anomaly of +16C on Sunday, July 29th.
Such an anomaly would see temperatures exceed 40C in London, unprecedented looking back at records to 1841; the highest temperature recorded in the UK was 38.5C at Brogdale, near Faversham, Kent, in Augut 2003.
Though it is improbable it is not impossible. Back in April conditions allowed the temperature to rocket to a monthly record of 29.1C, a positive anomaly of 15.5C!
A repeat of similar synoptic conditions would be needed – these would obviously be helped by the record meteorological drought conditions this area is currently experiencing.
Because reliable thermometer records of heatwaves only go back as far as 1840 it is impossible to quantify whether 40C has ever been exceeded in the UK prior to then.
However, accounts of the heatwave of July 1808 suggest parts of England may have come close. Far removed from images of freezing Georgian winters and miserable summers the July of 205 years ago was among the warmest ever. The monthly mean for July 1808, according to the Central England Temperature series, was 18.4C – the 6th hottest July since the beginning of the series in 1659.
Luke Howard, the ‘father of meteorology’ who at the time lived in Plaistow, referred to the heatwave in his diary on July 13th: “Temperature at 9am 84F. The intense heat of the maximum lasted nearly three hours till about 4pm. At 6pm the temperature was 90F.” Another entry mentions a reading taken nearby. “Another at Plashet, a mile and a half eastward, indicated 96F as the maximum under the shade of a house.”
While Howard’s methods of measuring the temperature ran short of modern standards, his thermometer was hung under a laurel bush, the values still give a valid insight into the heatwave.
Tales of the heatwave, which particularly affected east and north-east England, can be seen in letters sent to local newspapers around the country. Many describe labourers dying from heat exhaustion while working in fields. Farm animals and horses suffered a similar fate.
One letter from Hull, published in the Coventry Mercury, said: “At Sigglesthorne, the honey in some beehives melted, ran out upon the ground, and most of the bees drowned in it. At Sutton, a lamb and a dog belonging to the Rev Mr Croft of Rowley, expired in the heat; and several birds dropped down dead, while flying over the streets of this town.”
Of course it is impossible to know about the health of people and animals that died but that birds dropped out the sky suggests extreme heat.
The thundery end to spring has probably built everyone’s hopes up that we’re about to experience a summer with plenty of fireworks in the atmosphere. But the current pattern that brought four consecutive days of thunder (the whole year average is 3.5!) – a continental influence on our weather – could just as easily flip to a mobile south-westerly.
Thunderstorms will probably continue to be a feature of the summer
The mean temperature for summer 2018 is looking average overall with average precipitation.
Like the most recent winter forecast I’ve looked in depth at ENSO, QBO and local meteorological data.
ENSO
The El Niño–Southern Oscillation (ENSO) is a periodic variation in winds and sea surface temperatures over the tropical eastern Pacific Ocean. Current neutral conditions are forecast to continue through to September so any impact is likely to be very small. I had a look at similar years were ENSO was 0.2 in May and came up with the following.
Temperature
Average: 40%
Rather cool: 40%
Cool: 20%
Rainfall
Average to slightly dry: 60%
Average to slightly wet: 40%
Sunshine
Average to slightly sunnier than average: 60%
Average to slightly dull: 40%
QBO
I also had a look the quasi-biennial oscillation (QBO), the quasiperiodic oscillation of the equatorial zonal wind between easterlies and westerlies in the tropical stratosphere. This produced only two similar years: 1963 and 2010.
Temperature
Average: 50%
Cool: 50%
Rainfall
Average to slightly dry: 50%
Average to slightly wet: 50%
Sunshine
Average to slightly sunnier than average: 50% Singularities / patterns
Spring was consistently on the wet side this year with all months at least 127 per cent wetter than average, the total of 182mm made it the wettest for 10 years.
The mean temperature for the spring season, despite the very cold start, ended 0.8C warmer than average, just under a degree colder than last spring which was the second warmest on record.
If you take into account all years back to 1797 that were within +/- 10 per cent of these figures, some 10 ‘best fit’ years emerge.
The list of 10 summers, ranging from 1801 through to 2007, predominantly saw summers that were just on the cooler side of average – no real corkers stand out except for 2001 which saw a hot spell at the end of July that made it into my list of best heatwaves.
As an average this summer could be expressed as: Mean: 17.1C (just below average) Rainfall: 150mm (about average). Sunshine 535 hours (just below average)
Or, expressed in probabilities, I concluded the following:
Temperature Average to slightly below: 50%
Average to slightly above: 20%
Rather cool: 20%
Cool: 10%
Rainfall
Average: 50%
Wet: 30%
Dry: 20%
Sunshine
Average: 10%
Average to slightly sunny: 30%
Average to slightly dull: 40%
From the above you could deduce that the next three months will be slightly below average for temperature, with average rainfall. And slightly duller than average.
To try to give some idea of what month will have the best weather I’ve broken down the summer into June, July and August probabilities.
Looking at June, after the weekend, the outlook is looking unsettled and gradually turning cooler after the first week. July looks average as does August which, apart from two years, has been a very disappointing summer month.
Perhaps the best weather this summer will be at the end of June and the second week of July – just as most schools break up?
* Taking into account the fact that temperatures in London are up to 0.66C warmer than they were 100 years ago I have added 0.66C to mean temperatures before 1915.
** Obviously, in the event of a series of direct hits from thunderstorms, my rainfall estimate could be hopelessly short – a symptom of abundant solar energy at this time of year which creates a ‘noisy’ atmosphere compared with winter.
*** The 1981-2010 average mean for summer in this region is 17.6C, with 144.9mm of rain and 564 hours of sunshine
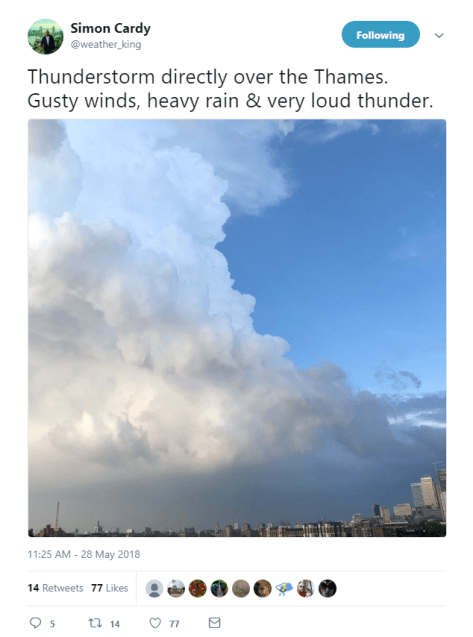
After the previous two days’ thunderstorm events it would be easy for this one to get lost in the ether. However, being super local and how quickly it developed and then died was enough to pique my interest.
After a very warm and humid afternoon where the temperature peaked at 26.2C clouds began gathering to the east with the first rumbles of thunder at 6.45pm. The huge cumulonimbus could be seen from Southend.
And Simon Cardy took an excellent shot from the other end of the Thames.
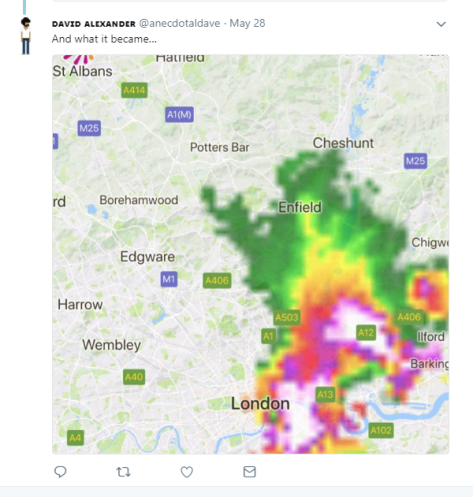
By 8.17pm the storm that had moved west had decayed markedly.
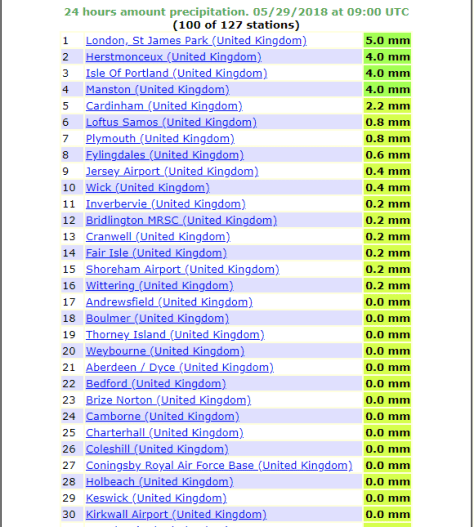
The 24hr rain totals at 09 on May 29th show how local the storm was. St James’s Park, 9 miles to the south-east, recorded half Wanstead’s total.
Timeline (BST)
1840 first peals of thunder heard
1847 first drops of rain
1856 downpour
1857 cloudburst
1901 16mm/hr 1.7mm
1903 very heavy
1909 burst of >5mm hail recorded. Rain rate 60.4mm/hr
1929 rain ceased (10.4mm in total)
Though March is usually, meteorologically speaking, the first month of spring this year it felt more like an extension of winter.
This graph shows that the two visits from the “Beast From The East” were only enough to momentarily dent the average.
The mean temperature for March 2018 finished 6.3C, that’s 1.4C below the 1981-2010 average, the coldest for five years but still nearly 3C warmer than the exceptional March of 2013.
Some 61.5mm of precipitation fell, that’s 151 per cent% of average and the wettest for 10 years, pipping the wet March of 2016 by just 1.2mm. The 38th= wettest March since 1797.
The wet end to the month is shown on this graph.
Perhaps most notable in this region was the lack of sunshine. There was just 59.1hrs recorded, that’s just 54 per cent of the 1981-2010 average. The dullest March since 1984 and, more notably, the 5th dullest March back to 1881!
Though there were no notable night frosts, the coldest night fell to just -3.8C, the cold pattern was enough to create three new entries in the top 10 of coldest March days in Wanstead and further afield in the capital.
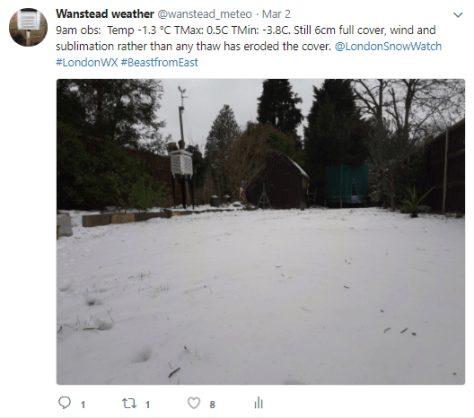
With 6 more days of ‘snow lying at 9am’ winter 2017-18, the snowfall season stretches from October to May, was boosted up to 20th place on my snow index.
Since notably cold weather struck at the end of February I’ve lost count of the number of times I’ve heard this phrase uttered by the public and some sections of the press.
Top 20 cold anomalies
The ‘Beast from the East’ (versions 1.0 and 2.0) really captured the imagination in an age where everything has to have a label slapped on it; any message that these cold spells are ‘weather’ and not ‘climate’ seems to get lost.
Both spells, indeed the general pattern of our late winter weather, were driven by the stratospheric sudden warming event that lead to a split polar vortex in February – leading to a very cold end to the month and a mean temperature anomaly of -2.5C, the greatest monthly anomaly since March 2013.
To put it into perspective, however, it was nothing like some of the anomalies that occurred in the early 19th century: January 1814, for example, saw a monthly anomaly of -8.2C and coincided with the last occasion a frost fair was held on the Thames. Januaries back then were generally very cold, the 1801-1831 average monthly mean was -3C, that’s 8C colder than the most recent 1981-2010 average!
So climate now is much warmer but that is not to say that anomalously cold months can’t happen. February 1986 saw an anomaly of -5.6C, the 13th= greatest cold anomaly in my local dataset going back to 1797.
Top 20 warm anomalies
The cold December of 2010 recorded an anomaly of -4.2C, 76th= greatest cold anomaly, while anomalies of -4.1C recorded in January 1979 and March 2013 were 77th=.
With the warming climate it is no surprise that most warm months happened very recently. The balmy month of December 2015 saw a positive anomaly of 5.4C.
The ‘Beast from the East 2.0’ was caused by a narrow tongue of extremely cold air from Russia scoring a direct hit on the UK. The odds of this happening must have been low but it is an example of how, when the synoptics of the atmosphere line up perfectly, anything is possible.
And it is an example how even in a warming climate the UK can still be subject to anomalous cold and warmth at any time of the year.
As the author Mark Twain reportedly once said: “The climate is what you expect; the weather is what you get.”
The upper air anomaly of the ‘Beast from the East 2.0’. This graphic shows positive and negative monthly anomalies since 1797 against a generally warming climate
Because the above graphic is crowded I created one of anomalies since 1970. The upward trend is the same.
The weather this coming weekend reminds me of a March weekend in 2013 when large parts of the south-east woke up to a covering of snow.
Conditions in Wanstead were very knife-edge, the cover being very slushy. I remember going for a bike ride on that Sunday morning. We left Aldersbrook in sleet, the cover grew thicker as we pedalled into Essex. By the time we reached High Beach near Epping there was 8cm of fresh cover. Conditions on the 2-hour plus ride were inclement to say the least – the temperature didn’t rise above 0C!
This weekend we have a similar set-up, only this time the upper air at 5,000ft is a good 10C colder – no knife-edges this time and, if the streamer gets going, many places should see 10cm of cover. Don’t put away that sledge just yet!


You must be logged in to post a comment.