Last month’s heatwave was the hottest three-day event recorded in this area since 1850. It bettered a similar event in 1932 by 0.8C to take 10th in my all-time list of heatwaves.
Sleeping in heatwaves is never a great prospect even in an age where fans and air conditioning units are becoming more and more common.
In 1948, however, residents of Kensington and other areas of London were so hot and desperate to escape oven-like houses caused by temperatures well into the 90s that they decamped en masse into the streets and local parks to get some kip.
A report published in the Aberdeen Journal on Friday 30th July describes how folk down south were coping with the heat.
“The metropolis last night was like a large restless household—with all the lights ablaze, doors and windows thrown open, the family fretful, and endless pots of tea brewing far into this morning.
“Perhaps one in ten among the 8,000,000 of us slept after midnight. For the rest, we tossed and turned and saw out this heatwave night, when temperatures were never below 71 degrees, a variety of ways. About midnight I walked past the gaunt old Edwardian mansions in Kensington. With the exception the lights that burned from every window, the scene was reminiscent of the early days of the Blitz.
“Families trekked across the roadway in varying stages of undress to their little bits of ornamental gardens. With them went camp beds, bed linen, umbrellas, “in case,” the children, and the household pets, choose a cool open-air camping spot and feel wonderfully adventurous and spartan in the process.”
“At regular intervals the adolescent members of the squatting colonies were dispatched to the tea and coffee stalls on the corner, and perhaps for the first time in years these traders ran out of stocks. On the Kensington-Chelsea boundary, where life becomes noticeably less inhibited and on occasions less swish, a mixed group of young artists was sleeping on the pavement off Fulham Road.
“Round the next corner, where many theatrical and film stars live, several had slung hammocks on their meagre front lawns – one actually suspended between the bathroom windows of two adjacent houses. Midnight street wear for both sexes was cool if unconventional —silk pyjamas, bath robes, tennis shorts, and one in kilt and bathing costume top who could have gone straight into the arena at Lonach.”
The temperature at Westminster that night never fell below 23.3C (73.9 F), a record for July that still stands.
The column goes on to describe the situation in the House of Commons where the heat had reached “almost Turkish bath intensity”.
“Some members were in natty tussore silk suitings, but this helped little, and it was many of their number who appealed to the Speaker to have more windows opened. The Speaker, panting like the rest of us, said they were all open. If they wanted more cool breezes from the Thames, members would have to smash the windows.”
The above graphic shows maxima recorded in the month of April with shading to represent the anomaly of each day relative to the 1981-2010 average.
The last two years show the warm spells experienced in the second half of the month. The overall impression is that warming seems to have accelerated since 2011.
The erratic onset of spring in some years often presents that problem of what to wear every morning. During the current warm spell I’ve seen all manner of attire on the school run; everything from T-shirt and shorts to full winter regalia topped off with hat and gloves.
The position of the sun is now bringing in to range the season when the gap in temperature between day and night can be at its greatest.
On Saturday (23/2), virtually unbroken sunshine and ‘thick’ air saw the temperature in Wanstead peak at 16.1C before clear conditions overnight saw the minimum plunge to just 0.2C. The gap of 15.9C represents the fourth highest diurnal temperature range for February in this area back to 1959.
Top 10 February diurnal temp ranges
Looking at the year as a whole the greatest range is 20.8C with the months of May and June the most likely to see the condition.
It is 21 years ago this month that London and most of the southern half of the UK experienced a remarkably warm spell of weather during what had been a mild winter.
The spell, which saw the record warmest February day on the 13th (19.7C), satisfies the Met Office’s old criteria of a heatwave whereby the maximum temperature is 5C or more above average for five consecutive days.
While these spells are fairly common in summer they are very rare during a meteorological winter. During the last 60 years the only other periods to have experienced a heatwave in winter are December 1966 and 2015.
Weather charts for this week look remarkably similar though, according to the latest forecasts, values will be nothing like they were in 1998.
Since this was published this 2019 spell has satisfied the Met Office criteria. But the anomalies are not yet as impressive as 1998.
The long range weather models are causing much excitement on various forums with one run predicting an anomaly of +16C on Sunday, July 29th.
Such an anomaly would see temperatures exceed 40C in London, unprecedented looking back at records to 1841; the highest temperature recorded in the UK was 38.5C at Brogdale, near Faversham, Kent, in Augut 2003.
Though it is improbable it is not impossible. Back in April conditions allowed the temperature to rocket to a monthly record of 29.1C, a positive anomaly of 15.5C!
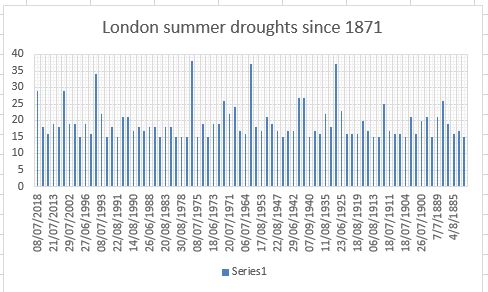
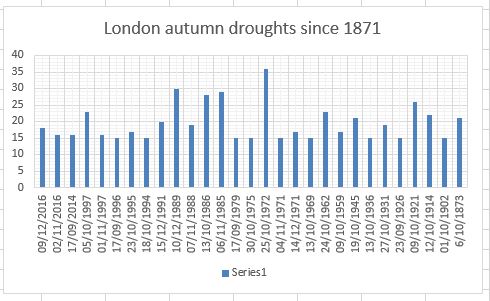
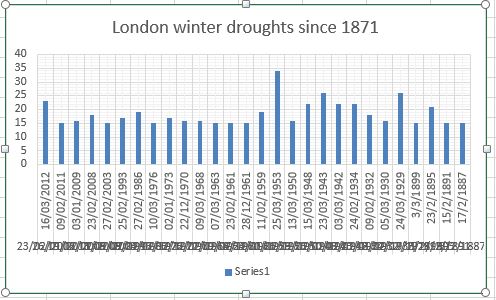
A repeat of similar synoptic conditions would be needed – these would obviously be helped by the record meteorological drought conditions this area is currently experiencing.
Because reliable thermometer records of heatwaves only go back as far as 1840 it is impossible to quantify whether 40C has ever been exceeded in the UK prior to then.
However, accounts of the heatwave of July 1808 suggest parts of England may have come close. Far removed from images of freezing Georgian winters and miserable summers the July of 205 years ago was among the warmest ever. The monthly mean for July 1808, according to the Central England Temperature series, was 18.4C – the 6th hottest July since the beginning of the series in 1659.
Luke Howard, the ‘father of meteorology’ who at the time lived in Plaistow, referred to the heatwave in his diary on July 13th: “Temperature at 9am 84F. The intense heat of the maximum lasted nearly three hours till about 4pm. At 6pm the temperature was 90F.” Another entry mentions a reading taken nearby. “Another at Plashet, a mile and a half eastward, indicated 96F as the maximum under the shade of a house.”
While Howard’s methods of measuring the temperature ran short of modern standards, his thermometer was hung under a laurel bush, the values still give a valid insight into the heatwave.
Tales of the heatwave, which particularly affected east and north-east England, can be seen in letters sent to local newspapers around the country. Many describe labourers dying from heat exhaustion while working in fields. Farm animals and horses suffered a similar fate.
One letter from Hull, published in the Coventry Mercury, said: “At Sigglesthorne, the honey in some beehives melted, ran out upon the ground, and most of the bees drowned in it. At Sutton, a lamb and a dog belonging to the Rev Mr Croft of Rowley, expired in the heat; and several birds dropped down dead, while flying over the streets of this town.”
Of course it is impossible to know about the health of people and animals that died but that birds dropped out the sky suggests extreme heat.
A thunderstorm on July 27th has ended a dry spell that lasted nearly 7 weeks in east London. As storms go it was a fairly tame affair, just 1.3mm fell, the first rain in 47 days, 20 hours and 14 mins.
There are many descriptions of drought but the one I am using here, for sheer simplicity of comparison back to 1871, is the definition used up until the 1990s; that is 15 consecutive days with less than 0.25mm (0.01 inches) rain on any one day.
Meteorological droughts occur in most years though obviously ones that occur in summer are far more noticeable than those in winter. Since 1871 there have been 35 calendar years where no drought has taken place.
The longest drought before this one in 2018, probably not surprising for those who remember it, occurred during the long hot summer of 1976. The fact that summer came on top of a very dry winter, rainfall that season was about a third of what was recorded here last winter, meant that water supplies were in a much worse state, with hosepipe bans common.
Other drought years to feature include 1959, which saw the 3rd sunniest summer on record, 1929 and 1995, a summer which saw one of the hottest heatwaves on record.
For the stats I’ve used local rainfall figures back to 1959 and then stats used at Kew to 1871.
This graphic shows droughts were most common between 2000 and 1921. Apart from this year the length of droughts seems to be declining
Looking at the results more closely I’ve divided them into their meteorological seasons.
Weather models are hinting that this coming bank holiday weekend could be very warm indeed, with one WX Charts animation suggesting that a positive anomaly of 12C could be possible on Monday.
A date record looks a formality and, unless there’s a downgrade, new monthly high temperature records at stations across the south-east look a possibility.
While it looks very warm it is too early to start talking about heatwaves. And, considering the pattern since late February, with hot and cold alternating weekly, a brief return to much cooler conditions at the beginning of June can’t be ruled out.
The British record high temperature for May is 32.8C, reached on two occasions:
Camden Square, London May 22nd 1922. The same station recorded this value again on May 29th 1944, along with Regents Park, Horsham and Tunbridge Wells.
The national date record for the 28th, according to TORRO, is 30.6C at Camden Square.
Locally the highest temperature recorded in this area in May is 32.1C on May 27th 2005. The date record I recorded is 26.5C in 2012.
I normally headline these monthly reviews by referring to the most notable weather but this April, often a fairly non-descript mid-spring affair, offered pretty much every type of weather.
The mean temperature finished 11.7C, 1.9C above average and the warmest for four years.
Rainfall was 55mm, 129 per cent of average and the wettest for 6 years.
Sunshine was just 110 hours, the dullest for 40 years and the 16th dullest since 1881.
Hidden in the positive monthly anomaly was the warmest April day in a local record going back to 1959: 29.1C on the 19th – a figure that represents a positive anomaly of 15.5C and occurring at the start of the warmest April heatwave since 2011. It was remarkable that such an anomaly happened so close to a record negative anomaly the previous month.
Yet, just over a week later, temperatures lurched cold again with one of coldest last days of April on record. Though the 24hr record wasn’t broken the noon-6pm record going back 60 years was beaten.
The wettest day occurred on the 9th with 10mm falling.
Air frosts: 0, Ground frosts: 1
April 30th provided a timely reminder after the heatwave to ne’er cast a clout till May is out. A low pressure system in the North Sea brought a thoroughly miserable day though even more rain fell across the Channel.It was a month with some amazing sunsets. This one, on April 30th, happened just as the sky cleared before dusk
The stats are in and the average maxima for the past few days’ heatwave is 1C lower than the hot spell in 2011: a positive anomaly of 10.6C over six days.
Although this year’s spell pipped the previous April high temp by 0.2C, the 2011 spell saw slightly higher temperatures and were recorded in a month that finished 3.3C above average – the average for this April is likely to finish only 2C above average.
April 2011 also saw just 3.3mm of rain recorded. The rainfall so far this month is already at 36.7mm, with more likely before the end of the month.
The spell in 2011 saw 74 hours of sunshine in total while this spell only saw 58 hours.
In terms of this summer it is quite possible that we won’t see a week with higher maximum anomalies or more sunshine than we saw across the southeast this week. To give you any idea of just how anon. warm last week was here is what the equivalent temperatures would be at the end of July, on average the warmest time of the year.
* The Met Office definition of a heatwave (the same as the WMO) states: “When the daily maximum temperature of more than five consecutive days exceeds the average maximum temperature by 5 °C, the normal period being 1961-1990”.
This slideshow requires JavaScript.
The large anomalies of the past few days can be seen on this thermo trace
You must be logged in to post a comment.