Category Archives: London snowfall

The snowfall of December 11, 2022

The morning of December 11, 2022, began cold after an overnight frost that saw temperatures fall to -5.3C. Freezing fog lasted through the day, coating everything in rime to set the stage for what was to be one of the most notable snowfalls in years.

Precipitation started just before 7pm with a mix of rain, ice pellets and wet snow, this soon turning to all snow within 10 minutes and settled fast.

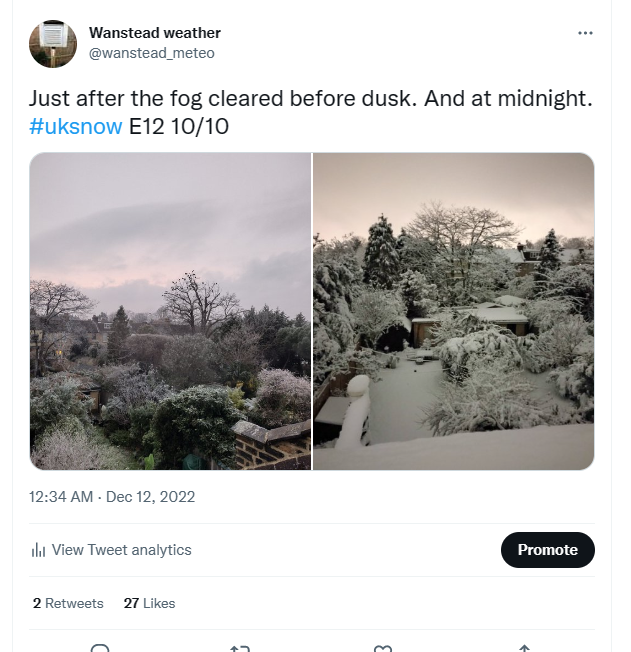
By 9pm there was a good 6cm; Wanstead Park was soon transformed.

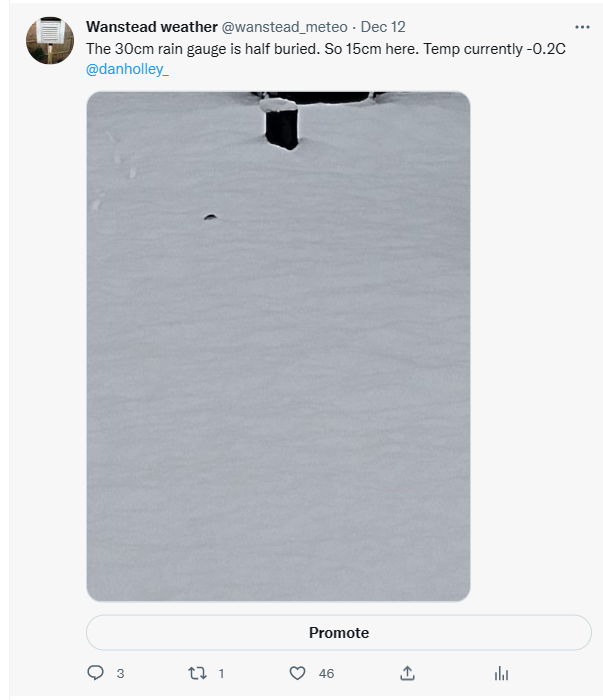
By midnight the snow had stopped, leaving a good 13cm out the back

Elsewhere there was a rare sighting of thundersnow in Billericay.

<blockquote class=”twitter-tweet”><p lang=”en” dir=”ltr”>Incredible &amp; relatively rare thundersnow captured on Essex! <br><br> <a href=”https://t.co/2o0OHY35oF”>pic.twitter.com/2o0OHY35oF</a></p>&mdash; Met4Cast (@Met4CastUK) <a href=”https://twitter.com/Met4CastUK/status/1602073484951261185?ref_src=twsrc%5Etfw”>December 11, 2022</a></blockquote> <script async src=”https://platform.twitter.com/widgets.js&#8221; charset=”utf-8″></script>

Advertisement

The cold spell of February 2021

Valentines Day 2021 saw the cold spell come to an end in the London area. Maxima over the past 7 days never exceeded 2.3C on any day, the yardstick I use for a spell of cold weather to qualify.

Though some places did get a decent amount of snow precipitation in this area was very low ; lying snow at 9am at this station never exceeded 3cm. Very cold, dry air however was enough to preserve cover out of the sun.

As cold spells go it was two days longer than the median of 5 days, so slighter colder and drier but with double the amount of sunshine.

A couple of years ago I tried to rank cold spells in this area since 1960, with mixed results. I’ve since revisited the method and have achieved better results using the following algorithm.
(Number of days * total precipitation)*(mean temperature of spell)-(total sun hours). This gave the following list.

And the next 26 cold spells

A comparison of the upper air at the start of two cold spells

There’s been many images that define this spell but this post probably nails it in that I’ve never seen the ice thick enough on the marshes to tempt someone to ice skate.

London winter forecast 2020/21

The best chance for lying snow this winter looks like being at the end of the second week of January.

A combination of local analogues and global atmospheric factors including the El Niño-Southern Oscillation suggest that the coming season will be colder than recent years. Though that’s not saying much considering just how mild winters of the past decade have been.

Meteorological autumn was the warmest for 5 years and slightly drier than last year’s wet autumn. Though it shares some similarities with 2015 the external influences are thankfully different to that season which produced the warmest December on record. Considering data back to 1797 I was able to make the following suggestions on how the next 90 days may unfold.

December is most likely to be around average temperature-wise with rainfall also about average. Possibly stormy at the end of the first week. Any snowfall events are likely to be marginal – bad news for anywhere below 70m above sea level. In terms of Christmas a white one in London looks unlikely. There may be interest in the week running up to the big day but I wouldn’t be surprised to see that inexplicable warm up that often happens just as the 25th arrives.
Mean: 5.8°C (5.6°C 1981-2010 average)
Rainfall: 57.1mm (53.2mm 1981-2010 average)

January is the month most likely to see any lying snowfall, particularly during the first half of the month, with the mean temperature about 1C colder than average. Rainfall is likely to be above average.
Mean: 4.1°C (5.2°C 1981-2010 average)
Rainfall: 63.8mm (53.2mm 1981-2010 average)

February looks wet and mild overall.
Mean: 6°C (5.3°C 1981-2010 average)
Rainfall: 55.6mm (39.2mm 1981-2010 average)

Overall the mean for winter: 5.3°C, a little below average.
And rainfall about 120 per cent higher than average.

Looking in closer detail reveals that the coldest period is most likely to be between 13th and 19th January, with anomalies sufficiently low enough for lasting lying snow.

The extremes that no-one can forecast

As well as the extreme December 2015 the analogues also revealed the severe season of 1822-23 which saw ice on the Thames by late December. February 8th saw a great snowstorm in northern England where people had to tunnel through the snow.

Another was 1950-51 which was very snowy at high levels. There were 102 days of lying snow at Dalwhinnie (1000ft), exceeding the 83 days set in 1946-47. December 15th saw 15in of snow in Shanklin, Isle of Wight in 3.5 hours.

London’s colder than average months

Last November was on the cold side prompting me to investigate whether we were about to record a third month in a row below average. December turned out to be mild and wet, the lack of snow especially stark in Scotland.

The findings of that study showed that any sustained period of colder than average months was more likely to happen during months of March, April and May, nothing unusual there, especially considering H.H Lamb’s weather types.

I decided to scrutinise further all the colder than average months in this area, considering the 1981-2010 average, back to 1981. This gave the below results.

neg anoms

The dataset covers 399 months, of which 200 were colder than average.

The overall picture shows that negative anomalies are becoming more and more rare, though with notable exceptions being March 2013, December 2010 and January 2010.

The only month that has showed any sort of consistent general decrease in negative anomaly is November.

*For good snowfall at this station needs a negative anomaly of 2C during the months of November, December, January and February.

The year snow fell in London in October

Two hundred years ago this October the extremely rare phenomenon of lying snow in October was recorded in London.

A likely plunge of Arctic air on the 21st saw rain turn to snow which lay nearly 8cm deep by the morning and remained for nearly a week.

The month started dry and warm. On the 1st Luke Howard recorded 75°F at his laboratory in Stratford. The warmth remained into the second week with 77°F recorded on the 10th, 11th and 12th.

oct 1819
The values from Luke Howard’s Climate of London.

The wind swung into the north on the 18th and with it arrived the first hoar frosts that were cold enough to kill garden plants.

On the 21st the cold air further dug in and with it rain that turned to sleet. Howard said: “It began to snow about noon falling in very large flakes thick and rapidly for an hour and covering the ground. Some rain followed.

“In the evening the wind rose and it blew hard in the night from NNW. At midnight came a second heavy fall of snow which continued till 6am and though at first much of it melted it lay in the morning a full three inches deep.”

Howard adds that the surroundings ‘took on appearance of mid winter with the single exception of the foliage still remaining on the trees which mingled with an enormous burden of snow presented a very singular and grotesque appearance’.

The weight of the snow was also enough to break off large limbs from fruit trees.

The snow was still lying on the 23rd and, probably caught out by the earliness of the polar plunge, swallows were seen at Stamford Hill. On the 24th a very white frost was observed with a low of 31°F recorded at Tottenham.

More wintry weather followed in November, December and January.

Could snow fall here again in October? The probability is very low but it is not impossible, given the right synoptic conditions. Recent cases of notably positive and negative anomalies following in quick succession somewhat mirror the weather of Howard’s day.


January 2019: rather cold, dry

January was most notable for being on the cold side, in contrast to December.

The mean temperature finished 4.1C, 1.1C below average, over 2C colder than last January.

Some 32.9mm of precipitation was recorded, 62 per cent of the 1981-2010 average, about half what fell last year, the driest January since 2006

Some 55 hours of sunshine were recorded, that’s 109 per cent of average, sunnier than last year.

Fourteen air frosts were recorded.

There were four days where snow fell but only one day of snow lying, 1cm on 23rd.

To view full stats follow this link:http://1drv.ms/1kiTuzv

My winter forecast went a bit awry in December – I predicted a mean of +0.8C, the outcome was +1.7C. January has been much better, I predicted -1.2C, the outcome is -1.1C! Also… “And another cold spell end of January into the first week of February?”
For February I predicted a mean of -1.7C. The current pattern to continue and signs on the EC of a more robust cold spell with air supplied by a Scandinavian high?

Heading for a 1984/85 style winter?

With talk of an imminent statospheric sudden warming (SSW) I thought it would be interesting to have a look back at previous SSWs and see what precedents could be found.

December so far is showing similarities with 1984: mean maxima is within 0.3C of 1984 while rainfall is virtually the same at around 30mm!

During the winter of 1984-85 the polar vortex split on January 2nd, setting up that month to be among the coldest of the 20th century, on a par with 1979 and 1987. A more recent January that was just as cold was 2010.

Indeed, the winter of 1984-85 was among the snowiest of the past 70 years, ranking at number 5 in my survey of winters.

1984-2018.PNG

een

March 2018: cold, some snow and very dull

Though March is usually, meteorologically speaking, the first month of spring this year it felt more like an extension of winter.

Screen Shot 2018-04-01 at 11.09.47
This graph shows that the two visits from the “Beast From The East” were only enough to momentarily dent the average.

The mean temperature for March 2018 finished 6.3C, that’s 1.4C below the 1981-2010 average, the coldest for five years but still nearly 3C warmer than the exceptional March of 2013.

Some 61.5mm of precipitation fell, that’s 151 per cent% of average and the wettest for 10 years, pipping the wet March of 2016 by just 1.2mm. The 38th= wettest March since 1797.


Screen Shot 2018-04-01 at 11.17.13
The wet end to the month is shown on this graph.

Perhaps most notable in this region was the lack of sunshine. There was just 59.1hrs recorded, that’s just 54 per cent of the 1981-2010 average. The dullest March since 1984 and, more notably, the 5th dullest March back to 1881!
Though there were no notable night frosts, the coldest night fell to just -3.8C, the cold pattern was enough to create three new entries in the top 10 of coldest March days in Wanstead and further afield in the capital.
With 6 more days of ‘snow lying at 9am’ winter 2017-18, the snowfall season stretches from October to May, was boosted up to 20th place on my snow index.
Summary for March 2018
Temperature (°C):
Mean (1 minute)  6.1
Mean (min+max)   6.3
Mean Minimum     3.0
Mean Maximum     9.6
Minimum          -3.8 day 01
Maximum          15.3 day 27
Highest Minimum  8.0 day 15
Lowest Maximum   0.5 day 01
Air frosts       5
Rainfall (mm):
Total for month  61.5
Wettest day      9.0 day 30
High rain rate   12.1 day 12
Rain days        20
Dry days         11
Wind (mph):
Highest Gust     24.4 day 08
Average Speed    3.2
Wind Run         2411.5 miles
Gale days        0
Pressure (mb):
Maximum          1032.3 day 20
Minimum          983.3 day 11
Days with snow falling         4
Days with snow lying at 0900   6
Total hours of sunshine        59.1
snow mar 1
19th march snowmar 3 tree eng thawmar 3 thawmar 2 snowmar 2 roadsmar 1 rada

Repeat of March 24th 2013 only 10C colder

The weather this coming weekend reminds me of a March weekend in 2013 when large parts of the south-east woke up to a covering of snow.

Conditions in Wanstead were very knife-edge, the cover being very slushy. I remember going for a bike ride on that Sunday morning. We left Aldersbrook in sleet, the cover grew thicker as we pedalled into Essex. By the time we reached High Beach near Epping there was 8cm of fresh cover. Conditions on the 2-hour plus ride were inclement to say the least – the temperature didn’t rise above 0C!

This weekend we have a similar set-up, only this time the upper air at 5,000ft is a good 10C colder – no knife-edges this time and, if the streamer gets going, many places should see 10cm of cover. Don’t put away that sledge just yet!


Winter 2017/18: 27th out of 72

A few years ago I devised a winter index to try to decipher how modern winters ranked against legendary seasons, such as 1947 and 1963.

With the media hyping conditions last week, which were severe in many parts of the country, it is very difficult for many to gauge just how conditions compare with previous winters.

My findings show that this winter so far stands 27th. It is possible that further snowfall that results in lying snow at 9am between now and April will boost the position higher though, given recent years, this would seem unlikely.

index

Last week’s cold spell, while containing some impressive statistics, is put into perspective when it is compared with other severe spells since 1960. A decent cold spell but no record breaker in the form of a 1962/63.

Perhaps it is the advent of social media, the plethora of constant updates of the latest feet-deep snowdrifts and instant tales of heroism in the face of icy adversity, that has made this cold spell seem far more severe than it actually was in the minds of many; February / March 2018 was the first truly social media-driven cold spell.