There’s been quite a few superlatives thrown at this early January cold spell, not least the recording of the coldest January night at Altnaharra in 15 years.
Snowfalls across the Highlands, Lake District and northern England have been notable in their longevity relative to recent years.
But the absence of any lying snow at 9am in this locality and fairly standard minima for January left me looking elsewhere for something notable.
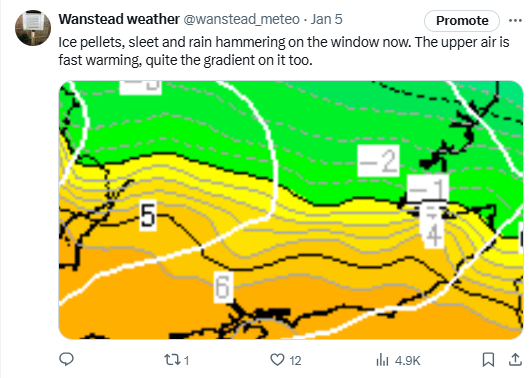
Airmass battlegrounds are a regular feature of UK winters though I can’t remember a time when this region has been right on the boundary.
The temperature on the 5th climbed from 3.2C at 0810 to 11.3C at 1050. Here it hovered until 0710 on the 6th before plunging to 3.2C again by 0910 – a period of just 2 hours.
There was some transient snowfall on the evening of the 4th but it lasted a matter of hours with the incoming warm air after midnight..
After the previous two days’ thunderstorm events it would be easy for this one to get lost in the ether. However, being super local and how quickly it developed and then died was enough to pique my interest.
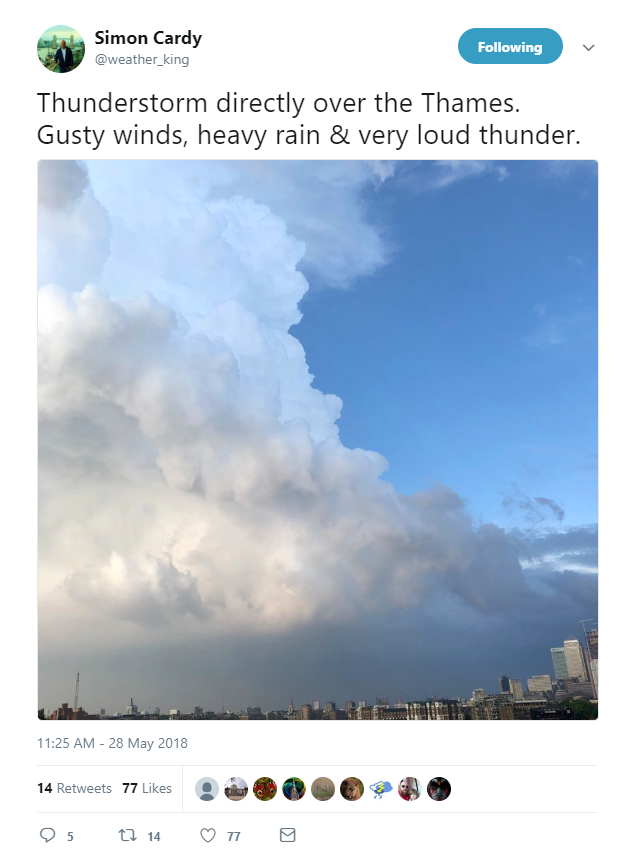
After a very warm and humid afternoon where the temperature peaked at 26.2C clouds began gathering to the east with the first rumbles of thunder at 6.45pm. The huge cumulonimbus could be seen from Southend.
And Simon Cardy took an excellent shot from the other end of the Thames.
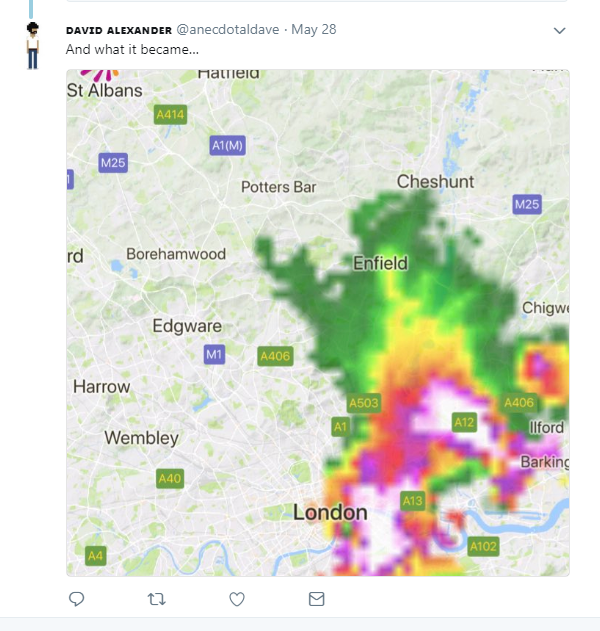
By 8.17pm the storm that had moved west had decayed markedly.
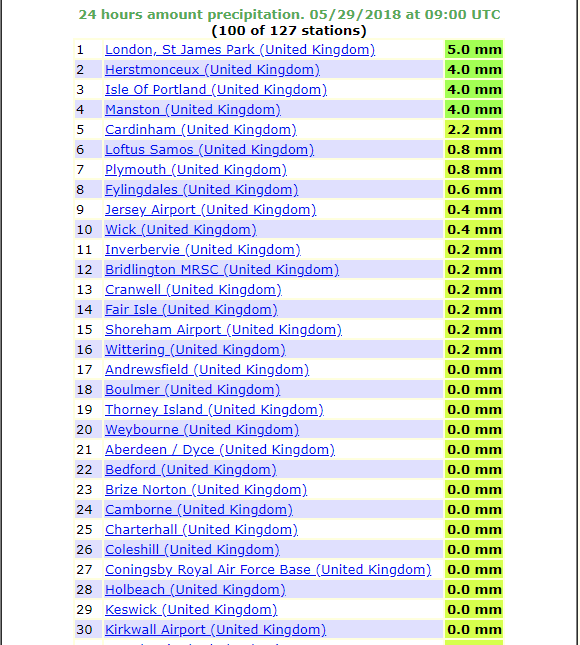
The 24hr rain totals at 09 on May 29th show how local the storm was. St James’s Park, 9 miles to the south-east, recorded half Wanstead’s total.
Timeline (BST)
1840 first peals of thunder heard
1847 first drops of rain
1856 downpour
1857 cloudburst
1901 16mm/hr 1.7mm
1903 very heavy
1909 burst of >5mm hail recorded. Rain rate 60.4mm/hr
1929 rain ceased (10.4mm in total)
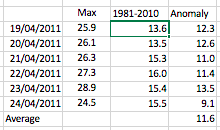
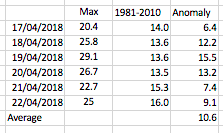
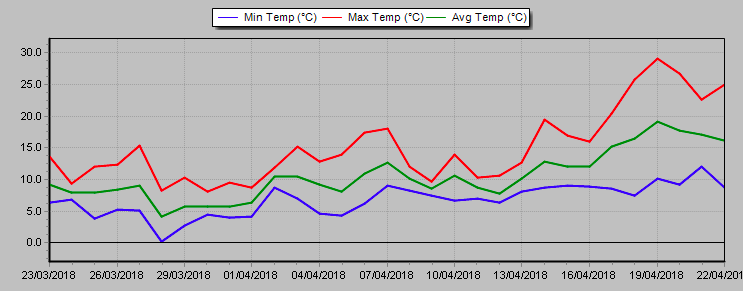
The stats are in and the average maxima for the past few days’ heatwave is 1C lower than the hot spell in 2011: a positive anomaly of 10.6C over six days.
Although this year’s spell pipped the previous April high temp by 0.2C, the 2011 spell saw slightly higher temperatures and were recorded in a month that finished 3.3C above average – the average for this April is likely to finish only 2C above average.
April 2011 also saw just 3.3mm of rain recorded. The rainfall so far this month is already at 36.7mm, with more likely before the end of the month.
The spell in 2011 saw 74 hours of sunshine in total while this spell only saw 58 hours.
In terms of this summer it is quite possible that we won’t see a week with higher maximum anomalies or more sunshine than we saw across the southeast this week. To give you any idea of just how anon. warm last week was here is what the equivalent temperatures would be at the end of July, on average the warmest time of the year.
* The Met Office definition of a heatwave (the same as the WMO) states: “When the daily maximum temperature of more than five consecutive days exceeds the average maximum temperature by 5 °C, the normal period being 1961-1990”.
This slideshow requires JavaScript.
This slideshow requires JavaScript.
The large anomalies of the past few days can be seen on this thermo trace
Though March is usually, meteorologically speaking, the first month of spring this year it felt more like an extension of winter.
This graph shows that the two visits from the “Beast From The East” were only enough to momentarily dent the average.
The mean temperature for March 2018 finished 6.3C, that’s 1.4C below the 1981-2010 average, the coldest for five years but still nearly 3C warmer than the exceptional March of 2013.
Some 61.5mm of precipitation fell, that’s 151 per cent% of average and the wettest for 10 years, pipping the wet March of 2016 by just 1.2mm. The 38th= wettest March since 1797.
The wet end to the month is shown on this graph.
Perhaps most notable in this region was the lack of sunshine. There was just 59.1hrs recorded, that’s just 54 per cent of the 1981-2010 average. The dullest March since 1984 and, more notably, the 5th dullest March back to 1881!
Though there were no notable night frosts, the coldest night fell to just -3.8C, the cold pattern was enough to create three new entries in the top 10 of coldest March days in Wanstead and further afield in the capital.
With 6 more days of ‘snow lying at 9am’ winter 2017-18, the snowfall season stretches from October to May, was boosted up to 20th place on my snow index.
The winter of 2017/18 will probably be remembered as much colder that it actually was – the exceptionally severe spell right at the end was only at its halfway point by the time the meteorological winter was over.
Like a scene from the Pathfinder movie
The mean temperature for the season finished 5C, that’s 0.5C below average and the coldest for five years.
Rainfall was above average: 180.8mm fell, that’s 124 per cent of average and the wettest for four years.
Sunshine was just over average: 174.4 hrs is 104 per cent over average and the sunniest for tree years.
As so often with winters at this latitude the average for three months makes it look a non-descript season – it is only when you look at the detail that compelling facts emerge.
The coldest day of the season occurred on the last day of February when the maximum failed to rise above -1C, the first ‘ice day’ for five years and the coldest day since 2010. It was also the seventh equal coldest February day in a local record going back to 1959.
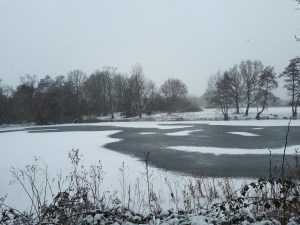
Perch pond, being deeper, took longer to ice over
The coldest night of the winter was in the early hours of the 28th when a low of -6.9C was recorded. The temperature would have been far lower were it not for a shower that moved in at 3am.
The warmest day of the winter occurred on December 30th with 14.2C recorded. The warmest night was on January 28th when the temperature fell to just 10.8C.
The wettest day of the winter occurred on January 2nd when 15.3mm was recorded.
Snow arrived at the start of winter and at the very end: seven days of snow falling and four days of snow lying over the three months is below average.
This slideshow requires JavaScript.
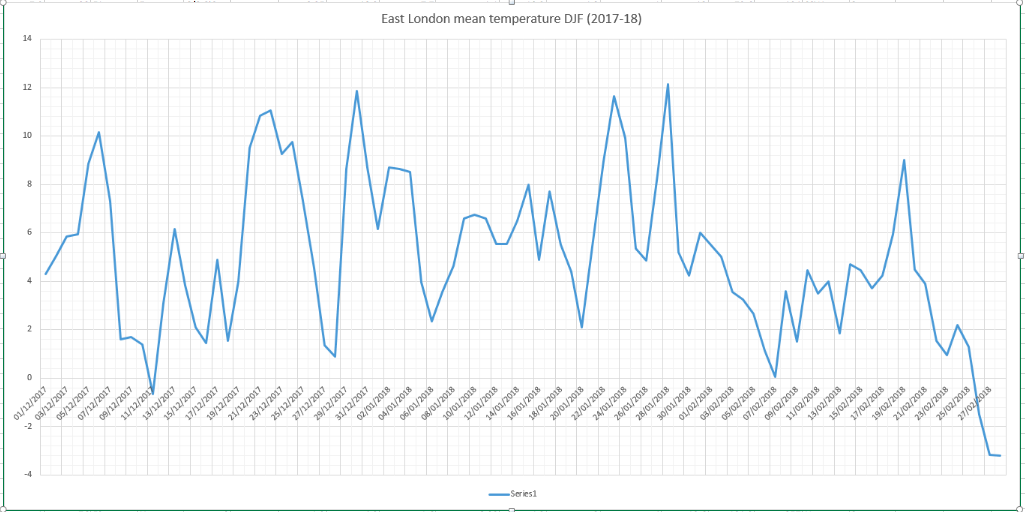
The daily mean temp yo-yo’d throughout December, January and February
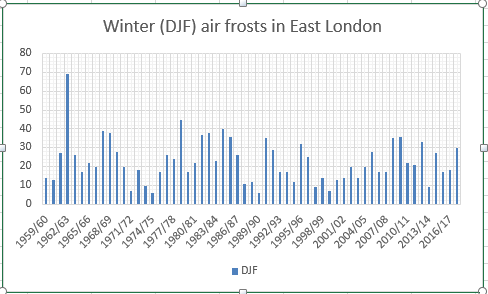
There were 30 air frosts during the three months, eight above the 1981-2010 average.
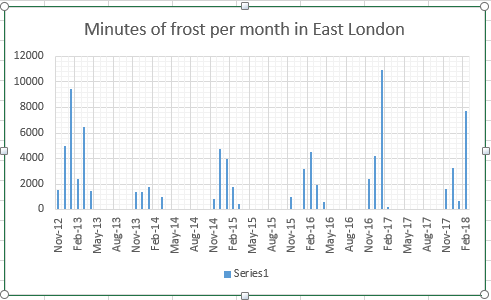
There were 11,680 minutes of frost over the winter, less than last year, though 66 per cent of those were recorded in February. Considering the past 6 Februaries this year’s frost hours were 170 per cent greater than the next highest, February 2016!.
Temperature (°C):
Mean (1 minute) 5.2
Mean (min+max) 5.0
Mean Minimum 2.0
Mean Maximum 8.0
Minimum -6.9 on 27/02/2018
Maximum 14.2 on 30/12/2017
Highest Minimum 10.8 on 28/01/2018
Lowest Maximum -1.0 on 28/02/2018
Air frosts 30
Rainfall (mm):
Total for period 182.2
Wettest day 15.3 on 02/01/2018
High rain rate 28.2 day 02/01/2018
Rain days 52
Dry days 38
Wind (mph):
Highest Gust 45.0 on 02/01/2018
Average Speed 3.7
Wind Run 8059.5 miles
Gale days 0
Pressure (mb):
Maximum 1036.4 on 22/12/2017
Minimum 970.3 on 10/12/2017
Days with snow falling 7
Days with snow lying at 0900 4
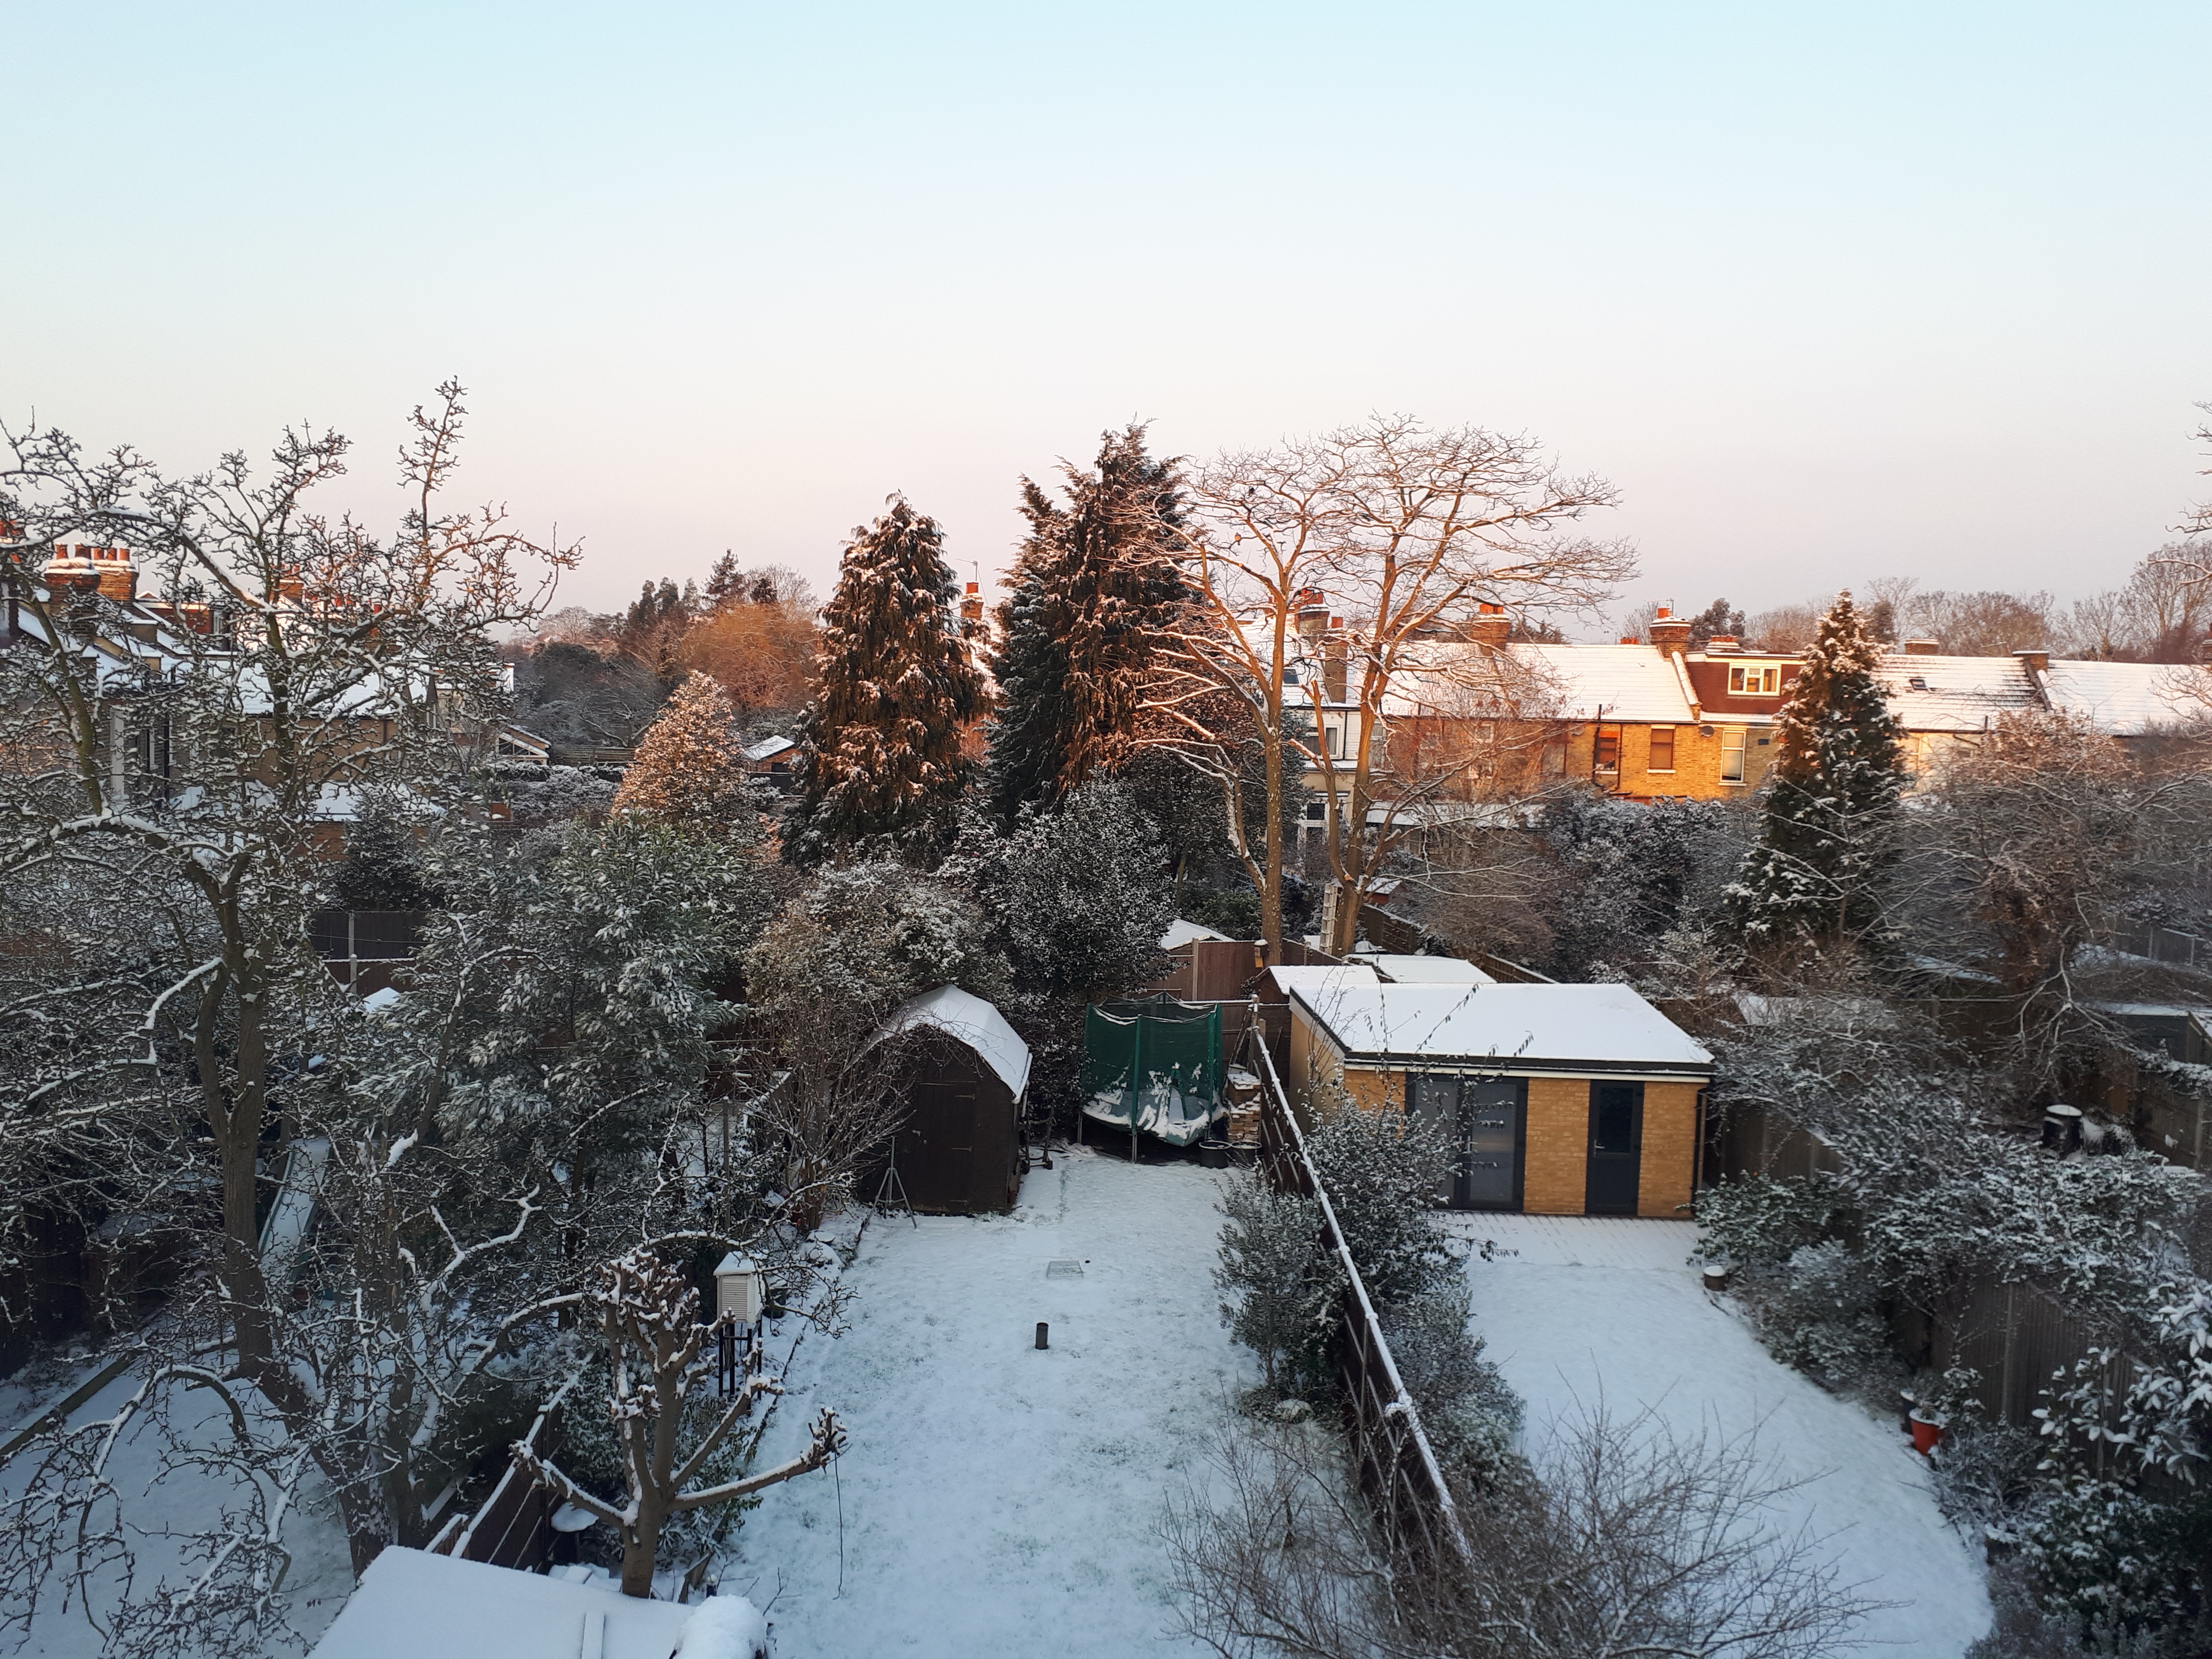
February 2018 saw the start of the first decent cold spell since 2013 with thick (by modern standards) snow cover, deep cold air and bitter winds.
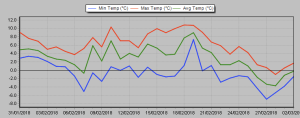
February 2018 is marked by the steady downhill temperature trend from the 18th.
It was the coldest February since 1991, the mean temperature of 2.8C was just over 2.5C below average. The month was ‘cold’ though it was the 19th onwards that really dragged the value down.
Precipitation was just below average; just over 34mm is 87% of average.
It was a sunny month, the sunniest February since 2012 and the 12 sunniest in a local record going back to 1881. Some 87.9 hours were recorded, 120% of average. Of that top 12, eight have occurred since 1988! A mix of changes in weather patterns, industry and council action?
Air frosts: 16. Ground frosts: 19. Snow falling: 6 days. Snow lying: 3 days (greatest depth 8cm 28th)
There’s been much anticipation regarding the forthcoming sudden stratospheric warming (SSW) event with many hoping that a resultant split vortex will result in unseasonably cold weather in the UK and… copious snow in the low-lying south-east.
An SSW event, which reverses winds high up in the atmosphere from a westerly to easterly, can downwell into the troposphere, bringing weather from a (usually) cold continent instead of the warm Atlantic.
While a split PV event is usually more conducive for cold weather in the UK, as opposed to a ‘displaced vortex’, which usually favours only the eastern US, it is by no means a guarantee of a cold pattern subsequently evolving.
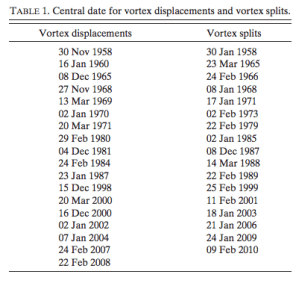
Using results published in the paper Tropospheric Precursors and Stratospheric Warmings (Judah Cohen and Justin Jones), along with meteorological data for east London, I set out to find what influence past warmings had on the weather in the capital.
Looking 45 days either side of the central date for vortex splits gave the following, chaotic graph.
But every year is different. And there appears to be more likelihood of an SSW making a difference, in terms of prompting a colder pattern, the earlier in the winter it occurs.
The SSW in 1985 was followed by a 45-day mean temperature anomaly of -3.8C! If you look at a shorter timescale, 15 days after a split PV and the anomaly is -10C on January 16th: -4.9C is the second coldest January day in Wanstead of the past 60 years.
At the other end of the scale the SSW event on March 23rd 1965 was followed by a POSITIVE anomaly of 3.4C. Perhaps solar influence this late in the year can override any SSW? Elsewhere, however, according to the website london-weather.eu: “3rd March – A combination of deep snow cover and clear skies allowed minimum temperatures to fall below -21C in northern Scotland.”
During another SSW in 2001 results in London were fairly unremarkable though heavy snow fell in Ireland.
This graph shows a general downward trend in the 15 days following an SSW event
The other result to consider is the influence from ENSO. It seems that when La Nina is ‘too negative’ this can ‘overcook’ proceedings and actually leave our part of the UK with a positive anomaly, as this table shows. It should be noted, however, that thicker Arctic ice in the 1960s would also possibly have had more influence than now.
There hasn’t been a full SSW event for years. The impact this one will have on our weather in London, a tiny part of the globe, is impossible to quantify. Though the latest model output is encouraging for anyone looking for a chilly end to winter.
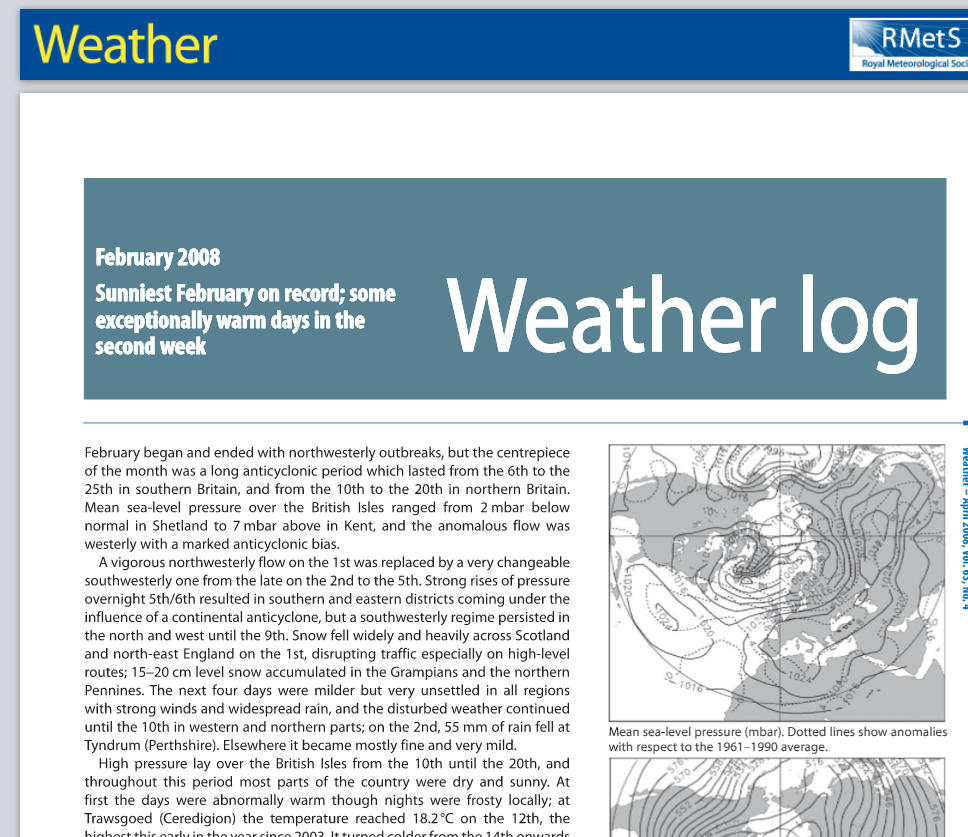
Recent model output that has many bullishly predicting a cold spell in February reminds me of the winter of 2008 when the likes of the GFS and ECMWF models kept teasing us that a Scandinavian high pressure was imminent.
This rare pattern brings the south-east its coldest weather in winter, in the past bringing the January 1987 and February 1991 cold spells.
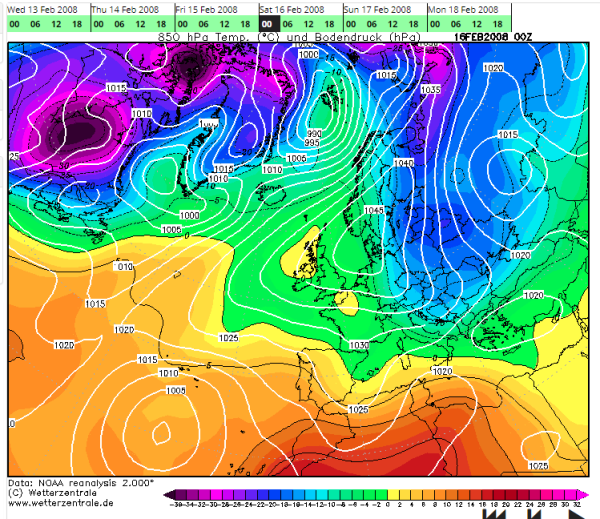
Midnight on February 16th 2008 just before the high moved south, taking its cold weather into the Balkans
A look back at the pressure patterns in 2008 show that high pressure was in the ‘right place’ between the 11th and 16th but, just as -10C uppers looked poised to flood across from eastern Europe, the high pressure collapsed south, leaving the UK in a SE’ly flow off a mild France.
There was snow in 2008 but it didn’t arrive until the spring, in late March and, the best fall, in early April when I remember waking up on the 6th to a 5cm covering that mostly melted by lunchtime.
I suppose the one silver lining for any coldies reading this is that February 2008 was the sunniest on record.
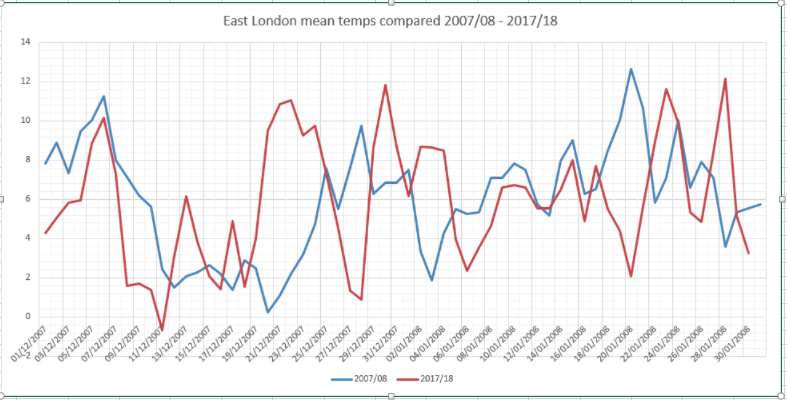
The mean temperature for December 1st – January 30th is 6C for both 2007/08 and 2017/18
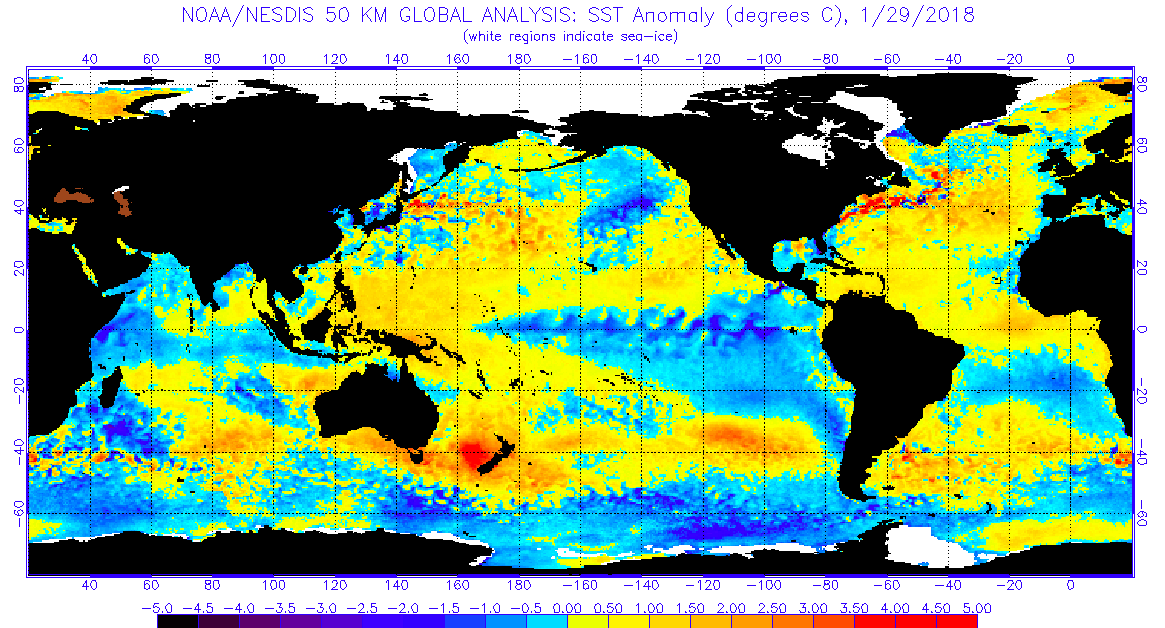
The maps below show the sea surface temperature anomalies. A slight La Nina on both. ENSO, considering my winter forecast, has been the best guide for how this winter has so-far panned out – front loaded.
Philip Eden’s column in the journal Weather showed that there was some wintry weather in February 2008 but it was restricted to the north of England northwards
* The focus of these blogs is usually on what the weather was, or may be, like in my backyard – though they usually broadly apply to anywhere in the south-east that is close to sea level.
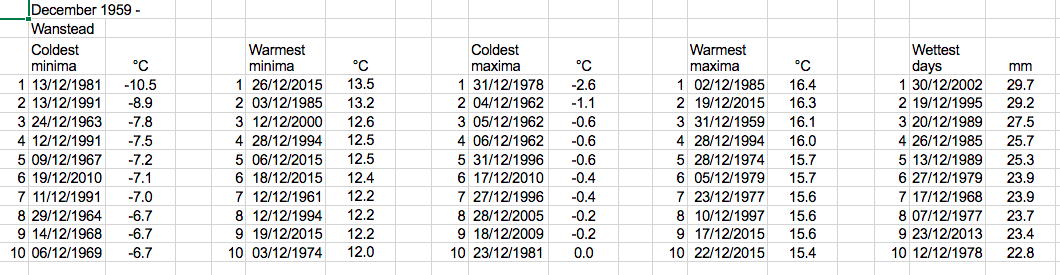
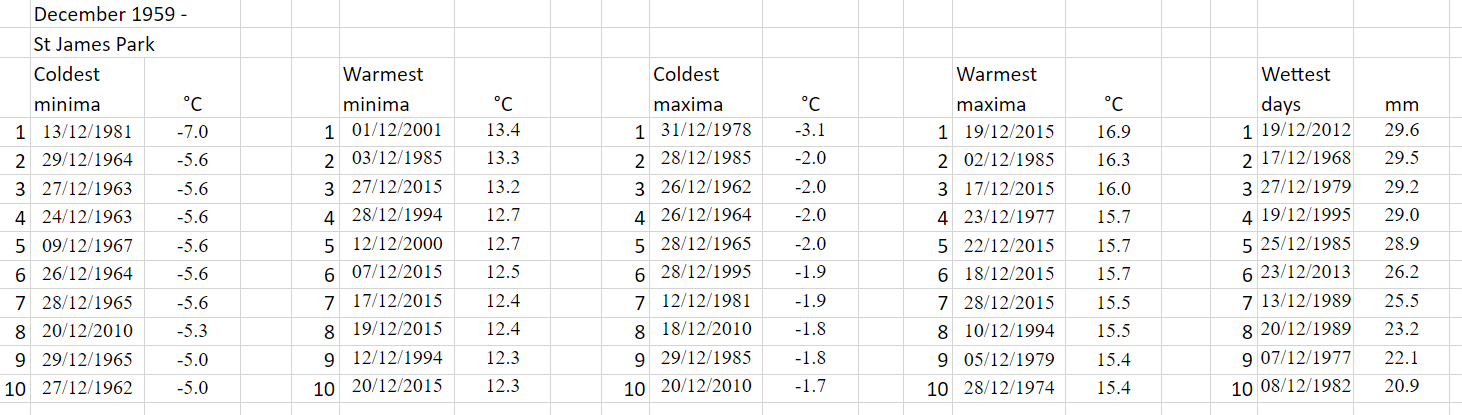
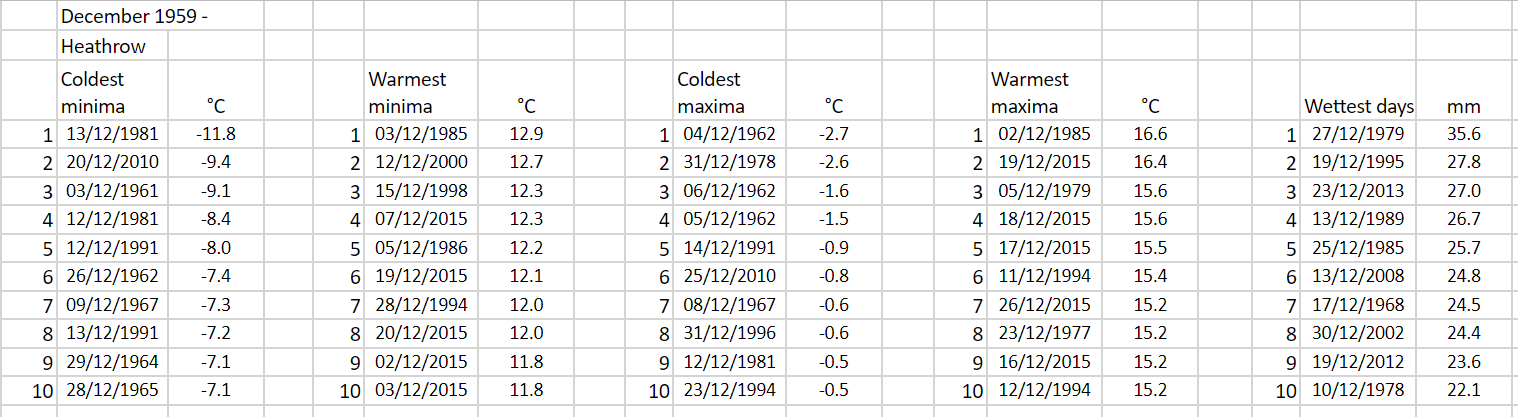
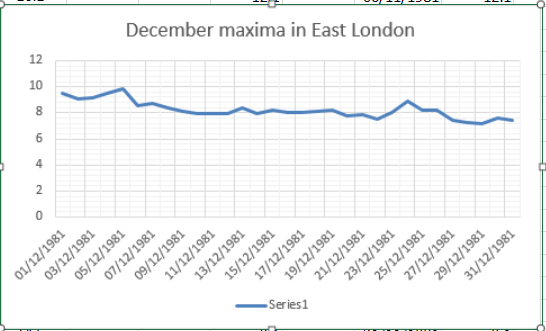
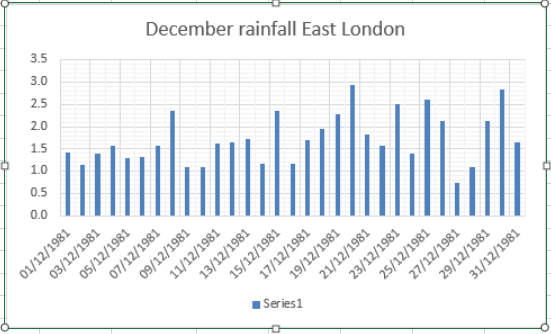
I’ve put together a few top 10s of stats for Wanstead, St James’s Park and Heathrow for the month of December.
Probably most notable is how the month in 1978 lurched from being very mild and wet to very cold in under three weeks later, setting up one of the coldest-ever winters.
Some national UK December values according to TORRO
Here’s a couple of graphs showing the maxima and rainfall. Notice the spike just before Christmas day which reflects the singularity which has an 84 per cent probability.


 Using results published in the paper
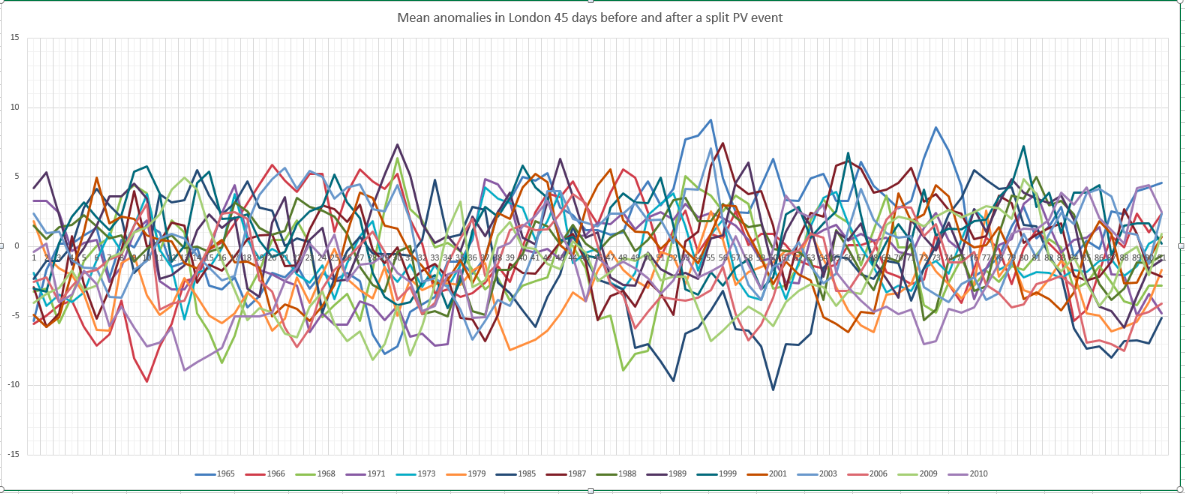


 The other result to consider is the influence from ENSO. It seems that when La Nina is ‘too negative’ this can ‘overcook’ proceedings and actually leave our part of the UK with a positive anomaly, as this table shows. It should be noted, however, that thicker Arctic ice in the 1960s would also possibly have had more influence than now.
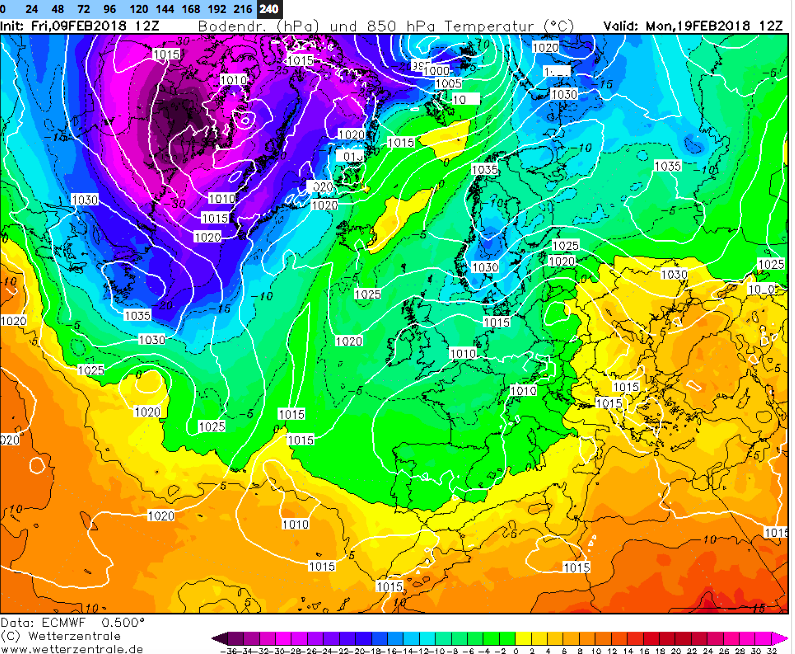


You must be logged in to post a comment.