There’s been quite a few superlatives thrown at this early January cold spell, not least the recording of the coldest January night at Altnaharra in 15 years.
Snowfalls across the Highlands, Lake District and northern England have been notable in their longevity relative to recent years.
But the absence of any lying snow at 9am in this locality and fairly standard minima for January left me looking elsewhere for something notable.
Airmass battlegrounds are a regular feature of UK winters though I can’t remember a time when this region has been right on the boundary.
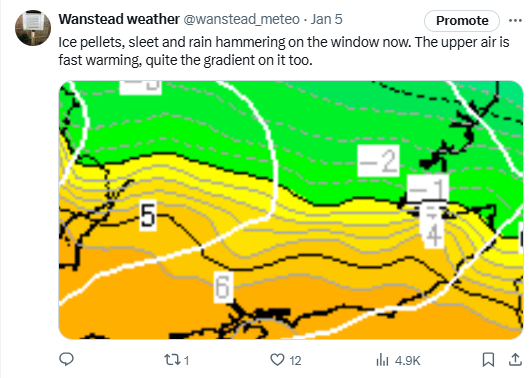
The temperature on the 5th climbed from 3.2C at 0810 to 11.3C at 1050. Here it hovered until 0710 on the 6th before plunging to 3.2C again by 0910 – a period of just 2 hours.
There was some transient snowfall on the evening of the 4th but it lasted a matter of hours with the incoming warm air after midnight..
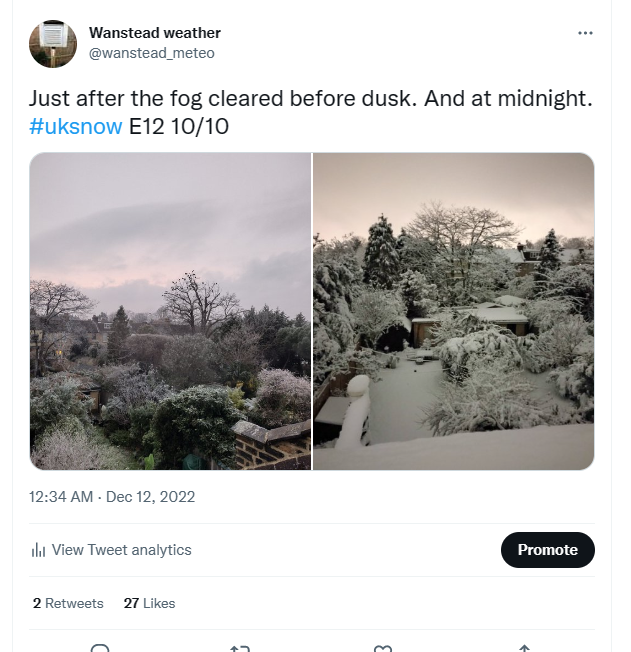
The morning of December 11, 2022, began cold after an overnight frost that saw temperatures fall to -5.3C. Freezing fog lasted through the day, coating everything in rime to set the stage for what was to be one of the most notable snowfalls in years.
Precipitation started just before 7pm with a mix of rain, ice pellets and wet snow, this soon turning to all snow within 10 minutes and settled fast.
By 9pm there was a good 6cm; Wanstead Park was soon transformed.
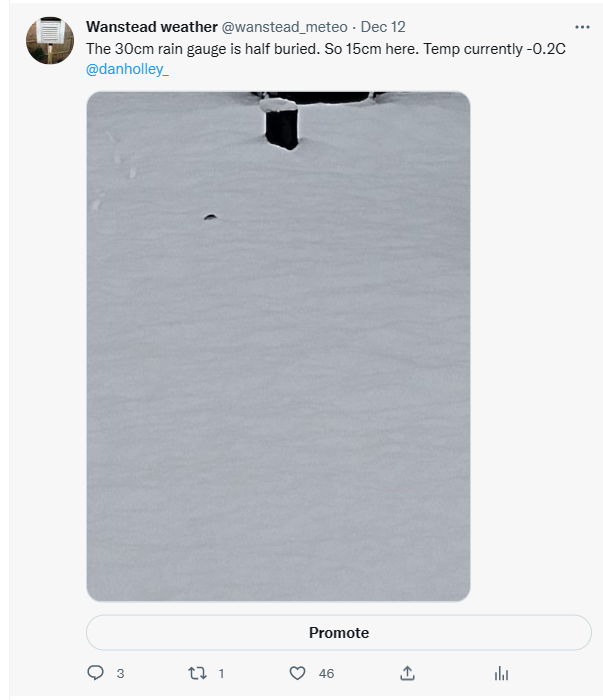
By midnight the snow had stopped, leaving a good 13cm out the back
Yesterday's snow sequence shows how concentrated this event was and that Wanstead seems to have been the area that benefitted most. It also seems to have died rapidly over the Chilterns @LondonSnowWatchpic.twitter.com/RYO5RijQXw
This mountaineering challenge was first drawn to my attention by Iain Cameron’s Flickr post featuring the Scottish Mountaineering Club’s week long tour from Balmoral to Glen Nevis.
It’s a fascinating feat that was repeated in 2010 by father and son team, Roger and Finlay Wild. Alas, the weather has not allowed the achievement again, at least on skis.
I’d often wondered about what sort of snow you’d need to complete and recently discovered a feature on Ogimet that can scrape old weather data and place it into a table.
Just look at the snow depths below! As the SMC account says the participants would have been better undertaking the tour a week earlier, rather than starting four days into a thaw. The depths in earlier February, however, illustrate just how good the conditions would have been, compared with today!
A full account of the original tour can be found here.
Last November was on the cold side prompting me to investigate whether we were about to record a third month in a row below average. December turned out to be mild and wet, the lack of snow especially stark in Scotland.
The findings of that study showed that any sustained period of colder than average months was more likely to happen during months of March, April and May, nothing unusual there, especially considering H.H Lamb’s weather types.
I decided to scrutinise further all the colder than average months in this area, considering the 1981-2010 average, back to 1981. This gave the below results.
The dataset covers 399 months, of which 200 were colder than average.
The overall picture shows that negative anomalies are becoming more and more rare, though with notable exceptions being March 2013, December 2010 and January 2010.
The only month that has showed any sort of consistent general decrease in negative anomaly is November.
*For good snowfall at this station needs a negative anomaly of 2C during the months of November, December, January and February.
Two hundred years ago this October the extremely rare phenomenon of lying snow in October was recorded in London.
A likely plunge of Arctic air on the 21st saw rain turn to snow which lay nearly 8cm deep by the morning and remained for nearly a week.
The month started dry and warm. On the 1st Luke Howard recorded 75°F at his laboratory in Stratford. The warmth remained into the second week with 77°F recorded on the 10th, 11th and 12th.
The values from Luke Howard’s Climate of London.
The wind swung into the north on the 18th and with it arrived the first hoar frosts that were cold enough to kill garden plants.
On the 21st the cold air further dug in and with it rain that turned to sleet. Howard said: “It began to snow about noon falling in very large flakes thick and rapidly for an hour and covering the ground. Some rain followed.
“In the evening the wind rose and it blew hard in the night from NNW. At midnight came a second heavy fall of snow which continued till 6am and though at first much of it melted it lay in the morning a full three inches deep.”
Howard adds that the surroundings ‘took on appearance of mid winter with the single exception of the foliage still remaining on the trees which mingled with an enormous burden of snow presented a very singular and grotesque appearance’.
The weight of the snow was also enough to break off large limbs from fruit trees.
The snow was still lying on the 23rd and, probably caught out by the earliness of the polar plunge, swallows were seen at Stamford Hill. On the 24th a very white frost was observed with a low of 31°F recorded at Tottenham.
The event was covered in the national press. The Imperial Weekly Gazette mentions impassable roads in to London, including at Walthamstow.
More wintry weather followed in November, December and January.
Could snow fall here again in October? The probability is very low but it is not impossible, given the right synoptic conditions. Recent cases of notably positive and negative anomalies following in quick succession somewhat mirror the weather of Howard’s day.
My winter forecast went a bit awry in December – I predicted a mean of +0.8C, the outcome was +1.7C. January has been much better, I predicted -1.2C, the outcome is -1.1C! Also… “And another cold spell end of January into the first week of February?”
For February I predicted a mean of -1.7C. The current pattern to continue and signs on the EC of a more robust cold spell with air supplied by a Scandinavian high?
Five years ago I blogged about the lack of snow at the midway point through winter. This winter there has been a similar total lack of snowfall though this time it is benign anticyclonic conditions that have characterised the past 45 days rather than the raging zonality of the winter of 2013/14 which ended completely snowless in this area.
A look at the statistics reveals that the midway point of winter is the mildest for 3 years and the 6th mildest since 1960. There has also been around half the rainfall that we had to this point in 2018. Sunshine is similar and below average.
Since December 1st, Wanstead has recorded just 7 air frosts – 5 fewer than last year. The coldest night was just -2.5C. The current mean temperature this winter to January 14th is 6.9C with rainfall 60.6mm.
Further scrutiny of stats for the Wanstead area reveal few years were similar to this winter. Using my method for finding patterns stretching back over 50 years to forecast this winter I picked out years that were +/- 10% of the 2018/19 rainfall total. From these I then weeded out the seasons where the mean was within +/- 10% of the this year. This gave a list of three winters with similar temperature and rainfall.
The other winters weren’t anything special with ‘snow lying’ days below the median for this area of six.
Snow go: just patches of snow were visible on the upper runs of Nevis Range at the weekend on Jan 12th
As I write there are signs that the weather is going to turn colder this week. Whether it will be cold enough for snow remains to be seen though the ECM model is hinting at a rise in pressure around Greenland. A situation that *could* be conducive for something colder long term.
In summary, the probability at this point of at least one fall of snow before the end of February could be put at 100 per cent. Whether it will be abundant or merely a dusting is impossible to tell.
Elsewhere in the UK it has been similarly lacking in snow. During a visit to Fort William at the weekend locals told me that there has been no significant snow since October / November and that even frosts were few and far between. The lifts around Nevis Range looked forlorn against a green backdrop. And it wasn’t until I got to the summit of Ben Nevis and Aonach Mor that I saw any of the white stuff.
Weather models are continuing to struggle in the aftermath of the stratospheric sudden warming on January 1st. The GFS and ECMWF have flip-flopped: on one run decent northern blocking extends southward only for the dreaded European high to appear on the next.
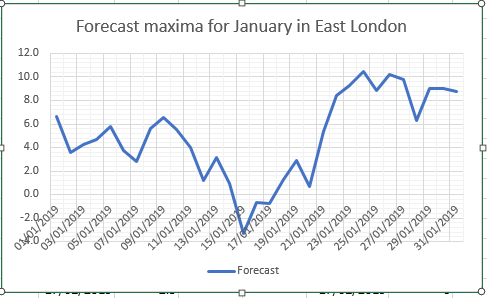
Using a combination of QBO and ENSO data featured in my winter forecast and statistics from previous SSWs (including 2013 and 2018) achieved the following results shown in this graphic.
Although some days in the next week or so will be cold it is not until the 14th that conditions start to bite, the start of a week-long cold spell that will probably be more notable for cold than snowfall.
The rapid recovery in temperature would suggest that the Azores / European high making a return. With the MJO moving back and forth between phase 7 and 8, and looking at the behaviour of previous cold spells, this would make sense.
The GFS has been churning out some very strange charts of late
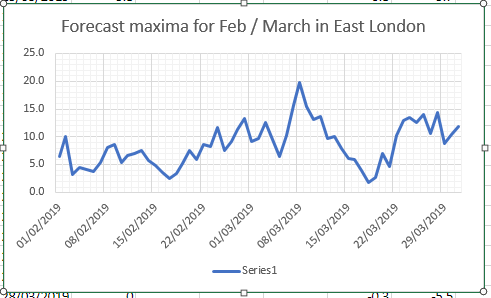
As for February, unless there are further SSWs to disrupt the polar vortex, and depending on its recovery, it is unlikely we will see a repeat of the winter of 1984/85 that I hinted at last month. The graphic below, however, would suggest another cold spell in the third week of February.
With talk of an imminent statospheric sudden warming (SSW) I thought it would be interesting to have a look back at previous SSWs and see what precedents could be found.
December so far is showing similarities with 1984: mean maxima is within 0.3C of 1984 while rainfall is virtually the same at around 30mm!
During the winter of 1984-85 the polar vortex split on January 2nd, setting up that month to be among the coldest of the 20th century, on a par with 1979 and 1987. A more recent January that was just as cold was 2010.
Indeed, the winter of 1984-85 was among the snowiest of the past 70 years, ranking at number 5 in my survey of winters.
Long range modelled forecasts have been all over the place of late and, looking at the underlying signals, it is easy to see why.
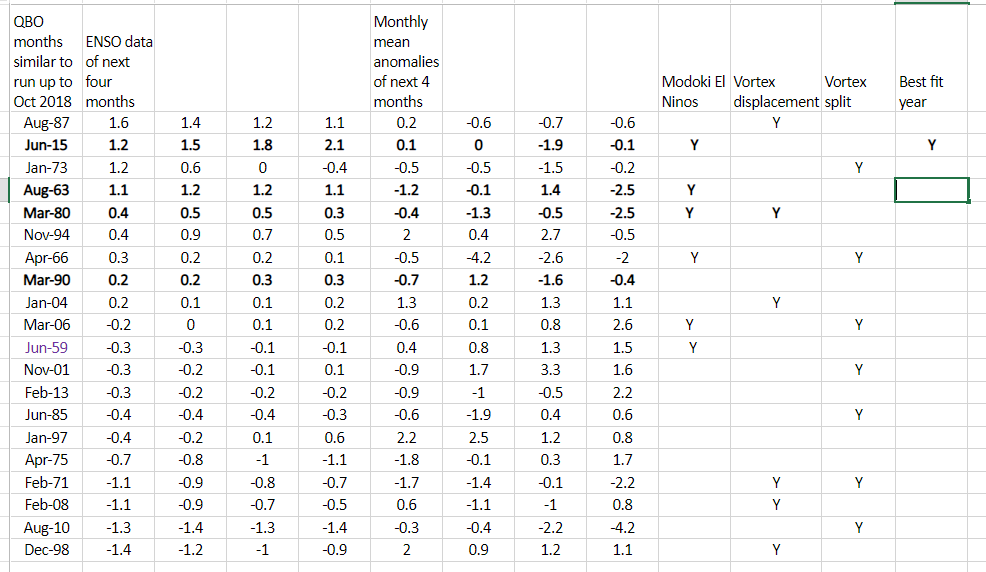
When I’ve produced these forecast in the past, in terms of QBO and ENSO data, there’s usually a lot of analogues to compare with. This year, however, seems to be an exception.
Considering QBO first I looked back over data to 1950 and found nothing similar for October. However, looking over the whole series the cyclical nature of this circulation may give some clue.
Some 20 months were revealed, ranging from June 1959 to June 2015. Using NOAA’s Niño 3.4 region I narrowed this list down to the few that had an ENSO value of around +1 with a rising trend. With NOAA’s forecast of a Modoki El Nino (one that occurs in the central Pacific) this narrowed the list to just 1 period: June 2015. Considering maxima anomalies this would give the following winter.
The above would suggest there being a general cool down through December with a cold spell starting just before Christmas into the new year? And another cold spell end of January into the first week of February?
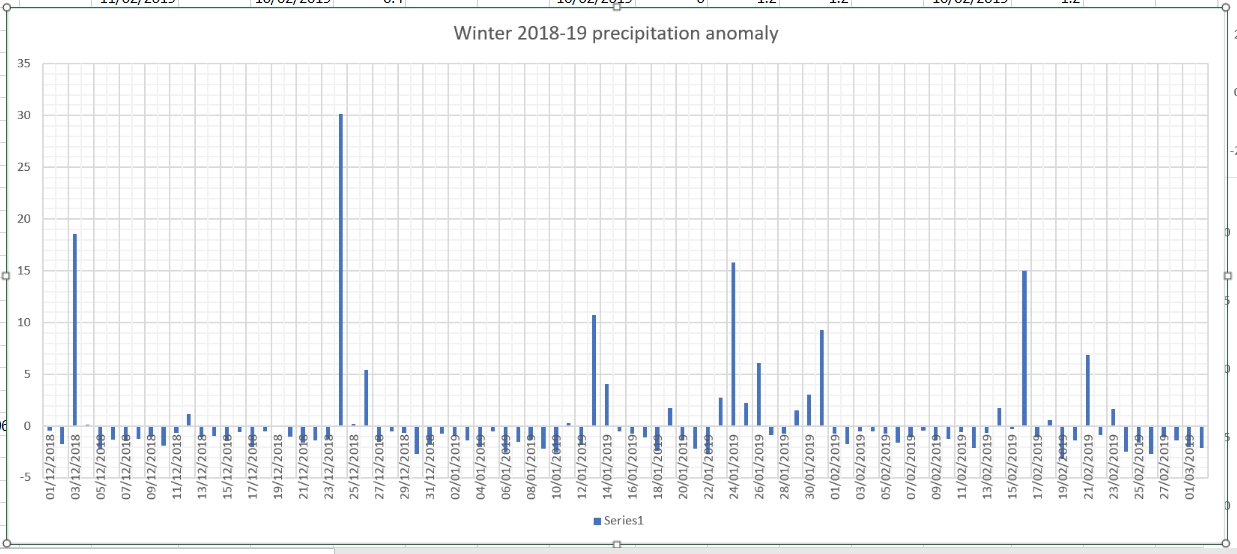
The above precipitation anomaly chart would suggest a wetter than average December, January and February, though February by much less so.
It’s been a very busy autumn so I’m keeping this short.
The below figures, particularly January and February, may be different in the event of an SSW occurring. In all then.


You must be logged in to post a comment.