Two April heatwaves compared

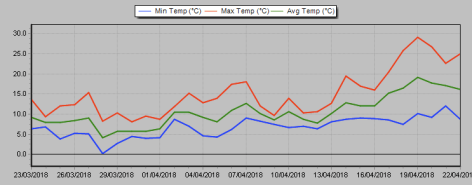
The stats are in and the average maxima for the past few days’ heatwave is 1C lower than the hot spell in 2011: a positive anomaly of 10.6C over six days.

Screen Shot 2018-04-23 at 13.34.29Screen Shot 2018-04-23 at 13.34.21

Although this year’s spell pipped the previous April high temp by 0.2C, the 2011 spell saw slightly higher temperatures and were recorded in a month that finished 3.3C above average – the average for this April is likely to finish only 2C above average.

April 2011 also saw just 3.3mm of rain recorded. The rainfall so far this month is already at 36.7mm, with more likely before the end of the month.

The spell in 2011 saw 74 hours of sunshine in total while this spell only saw 58 hours.

In terms of this summer it is quite possible that we won’t see a week with higher maximum anomalies or more sunshine than we saw across the southeast this week. To give you any idea of just how anon. warm last week was here is what the equivalent temperatures would be at the end of July, on average the warmest time of the year.

25th 29.8
26th 35.4
27th 39.2 (102.6F)
28th 37.7
29th 32.1
30th 33.3

* The Met Office definition of a heatwave (the same as the WMO) states:  “When the daily maximum temperature of more than five consecutive days exceeds the average maximum temperature by 5 °C, the normal period being 1961-1990”.


This slideshow requires JavaScript.


This slideshow requires JavaScript.

Screen Shot 2018-04-23 at 13.44.09
The large anomalies of the past few days can be seen on this thermo trace

London’s April extremes since 1959

April showers bring spring flowers… so the saying goes though a look at local east London stats shows that eight of the last 12 Aprils have been drier than average, some remarkably so.

I’ve put together a few top 10s of stats for Wanstead, St James’s Park and Heathrow for the month of April.

Probably most notable from the below values is that 5 of the top 7 maxima were recorded during a warm spell in 2011.

Frosts can be common and are often sharp, playing havoc with budding plants

Snow can fall in April – a good few inches fell early in the month in 2008 – though any accumulation is usually short lived.

Rain – the characteristic April showers – is usually most frequent at the end of the month.


april updated 1959

SJP april

heathrow apr


The chart slideshow below show the synoptic situation which brought a notable warm spell in the second half of April 2011.

This slideshow requires JavaScript.

Some UK April values according to TORRO

Hottest: 16th 1949: 29.4C at Camden Square, London.
Coldest: 2nd 1917: -15C at Newton Rigg, Cumbria
Wettest: 22nd 1970: 182.1mm at Seathwaite, Cumbria

In terms of climatology April maxima, considering the 1981-2010 average, shows a gradual increase through the month, though around the 21st there is often a jump of 3-4C, the start of a warm spell before rain arrives at month’s end.

The average rainfall graphic reflects this, showing a three-day drier spell after the 20th.

april max

april rain


March 2018: cold, some snow and very dull

Though March is usually, meteorologically speaking, the first month of spring this year it felt more like an extension of winter.
Screen Shot 2018-04-01 at 11.09.47
This graph shows that the two visits from the “Beast From The East” were only enough to momentarily dent the average.

The mean temperature for March 2018 finished 6.3C, that’s 1.4C below the 1981-2010 average, the coldest for five years but still nearly 3C warmer than the exceptional March of 2013.

Some 61.5mm of precipitation fell, that’s 151 per cent% of average and the wettest for 10 years, pipping the wet March of 2016 by just 1.2mm. The 38th= wettest March since 1797.


Screen Shot 2018-04-01 at 11.17.13
The wet end to the month is shown on this graph.
Perhaps most notable in this region was the lack of sunshine. There was just 59.1hrs recorded, that’s just 54 per cent of the 1981-2010 average. The dullest March since 1984 and, more notably, the 5th dullest March back to 1881!
Though there were no notable night frosts, the coldest night fell to just -3.8C, the cold pattern was enough to create three new entries in the top 10 of coldest March days in Wanstead and further afield in the capital.
With 6 more days of ‘snow lying at 9am’ winter 2017-18, the snowfall season stretches from October to May, was boosted up to 20th place on my snow index.
Summary for March 2018
Temperature (°C):
Mean (1 minute)  6.1
Mean (min+max)   6.3
Mean Minimum     3.0
Mean Maximum     9.6
Minimum          -3.8 day 01
Maximum          15.3 day 27
Highest Minimum  8.0 day 15
Lowest Maximum   0.5 day 01
Air frosts       5
Rainfall (mm):
Total for month  61.5
Wettest day      9.0 day 30
High rain rate   12.1 day 12
Rain days        20
Dry days         11
Wind (mph):
Highest Gust     24.4 day 08
Average Speed    3.2
Wind Run         2411.5 miles
Gale days        0
Pressure (mb):
Maximum          1032.3 day 20
Minimum          983.3 day 11
Days with snow falling         4
Days with snow lying at 0900   6
Total hours of sunshine        59.1
snow mar 1
19th march snowmar 3 tree eng thawmar 3 thawmar 2 snowmar 2 roadsmar 1 rada