The mean temperature finished 6.1C, that’s 0.7C above average, the mildest for 3 years.
Rainfall was below average: 127mm fell, that’s 87 per cent of average and the driest for two years.
Sunshine was well above average: 211.6 hrs is 126 per cent over average, the sunniest for seven years.
The warmest day of the winter occurred on December 30th with 14.2C recorded. The warmest night was on January 28th when the temperature fell to just 10.8C.
The wettest day of the winter occurred on January 2nd when 15.3mm was recorded.
Snow first fell on 5 days between January 22 and February 1st: five days of snow falling and two days of snow lying over the three months is below average.
There were 29 air frosts during the three months, seven above the 1981-2010 average.
A full weather diary is available for the months of December, January and February. To view full stats for each month follow this link:http://1drv.ms/1kiTuzv

Summary for period 01/12/2018 to 28/02/2019
Temperature (°C):
Mean (min+max) 6.1
Mean Minimum 2.6
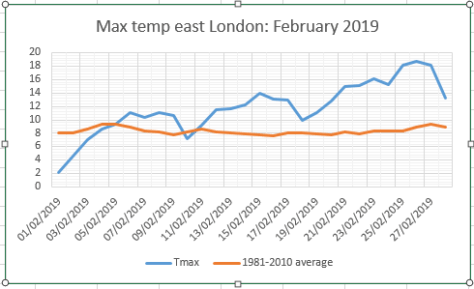
Mean Maximum 9.7
Minimum -6.5 on 30/01/2019
Maximum 18.7 on 26/02/2019
Highest Minimum 11.5 on 06/12/2018
Lowest Maximum 1.3 on 23/01/2019
Air frosts 29
Rainfall (mm):
Total for period 127.0
Wettest day 11.4 on 20/12/2018
High rain rate 28.1 day 26/01/2019
Rain days 31
Dry days 59
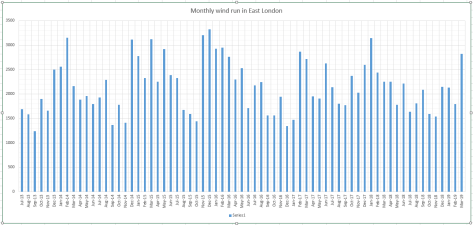
Wind (mph):
Highest Gust 31.1 on 09/02/2019
Average Speed 2.8
Wind Run 6152.3 miles
Gale days 0
Pressure (mb):
Maximum 1043.8 on 02/01/2019
Minimum 980.4 on 01/12/2018
Days with snow falling 5
Days with snow lying at 0900 2
Total hours of sunshine 0.0


You must be logged in to post a comment.