Today marks the 866th consecutive day that the rolling 365-day mean has been above 12C, a level that is nearly a degree above the average annual mean temperature for this region.
The next longest period, back to 1960, was 499 days starting on June 9th 2003.
The graph below shows that since around 2015 this 23,644 day period has been stuck in a high rut.
Looking at months on their own it has now been over 20 since this station recorded a month around a degree cooler than average.
The monthly mean temperature anomalies considering 1981-2010 averages.
This September is looking like it will be yet another milder than average month. If the mean for 2024 finishes above the level of 12C it will be the third 12C year in a row!
Prior to this an annual mean of 12C has been recorded on only 11 occasions since 1960: 1989, 1997, 1999, 2002, 2003, 2011, 2014, 2018, 2020, 2022, 2023 .
The current site hosting Wanstead’s weather station has been running for 11 years this month; the automatic station uploading data every 10 minutes to the internet.
A look at the eleventh month shows some interesting trends…
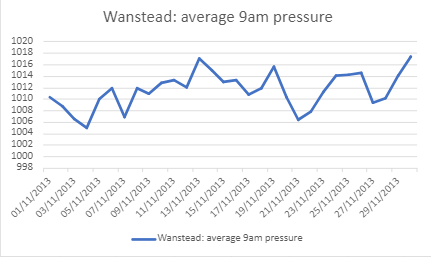
The 9am air pressure readings were not included in previous climate summaries owing to analogue barometers only giving approximate air pressure readings. The advent of AWS has changed that, particularly for independent amateur observers.
A look at the below graphic shows pressure lowest around the 4th, the stormiest weather of the month. Storm Ciaran in 2023 is proof of that.
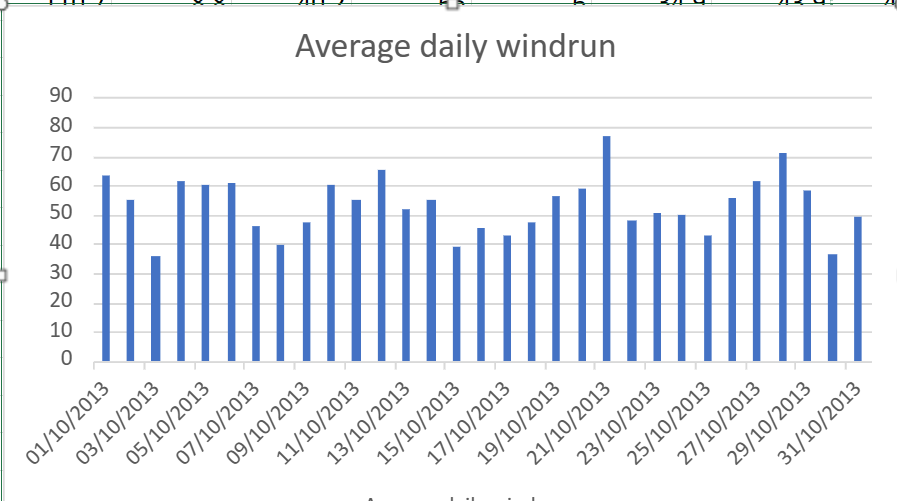
Average daily windrun is how much wind there’s been during a 24 hour period. The 21st comes out as windiest, the date when in the past there has been some notable early snowfalls in the south of the UK.
Average rainfall shows most precipitation in the first two thirds of the month with the biggest fall of rain on the 19th.
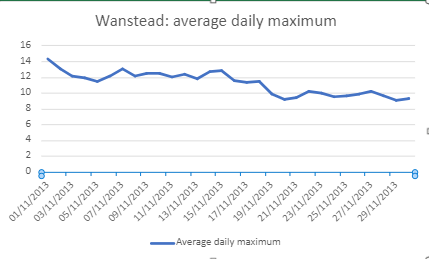
Average daily maximum temperatures during November take a general decline but, again, there’s a notable fall away on the 20th.
The current site hosting Wanstead’s weather station has been running for 11 years next month; the automatic station uploading data every 10 minutes to the internet.
The 10-year averages from the station are now good enough to be listed on the Climatological Observers Link.
A look at the tenth month shows some interesting trends…
The 9am air pressure readings were not included in previous climate summaries owing to analogue barometers only giving approximate air pressure readings. The advent of AWS has changed that, particularly for independent amateur observers.
A look at the below graphic shows pressure lowest around the 21st, the stormiest weather of the month. Storm Babet in 2023 is proof of that.
Average daily windrun is how much wind there’s been during a 24 hour period. Again the 21st comes out as windiest.
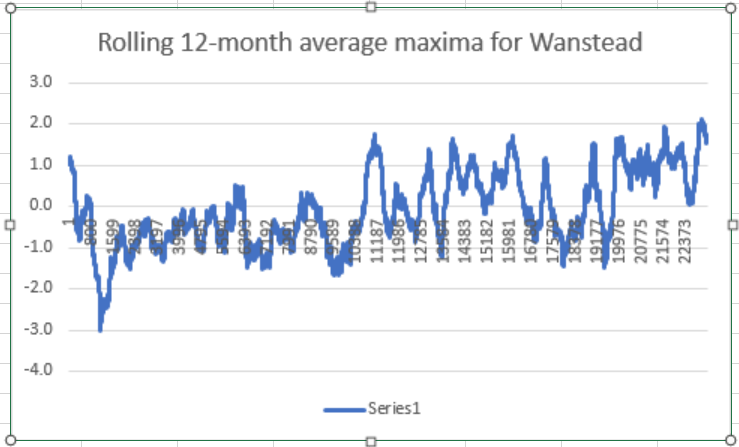
The rolling 12-month average maxima anomaly in Wanstead on June 10th is sitting at 1.6C.
Considering local statistics back to 1959 the figure reached an all-time high of 2.1C last November, a level it stayed until December 11th, when a very remarkable week of snow and frost arrived.
With unremarkable maxima for most of this year the figure has been falling. But with a building El Nino it remains to be seen if the highest anomaly ever of 2.1C will be breached.
The crux of the article is that certain weather types can repeat at the same time of year with one having a 100 per cent probability!
The Christmas storm singularity occurs in 84 per cent of years.
While 84 per cent certainly doesn’t mean ‘nailed on’, in the current set up of models being evenly spread between settled and stormy it can be safely guessed at this range that there will be unsettled weather around on the 25th. Whether it will affect the whole country remains uncertain.
The last big snorter of a Christmas storm I can remember in London was 2013. The entry for the 23rd into the 24th reads.
“Cloudy and breezy start grew steadily duller with rain just before noon. Rain grew heavier with some really strong gusts into evening culminating at 2am. Cloud at one point was 10kms thick. Three deaths related to weather.”
There was chaos nationwide with flooding and power cuts.
This winter is most likely to be on the colder side of average with near normal rainfall.
While the modelled prognosis for the first half of December looks unsettled with an Atlantic influence evolving from the current chilly NW’ly to a mild SW’ly, local analogues of the climate of London suggest the season could be a bit of a rollercoaster with spells of wet, windy and mild weather alternating with dry, calm and cold.
A large factor to consider this winter is the presence of a slight La Nina that is forecast to evolve cooler.
Given the uncertainties involved with the influence of ENSO I’ve decided to stick with analogues found in local data that stretches back to 1797.
Overall then the probabilities for the next 90 days are.
Mean
Probability
Rainfall
Probability
Mild (>5.9C)
14%
Wet (>178mm)
19%
Average (5.1C – 5.9C)
38%
Average (107-177mm)
62%
Cold (<5.1C)
48%
Dry (>107mm)
19%
The above table doesn’t reveal a great deal in that extremes can be hidden in a month or season that finishes broadly average. So I decided to look closer at the winters that were revealed in the analogues.
December
The first month, as already mentioned, looks like it will be on the mild side with possibly a notable storm off the Atlantic before things calm down over Christmas – the period between Boxing Day and New Year’s Eve possibly presenting the best chance of any lying snow in this region.
The below graphs are a smoothed representation of the years revealed in the analogues most similar to this autumn.
What is probably most interesting is that the analogues that shared a similar ENSO / La Nina index to this autumn tended to ‘turbo charge’ any yo-yoing in the weather type, be that super-mild or abnormal cold.
December probabilties for maxima: Mild: 48% Average: 19% Cold: 33%
And precipitation. Wet: 33% Average: 29% Dry: 38%
So, the month overall will be mild and slightly dry
January
The first month of 2022 probably represents this region’s best chance of lying snow this winter. A mild start perhaps with a falling off of temperatures in the final third of the month and a cold spell of a week or so. As with December the influence of La Nina could tend to boost the swings in the pattern.
January probabilties for maxima: Mild: 33% Average: 10% Cold: 57%
And precipitation. Wet: 19% Average: 43% Dry: 38%
Greatest chances for January, then, are cold with average precipitation.
February
The second month may see a slight return of the cold spell in January before temperatures recover for a mild and wet spell in the second half.
February probabilities for maxima. Mild: 33% Average: 15% Cold: 52%
And precipitation. Wet: 38% Average: 38% Dry: 24%
The stats suggest on the cold side overall with average to above average rainfall. Perhaps the depth of the cold skewing any very mild second half of the month?
The extremes that no-one can forecast
As well as the very mild winter of 1989/90 the analogues also revealed the very cold winter of 1978/79. There were others but their occurence makes the probability of a repeat at either extreme at less than 10 per cent.
Compiling a list of sunless, rainy days revealed some interesting spells of wet weather – the most miserable runs of June days in the capital since 1959.
First up was a three-day spell starting on June 25, 1974. Some 34.3mm of rain was recorded.
Next was a three-day spell starting on June 23, 1991. Some 26.3mm of rain was recorded.
Another three-day spell started on June 25, 1997. Some 36.2mm of rain was recorded.
Finally, and most recently, a two-day spell this month that began on June 17th. Some 28mm of rain was recorded.
The above spells all happened around the date of the ‘June monsoon’ singularity which has a probability of 77 per cent. Though the fact that these occurred 47 years, 30 years and 24 years ago shows that these extreme cases happen a lot less than three years in every four the singularity would suggest.
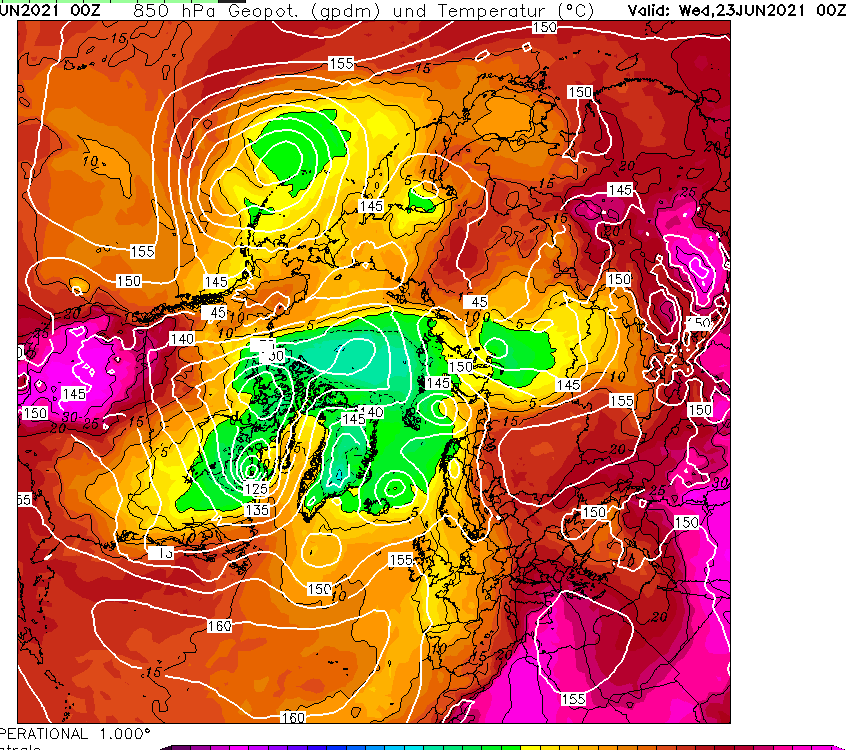
Comparing the current Northern Hemisphere pattern with 1974 suggests that while there’s just as much heat around at 850mb as there was 47 years ago, including an extreme heatwave over some Nordic countries, the air above Greenland appears colder.
The weather of late has been in stark contrast to the mostly dry, sunny (if a bit chilly) spring many enjoyed. Indeed the first half of June saw more of the same and, locally, was the warmest start to the first meteorological summer month since at least 1959.
My memory of summers years ago was that it was often hot and sunny but I also remember countless days of staring out the window for hours waiting for relentless rain to let up.
Looking back at sunshine stats to 1959 there has been over 4,400 days where no sun was recorded, roughly a one in five chance of a totally cloudy day.
Considering the months where the absence of sun is most noticed, May to October inclusive, the probability decreases to just under one in ten.
To decant these to ‘washout days’ I’ve only included those sunless days that were also ‘wet days’ where 1mm or more of rain was recorded. The probability further decreases to just under one in twenty.
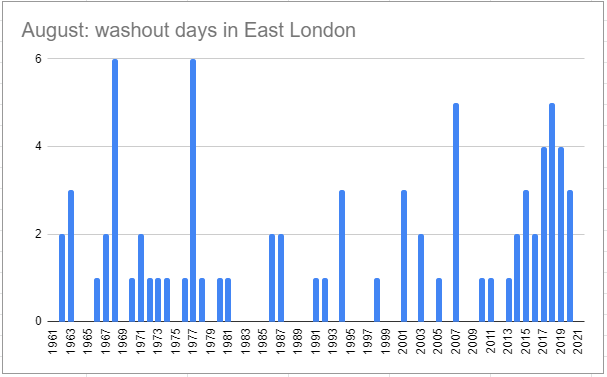
All very interesting but were there more washout days decades ago or is the memory playing tricks?
Looking overall shows an increase since 2013. Out of all the months the most notable change has been August.
Air pressure is probably the least celebrated meteorological statistic, most probably because unless you’re staring at a barometer all day you can’t ‘see’ it.
High pressure brings mostly fine weather while low pressure usually brings wind and rain – though it is the gradient of the isobars that can measure the impact each system can bring.
Steep falls and rises in pressure bring the most memorable events, in my case the October 1987 storm.
During the next week there will be a notable fall in pressure – but how will it compare with the past recent years? Looking at my own stats, a relatively small but complete set of 9am barometer readings back to May 2013, it does look like it will be notable.
The table below shows the numbers to beat.
As with many of these events the most impactful weather was found in the north of Scotland. The first period coincides with Storm Caroline. The Met Office blog says Caroline brought a max gust of 93mph at Fair Isle and transport disruption and closed schools across the Western Isles.
Of course what goes down also comes up and pressure rises can be even more notable. In February 2016 the pressure rose 50mb in just three days, a week or so after Storm Imogen.
According to the Met Office FAX charts the 9am pressure in London on March 11th will be around 988mb, which would represent a fall of 48.6mb from 9am on March 6th.
The best chance for lying snow this winter looks like being at the end of the second week of January.
A combination of local analogues and global atmospheric factors including the El Niño-Southern Oscillation suggest that the coming season will be colder than recent years. Though that’s not saying much considering just how mild winters of the past decade have been.
Meteorological autumn was the warmest for 5 years and slightly drier than last year’s wet autumn. Though it shares some similarities with 2015 the external influences are thankfully different to that season which produced the warmest December on record. Considering data back to 1797 I was able to make the following suggestions on how the next 90 days may unfold.
December is most likely to be around average temperature-wise with rainfall also about average. Possibly stormy at the end of the first week. Any snowfall events are likely to be marginal – bad news for anywhere below 70m above sea level. In terms of Christmas a white one in London looks unlikely. There may be interest in the week running up to the big day but I wouldn’t be surprised to see that inexplicable warm up that often happens just as the 25th arrives. Mean: 5.8°C (5.6°C 1981-2010 average) Rainfall: 57.1mm (53.2mm 1981-2010 average)
January is the month most likely to see any lying snowfall, particularly during the first half of the month, with the mean temperature about 1C colder than average. Rainfall is likely to be above average. Mean: 4.1°C (5.2°C 1981-2010 average) Rainfall: 63.8mm (53.2mm 1981-2010 average)
February looks wet and mild overall. Mean: 6°C (5.3°C 1981-2010 average) Rainfall: 55.6mm (39.2mm 1981-2010 average)
Overall the mean for winter: 5.3°C, a little below average. And rainfall about 120 per cent higher than average.
Looking in closer detail reveals that the coldest period is most likely to be between 13th and 19th January, with anomalies sufficiently low enough for lasting lying snow.
The extremes that no-one can forecast
As well as the extreme December 2015 the analogues also revealed the severe season of 1822-23 which saw ice on the Thames by late December. February 8th saw a great snowstorm in northern England where people had to tunnel through the snow.
Another was 1950-51 which was very snowy at high levels. There were 102 days of lying snow at Dalwhinnie (1000ft), exceeding the 83 days set in 1946-47. December 15th saw 15in of snow in Shanklin, Isle of Wight in 3.5 hours.


You must be logged in to post a comment.