
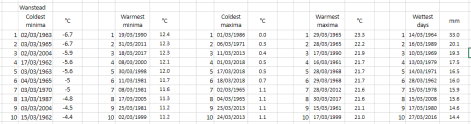
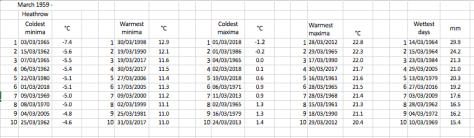
I’ve put together a few top 10s of stats for Wanstead, St James’s Park and Heathrow for the month of March.
The month, the first of the meteorological spring can offer really contrasting weather; perishing cold and very pleasant warmth are both very possible, as the values show.
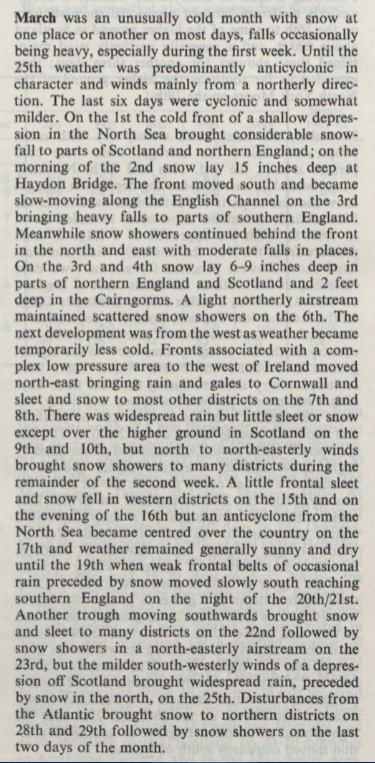
Probably most notable in the list is the cold March of 1962 which was the coldest of the 20th century and 11th coldest in a local list going back to 1797. March 2013 was also very cold. Strong winds from deep depressions often feature as does the odd blizzard.
Marches in the 1960s also appear to often start very cold and end very warm; the term ‘In like a lion, out like a lamb’ being very appropriate.
•Though this blog only covers extremes back to 1959, thanks to Met Office digitised data, I’ve unearthed records prior to this. Both W.A.L Marshall’s A Century of London Weather (covering 1841 to 1941) and J. H. Brazell’s London Weather (covering 1841 to 1964) confirm the coldest March day as the 13th in 1845 when 25F (-3.9C) was recorded at Greenwich.
The coldest March minimum was 4/5 in 1909 with 9F (-12.8C) at Epsom. Greenwich and Hampstead recorded 14F (-10C)

Some national UK March values according to TORRO
Hottest: 25C Wakefield, West Yorks – 29th 1929
Coldest: -22.8C Logie Coldstone, Grampian – 14th 1958
Wettest: 164.3mm Glen Etive, Highland – 26th 1968


 Using results published in the paper


 The other result to consider is the influence from ENSO. It seems that when La Nina is ‘too negative’ this can ‘overcook’ proceedings and actually leave our part of the UK with a positive anomaly, as this table shows. It should be noted, however, that thicker Arctic ice in the 1960s would also possibly have had more influence than now.


You must be logged in to post a comment.