Today marks the 866th consecutive day that the rolling 365-day mean has been above 12C, a level that is nearly a degree above the average annual mean temperature for this region.
The next longest period, back to 1960, was 499 days starting on June 9th 2003.
The graph below shows that since around 2015 this 23,644 day period has been stuck in a high rut.
Looking at months on their own it has now been over 20 since this station recorded a month around a degree cooler than average.
The monthly mean temperature anomalies considering 1981-2010 averages.
This September is looking like it will be yet another milder than average month. If the mean for 2024 finishes above the level of 12C it will be the third 12C year in a row!
Prior to this an annual mean of 12C has been recorded on only 11 occasions since 1960: 1989, 1997, 1999, 2002, 2003, 2011, 2014, 2018, 2020, 2022, 2023 .
Samantha Burgess, deputy director of the Copernicus Climate Change Service, said: “October 2023 has seen exceptional temperature anomalies, following on from four months of global temperature records being obliterated. We can say with near certainty that 2023 will be the warmest year on record, and is currently 1.43ºC above the preindustrial average.”
On a local scale the average maximum temperature, considering the rolling 12-month average, has actually decreased 0.6ºC compared with last year at this date.
Looking at the last 10 years the past 12 months have been the 3rd warmest. With a building El Nino it could be assumed that next year will see a greater increase in anomaly here but, 2015 suggests, positive ENSO can actually lead to a decrease. As can a La Nina lead to an increase, as shown in 2022.
The climate system of the world is complicated in that it doesn’t warm uniformly which leads to problems when a sizeable part of a population look out of their windows and see weather that is cold and miserable. That social media lists the ever increasing number of weather disasters around the world doesn’t seem to make a difference.
Governments and agencies have their work cut out trying to convince enough people that we really must better look after the world, starting in our own back yards.
As Burgess adds regarding the United Nations Climate Change Conference later this month: “The sense of urgency for ambitious climate action going into COP28 has never been higher.”
It’s been a while since this region has seen a sustained colder than average period. Though the past few weeks have seen colder than normal weather we have to go back to the beginning of 2015 where at least three consecutive months were colder than the 1981-2010 average.
The spell, which coincided with winter, was unremarkable with just one day of lying snow. The season finished 55th out of 73 of the most recent winters, the anomaly for the 90-day period was -0.3C. For deep, lasting snowfall events a monthly mean temperature must be at least 2C colder than average.
For anything ‘snow-worthy’ you have to go back seven years to a 10-month long colder than average spell that began in September 2012 and coincided with probably the last winter I can remember that had more than one cold spell with snow that lasted longer than a few days. The average mean for this spell was -1.3C.
The most potent cold period occurred during the winter of 1984/85, a winter where snow lay nearly a foot deep by the end of January and where seven ice days were recorded – these days we’re lucky to record just one ice day per winter! Only just behind was the 3-month period January to March 1987.
As with previous blogs I have devised a way of ranking these cold periods, by dividing the mean with the length in months. The first nine months of 1986 achieved the highest ranking, a period that included the 5th coldest February in this area since 1797.
And in chronological order…
It is looking like the mean this November will finish below average, making it the second month in a row, something that hasn’t happened since March last year. Will December make it three in a row and a new addition to the list?
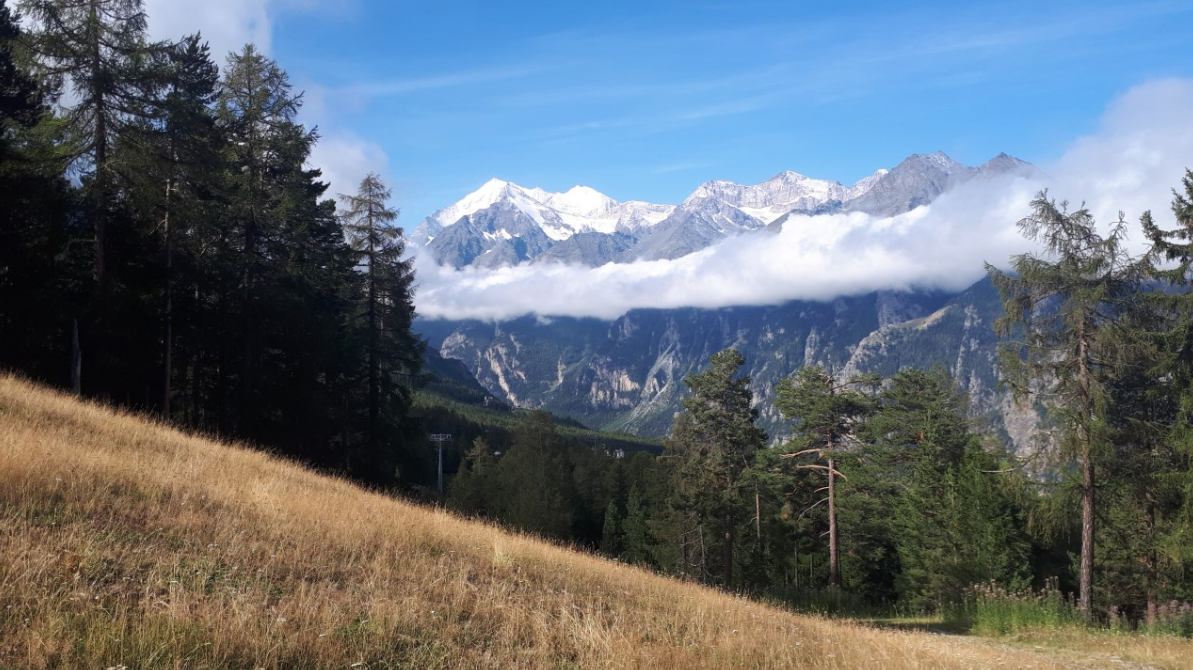
Two hundred years ago this December a huge part of the Weisshorn glacier in Switzerland crashed down several thousand feet to the valley below.
A glacier above the village of Saas Grund, Switzerland. Viewed from below I am always struck by how precarious they look.
At 6am on December 27th 1819 the villagers of Randa, near Zermatt, were awoken as millions of tonnes of snow and ice swept away boulders, rocks, gravel and mature larch trees. Though the debris missed the village the force of the slide created a blast of air that moved entire buildings and their contents, burying 12 people, all but two of whom escaped with their lives.
Eyewitnesses described the noise of the falling mass as the loudest thunder and said a bright flash accompanied the slide before darkness once again enveloped the village.
First light revealed the utter devastation of the avalanche that have covered an area of pasture 2,400ft by 1,000ft by 150ft high.
It was not the first avalanche to bring disaster to Randa. In 1636 the village was destroyed by a similar avalanche when 36 people were killed. It is said that that occasion saw a much greater chunk of the flacier fall from the slopes of the mountain, at 14,783ft the 5th highest in the Alps.
Two other less serious falls happened in 1736 and 1786 but not precisely in the same place. This time only a small part of the glacier fell down.
Could a similar disaster happen again? With climate change and the nature of the Alps being constantly on the move it is possible. Earlier this month it was reported that part of a glacier on the Mont Blanc Massif, just 40 miles away as the crow flies, was on the brink of collapse.
I don’t have local figures but a look at the recent climatology in London shows that anomalies during the past couple of years – warmer than average summers and low rainfall – have been similar to what happened in 1819.
Of course the difference between now and 1819 is that we have early warning systems in place that can help prevent loss of human life in the event of a catastrophic avalanche.
The Weisshorn in the far distance seen from the slopes above Grächen
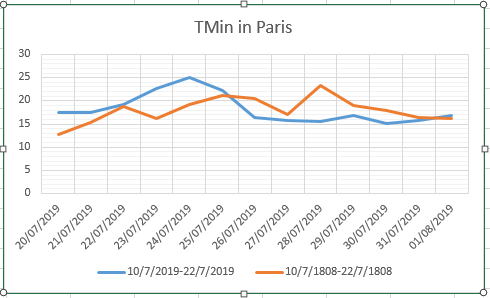
In July 1808 Paris wilted in a heatwave. The average maximum for the 13-day spell that began on the 10th was 31°C, higher than a similar spell last month that saw the all-time record for the French capital broken.
The temperature at the peak of last month’s hot spell reached 42.6°C, some 6.4°C higher than the peak of the 1808 spell but, as the graph below shows, maxima fell back more quickly than 1808.
The more ‘pointed’ nature of maximum temperature during the spell last month backs up findings of the changing jet stream; the wriggly nature amplifying the heat.
The average mean and minimum temperature of both spells showed a difference of just 0.2°C.
Since Paris recorded its hottest day ever there have been just two days where the temperature has exceeded 30°C.
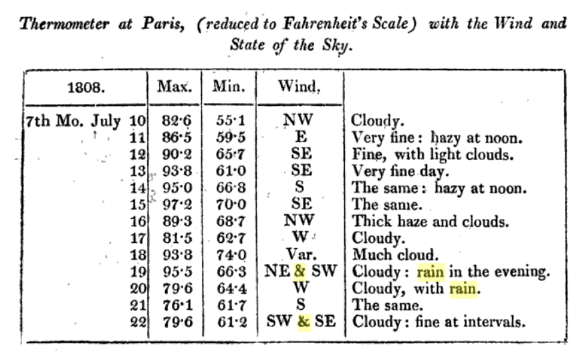
The values for the 1808 spell were listed in Luke Howard’s Climate of London.
The heat in Paris in 1808, like in 2019, was also felt in London. Luke Howard noted the following in The Climate of London.
“Very hot from July 12th to 19th. On the 12th a thermometer in perfect shade in a window in St James’s Park was 81.5 degrees at 3pm, and on the 13th at the same hour, 94 degrees. On the same day four men and seven women were killed by sunstroke in various parts of the Midland counties, and numerous coach and other horses were also killed. On the 15th a very violent and destructive thunderstorm in Gloucestershire, Monmouthshire, and surrounding counties.”
* Values for 2019 were taken from the station Montsouris.
** Though there is no way of knowing how accurate the 1808 values were previous studies have found that historic temperatures can be as much as 3°F too high.
June 2019 saw no high temperature records broken but a jump in anomaly, produced on the 29th by the 3rd hottest June day back to 1959, is higher than any I can find back to that year..
The only phenomena similar that I can find, albeit in the other direction, is the Beast from the East in March 2018 that sent temperatures plummeting.
The month finished a little above average though the final figure, like May and April, masked cool warm spells.
The mean temperature finished 16.9C that’s 0.8C above average, the coolest for 3 years.
Rainfall was 63mm, 123% of average, the wettest for 2 years. Sunshine was 158 hours, 88.7% of average, and dullest for 3 years.
Since notably cold weather struck at the end of February I’ve lost count of the number of times I’ve heard this phrase uttered by the public and some sections of the press.
Top 20 cold anomalies
The ‘Beast from the East’ (versions 1.0 and 2.0) really captured the imagination in an age where everything has to have a label slapped on it; any message that these cold spells are ‘weather’ and not ‘climate’ seems to get lost.
Both spells, indeed the general pattern of our late winter weather, were driven by the stratospheric sudden warming event that lead to a split polar vortex in February – leading to a very cold end to the month and a mean temperature anomaly of -2.5C, the greatest monthly anomaly since March 2013.
To put it into perspective, however, it was nothing like some of the anomalies that occurred in the early 19th century: January 1814, for example, saw a monthly anomaly of -8.2C and coincided with the last occasion a frost fair was held on the Thames. Januaries back then were generally very cold, the 1801-1831 average monthly mean was -3C, that’s 8C colder than the most recent 1981-2010 average!
So climate now is much warmer but that is not to say that anomalously cold months can’t happen. February 1986 saw an anomaly of -5.6C, the 13th= greatest cold anomaly in my local dataset going back to 1797.
Top 20 warm anomalies
The cold December of 2010 recorded an anomaly of -4.2C, 76th= greatest cold anomaly, while anomalies of -4.1C recorded in January 1979 and March 2013 were 77th=.
With the warming climate it is no surprise that most warm months happened very recently. The balmy month of December 2015 saw a positive anomaly of 5.4C.
The ‘Beast from the East 2.0’ was caused by a narrow tongue of extremely cold air from Russia scoring a direct hit on the UK. The odds of this happening must have been low but it is an example of how, when the synoptics of the atmosphere line up perfectly, anything is possible.
And it is an example how even in a warming climate the UK can still be subject to anomalous cold and warmth at any time of the year.
As the author Mark Twain reportedly once said: “The climate is what you expect; the weather is what you get.”
The upper air anomaly of the ‘Beast from the East 2.0’.
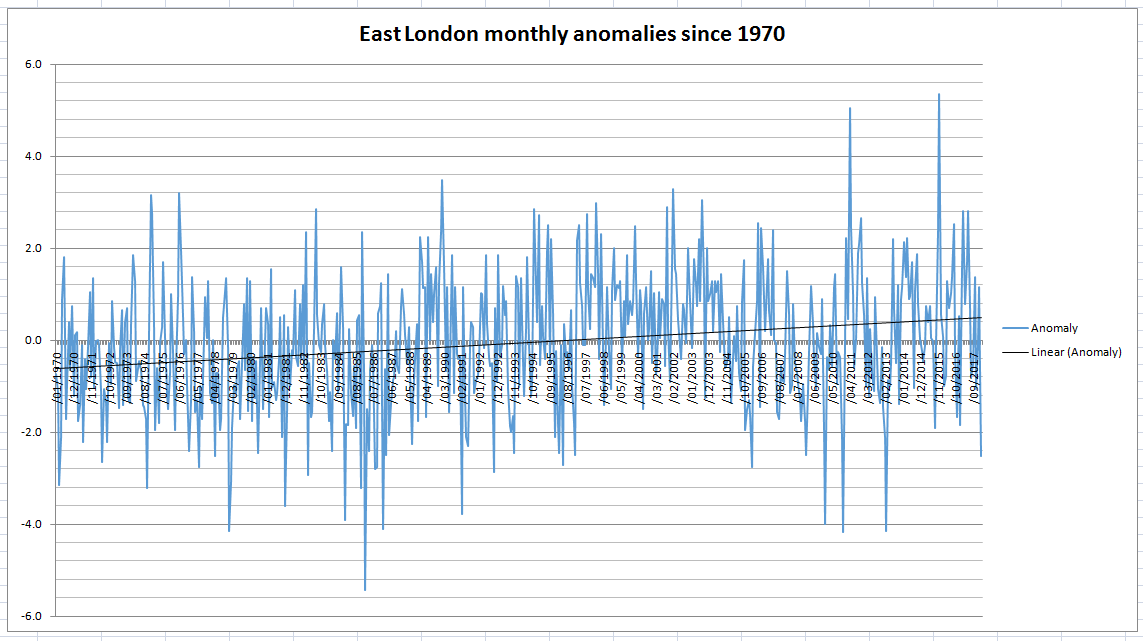
This graphic shows positive and negative monthly anomalies since 1797 against a generally warming climate
Because the above graphic is crowded I created one of anomalies since 1970. The upward trend is the same.
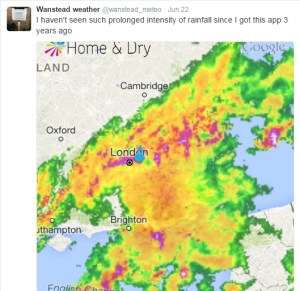
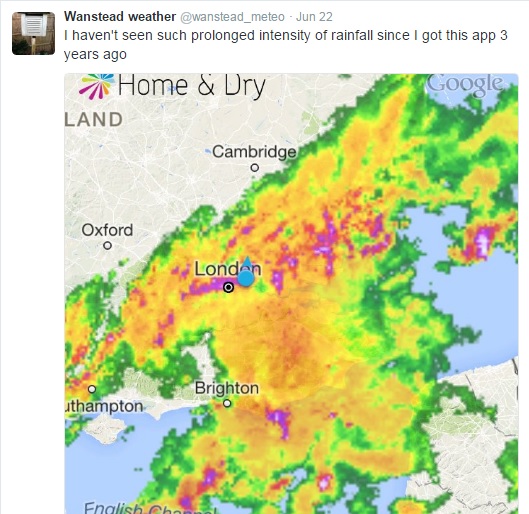
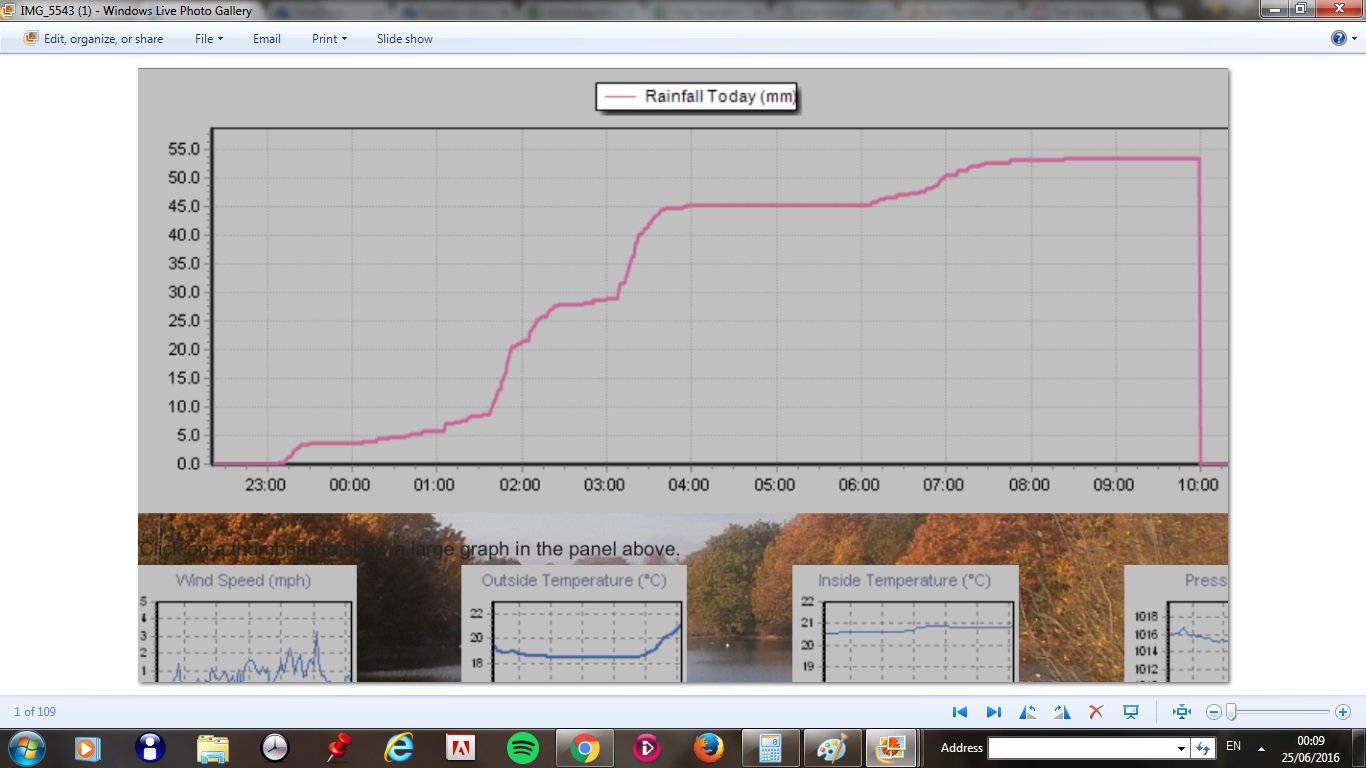
The past week has produced the highest 24-hour rainfall total recorded in Wanstead since at least 1960. The multi-cell thunderstorm on Wednesday night saw 60.8mm fall, most of it in two hours, bringing flash floods to the surrounding area. The spectacular lightning and thunder that accompanied it was almost a side show such was the intensity of the rainfall.
An image from the Home & Dry app revealed a succession of dark red echoes passing over our area. The heaviest rain seemed to run on a line from Battersea to Romford
I was unfortunate enough to be riding home right in the middle of the event: the entire length of the Mile End Road bore a resemblance to a shallow river, the heavy rainfall bouncing back off the Tarmac high enough to create what felt like a powerful drench shower.
The legacy of the downpours caused chaos in the morning and evening rush-hours. Many commuters were stranded at London terminals including Waterloo station because of flooded tracks, possibly robbing many of the chance of voting in the EU referendum. It will never be known if this would have had a bearing on the final result.
Many people think of June as a warm, summery month. The term Flaming June is regarded in most peoples’ subconscious as a reference to past weather. That it is a actually the name of a painting is often missed. Looking back through our local history there has been many notable events of thunderstorms and prolonged rainfall. In 1903 a record-breaking 59-hour deluge left vast swaths of the borough inundated.
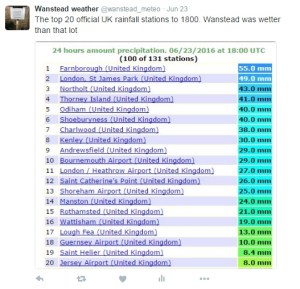
The offical UK weather station totals all recorded less than Wanstead
This weekend 200 years ago, during the Year Without a Summer, a powerful tornado, strong enough to carry away objects weighing 60lbs, tore through the Edgware Road area in west London. Luke Howard recorded the event in the Climate of London.
At two o’clock being a still sultry day a whirlwind passed over the nursery ground of Mr Henderson in the Edgware Road which lifted seven lights from the greenhouses and carried them to the height of the highest elm trees, each of the lights weighs 50 or 60lbs at least. At the same time two garden mats were carried to an immense height so that the eye could not distinguish them.
The following day “extremely heavy and prolonged rain from 9am (26th) to 9am on 27th gave 2.95 inches”. This total of over 52mm is notably high though not a record.
This weather was a continuation of what had been an awful May and June – cold with more than twice the average rainfall in June.
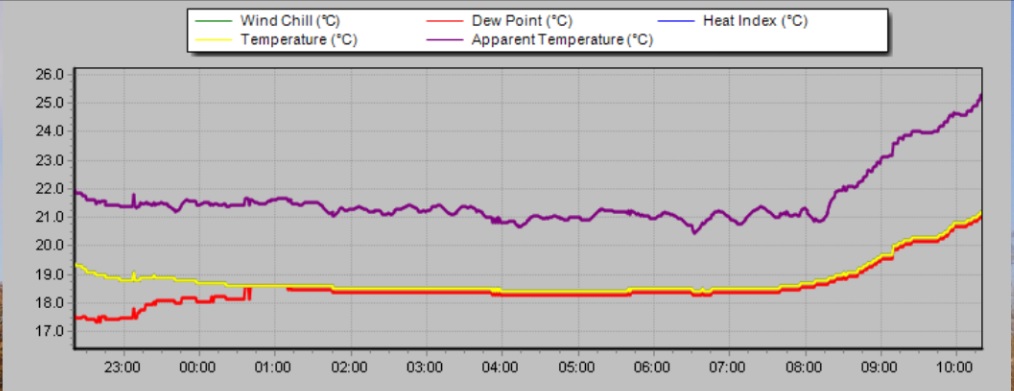
The weather then was not unlike what we have experienced this month. Indeed, a look at the weather throughout this year was similar as this graph shows.
Though the mean temperature at times bears a close resemblance this year is no comparison to 1816: The mean then was running at 6.2C, over 3 degrees colder than today.
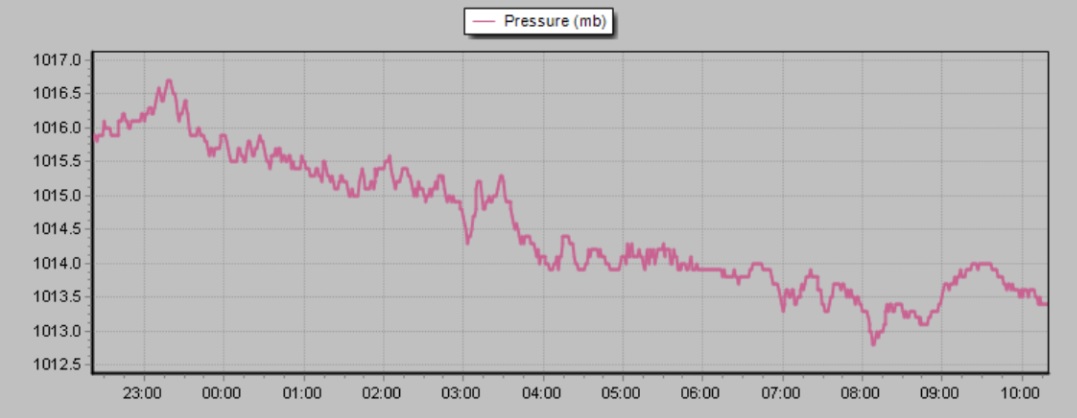
Mean pressure was also lower being 992.1mb; the 2016 mean 9am pressure is 1010.6mb.
Perhaps not surprisingly this year’s rainfall actually trumps 200 years ago; the running total for rainfall here is 390.1mm, higher than the 309.6mm recorded in 1816.
The dreary summer and frequent thunderstorms of 1816 inspired Mary Shelley to write Frankenstein. A summer vacation in Switzerland led her to spend much of the time indoors. She, along with Lord Byron and John William Polidori entertained each other with a contest to write the scariest story of all. The unseasonal conditions, along with this dare, led to the creation of Shelley’s Frankenstein: The Modern Prometheus— as well as Polidori’s novella The Vampyre and Byron’s long-form poem, The Darkness.
It will be interesting to see if this June’s weather, along with momentous political changes here and in Europe, produce more fine fiction from the this and the next generation of writers.
A new suburb the “size of Windsor” is being planned for Barking Riverside, the site of the old Barking Power station, according to a report in the Financial Times.
The Barking Riverside site is sandwiched between two sewage works and a power station
Some 10,800 homes are being planned for the 179-hectare site by the housing association London & Quadrant in association with the Greater London Authority. The report states that £70m will be invested in extending the London Overground rail line to the site. But no mention is made on how much will be invested in flood defences.
Nor does it say that the site is sandwiched between sewage works on either side of the river and a power station and the Ford Motor works to the east.
It is part of the Mayor of London’s ambition for a City in the East that also makes no mention of how much money will be invested in flood defences to make these new estates safe.
This 200,000 home masterplan for East London should be music to the ears of anyone struggling to find a place to live in our overcrowded capital.
But unless planners are willing to spend billions on new flood defences it is possible that these new homes will be particularly at risk of flooding should rainfall levels increase with climate change.
The Environment Agency’s Flood Plan map of the Thames illustrates Howard’s comment that “the Thames was so full during this time that no tide was perceptible”
Many of the developments mooted in London Mayor Boris Johnson’s plan for a City in the East are situated on flood plain, according to the Environment Agency.
On reading through the blueprint flood risk isn’t mentioned once.
A report in the Financial Times, citing the plan, says there is much more potential than previously thought to increase housebuilding in east London, the capital’s planning chief estimates. Sites earmarked include the Lea Valley and areas along the Thames beyond Canary Wharf.
‘Thames Riverside’, the term for an area along the north side of the Thames including Barking and Beckton, could host 27,000 homes, while areas on the opposite side of the river could hold 22,000, according to the report. There could be 52,000 more homes in Lea Valley, 30,000 on the Isle of Dogs and 15,000 in Woolwich.
Sir Edward Lister, deputy mayor for policy and planning, believes the capital’s authorities had learned from their experience with the Nine Elms regeneration area, where a statement of intent had galvanised developers.
“We just have to commit and then the developers can move in,” adding that there were “vast” amounts of underused post-industrial sites along the river in east London.
The housing plans also include commercial and industrial buildings, giving potential to create 280,000 jobs, as well as supporting infrastructure such as schools and hospitals. Transport improvements, such as Crossrail and a new London Overground line, would make the developments ‘desirable’. But costs would be dwarfed by any flood defence improvements.
Previously the Environment Agency has outlined a range of options for the future of the Thames Estuary flood defences. None are particularly cheap.
As a minimum, the EA estimates that the cost of maintaining the defences until 2035 will be around £1.5 billion, with an additional £1.8 billion needed to repair and upgrade the defences until 2050. Particular bits of marshland could also be set aside to store tide waters.
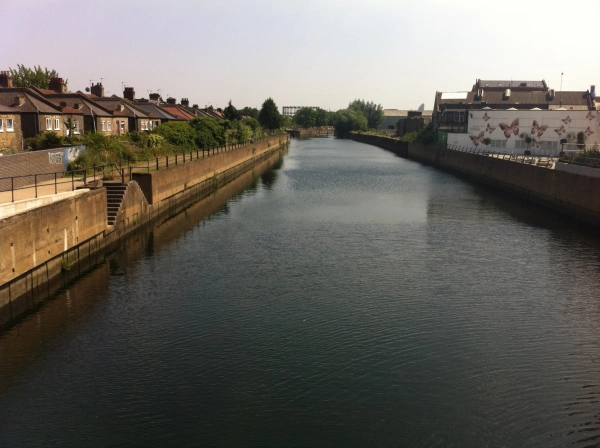
The River Lea close to where Luke Howard’s laboratory stood
More ambitiously, the government could fund a new barrier in either Tilbury in Essex or Long Reach in Kent. Such a barrier would be designed to resist the highest surge tides identified by the Met Office’s analysis of how conditions will change this century. The EA estimates a new barrier could cost as much as £7 billion, though that figure could go up if conditions change significantly as the climate changes.
The Agency also say the existing barrier could be converted to include locks, which could open and close more flexibly and extend the life of the defences. The EA report says a decision on a new barrier will have to be made by 2050.
It may turn out that there’s a more pressing reason to spend. The EA says 50 is the maximum number of times the barrier should close each year, and beyond that, the barrier could start to fail.
How high is the likelihood of flooding in this part of London? A look back through history shows the geography of the Lea Valley has made the area prone to inundations for hundreds of years.
The Environment Agency’s Flood Map for Planning shows the flood zone risk of the area. And endorses Howard’s account that the river Lea was ‘a mile wide’ at its peak
In January 1809 the lower River Lea burst its banks in several places following a deluge that dumped two inches of rain in the space of 24 hours. The rain abruptly ended a snowy cold spell that had begun over a month before in the middle of December. From Luke Howard’sreadings it is likely that up to half a metre of snow had fallen in the previous weeks in the upper parts of the surrounding countryside with only slight thawing. With the frozen ground unable to absorb any of the rapidly melting snow and rainfall the amount of water flowing downstream must have been immense. Howard takes up the story…
“The River Lea continued rising the whole of the 26th… The various channels by which it intersects this part of the country were united in one current above a mile in width which flowed with great impetuosity and did much damage.”
Howard, his chemical factory located on the banks of the river Lea close to what is now Bow flyover, wrote at length about the event, his account replacing the usual brief notes about daily weather in his book The Climate of London.
He talks of embanked pasture land being “filled to the depth of eight or nine feet” and people driven to their upper rooms relieved by boats plying under the windows.
“The Thames was so full during this time that no tide was perceptible.” It took until February 23rd for things to return to normal.
Miraculously no lives were lost in the flood and cattle “by great exertions” were saved by being kept in their stalls. Howard, saying that the flood could have been far worse, believed a neap tide, strong westerly winds urging water down the Thames and mild weather helped avert a tragedy.
Howard’s statistics of the previous months show that the second half of 1808 were wetter than average – though not especially so. And nothing like the rainfall this area recorded during the winter of 2013/14. From December 1st until February 8th 1809 Howard recorded 130mm of rain, which is about 100mm less than what was recorded during 2013/14.
This fact alone shows just how much the nature of the river has changed in the last 200-odd years thanks to spending on flood defences.
Work to improve the defences was prompted 67 years ago when similar catastrophic flooding came with the thaw that ended the severe winter of 1947, one of the coldest winters in history and an episode remarkably similar to what Howard recorded in 1809.
The Lea Valley, along with many parts of the country, saw some of its worst flooding in a generation. The river burst its banks at several points bringing misery to surrounding communities. Valleys turned into lakes in 40 counties and East Anglia’s fens were a sandbagged inland sea. More than 100,000 properties were damaged and, then as now, heroic battles were fought by the military to keep water-pumping plants and power stations dry.
A marker of that flood, together with a history of flood defences, can be found here. There is also British Pathe footage of another flood between 1910 and 1919 here .
Spillers Millennium Mill was repainted 25 years ago especially for the concert. It now provides the backdrop for the London Triathlon across from the ExCeL centre
The River Lea Flood Relief Channel, that flows between Ware, Herts, and Stratford, took almost three decades to complete. The channel incorporates existing watercourses, lakes and new channels. Since it was completed in 1976, there have been no major flood events in the Lea Valley, although there have been three occasions when the river system was full virtually to its capacity: in 1987, 1993 and 2000. Since its completion, the level of protection afforded by the structure has declined, so that in some areas it offers 2 per cent protection, and in some, only 5 per cent protection. The EA published a strategic environmental assessment in 2008, which looked at ways to maintain the flood defences in the Lea Valley.
In summing up its ambitions for a new development the Greater London Authority says it is trying to “overturn the historic perception of the east being seen as apart from London, rather than as a part of London”.
Jim Ward, a director of research at property consultancy Savills, said the challenge was “building something that makes people want to live and work there”, he said. “You need to build more than homes, you need to build a place.”
Boris’s record of late has not been good: an estuary airport to replace Heathrow has been dismissed as pie in the sky while his promise for a 24-hour Tube was made without first consulting unions that it was possible.
London’s safety from flooding is an altogether different proposition, both for old and new developments. Boris really needs to get London’s flood defences right before any brick is laid on these desperately-needed new developments.


 actually trumps 200 years ago; the running total for rainfall here is 390.1mm, higher than the 309.6mm recorded in 1816.


You must be logged in to post a comment.