London’s November extremes since 1959

I’ve put together a few top 10s of stats for Wanstead, St James’s Park and Heathrow for the month of November.

Probably most notable is how the month in 2010 lurched from being so warm at the start to so cold three weeks later, setting up December to be one of the coldest on record.

wanstead

November SJP

heathrow

Some national UK November values according to TORRO

Hottest: 21.7C Prestatyn, Clwyd – 4th 1946
Coldest: -23.3C Braemar, Grampian – 14th 1919
Wettest: 211.1mm Lluest Wen Reservoir, Rhondda – 11th 1929

November climatology

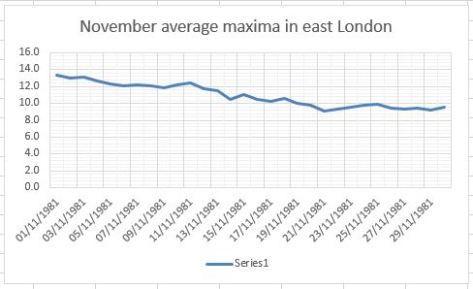
In terms of climatology November maxima, considering the 1981-2010 average, shows a steady fall until the 15th. And another steady fall to the 22nd before things level off. This would reflect the November singularities; St Martin’s Summer, between 15th and 21st, peaking on the 18th, occurs in 66 per cent of years. The Early December storms singularity can arrive this month, on the 24th, the air off the Atlantic raising the mean temperature.

november average maxima

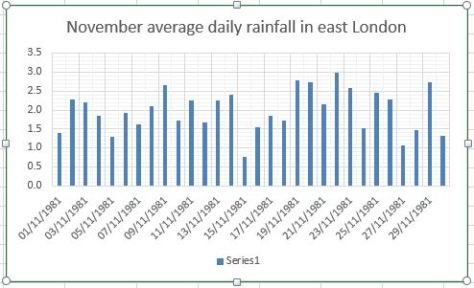
The average rainfall graphic shows that downpour amounts are variable through the month. A tendency for dry weather around the 15th reflects the St Martin’s Summer singularity.

november rain

This graphic shows the average 9am air pressure in November since 2013.

pressure


October 2017: warm, very dry and dull

October 2017 was a very dry month. Just 12.6mm of rain were recorded, the driest October since 1995 and the 11th driest since 1797.

The monthly mean finished 13.1C, 1.3C above average and the seventh warmer than average month this year.

Some 81 hours of sunshine were recorded, 76 per cent of average – the 4th duller than average month in a row. Just three months have been sunnier than normal in 2017!

Air frosts: 0, Ground frosts: 2

The first half of November looks like it will be predominantly anticyclonic. Expect lots of calm weather with the usual frost and fog.

Here follows the full weather diary for October…Full stats for the month here:http://1drv.ms/1rSfT7Y

Summary for October 2017
Temperature (°C):
Mean (1 minute)  13.2
Mean (min+max)   13.1
Mean Minimum     9.7
Mean Maximum     16.6
Minimum          0.9 day 29
Maximum          22.2 day 16
Highest Minimum  15.8 day 13
Lowest Maximum   11.3 day 30
Air frosts       0
Rainfall (mm):
Total for month  12.6
Wettest day      2.8 day 18
High rain rate   12.1 day 11
Rain days        8
Dry days         23
Wind (mph):
Highest Gust     23.5 day 02
Average Speed    3.4
Wind Run         2495.1 miles
Gale days        0
Pressure (mb):
Maximum          1034.0 day 27
Minimum          996.3 day 19
Days with snow falling         0
Days with snow lying at 0900   0
Total hours of sunshine        0.0