
Long range modelled forecasts have been all over the place of late and, looking at the underlying signals, it is easy to see why.
When I’ve produced these forecast in the past, in terms of QBO and ENSO data, there’s usually a lot of analogues to compare with. This year, however, seems to be an exception.
Considering QBO first I looked back over data to 1950 and found nothing similar for October. However, looking over the whole series the cyclical nature of this circulation may give some clue.
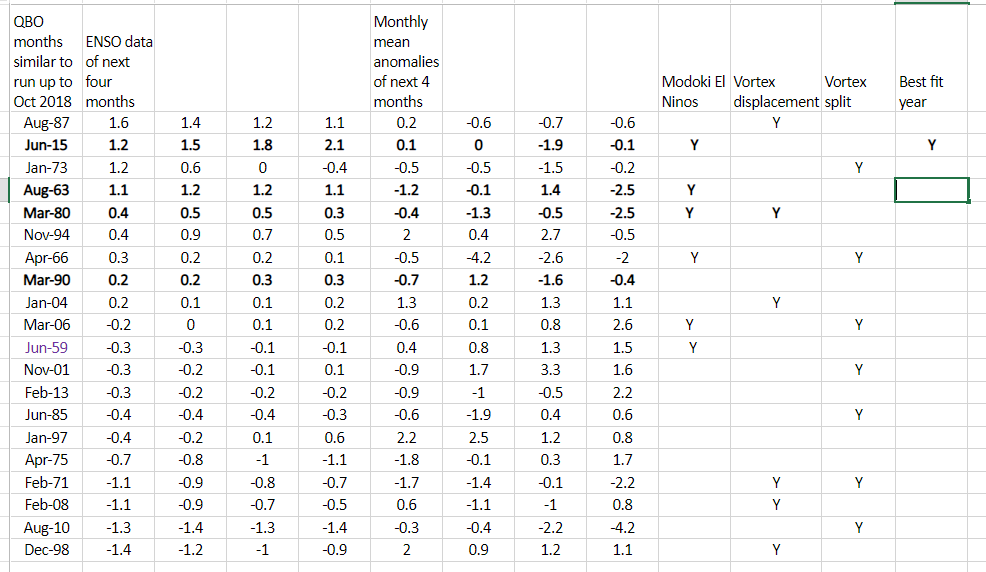
Some 20 months were revealed, ranging from June 1959 to June 2015. Using NOAA’s Niño 3.4 region I narrowed this list down to the few that had an ENSO value of around +1 with a rising trend. With NOAA’s forecast of a Modoki El Nino (one that occurs in the central Pacific) this narrowed the list to just 1 period: June 2015. Considering maxima anomalies this would give the following winter.

The above would suggest there being a general cool down through December with a cold spell starting just before Christmas into the new year? And another cold spell end of January into the first week of February?
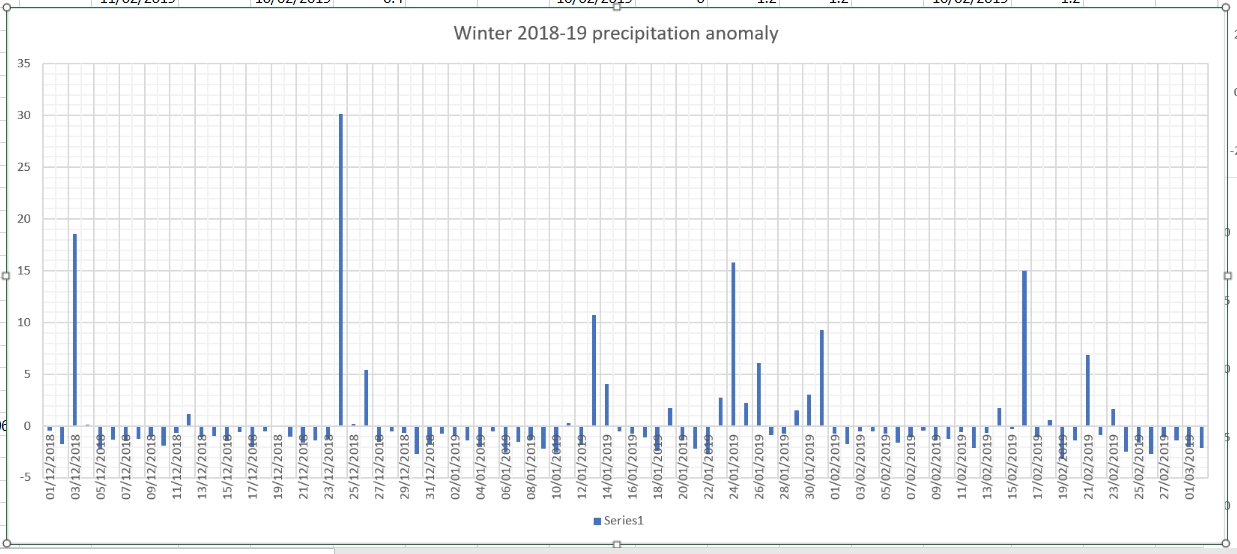
The above precipitation anomaly chart would suggest a wetter than average December, January and February, though February by much less so.
It’s been a very busy autumn so I’m keeping this short.
The below figures, particularly January and February, may be different in the event of an SSW occurring. In all then.
The mean:
December: +0.8C
January: -1.2C
February: -1.7C
Overall: -0.3C (broadly average)
Precipitation:
December: 158%
January: 155%
February: 120%
Overall: 134%

5 thoughts on “London winter forecast 2018-19”