
Britain’s capital is often the location of the UK’s hottest weather but a look back to 1911 shows it is often elsewhere the mercury is highest.
The highest temperature record has been broken three times in my lifetime. Before the first occasion in August 1990 you’d often see press articles speculating: “Will the UK ever break 100 Fahrenheit?

Though 100F was recorded at Greenwich in August 1911 the station’s use of a Glaisher stand (an instrument that depends on the observer turning it away from direct sunlight throughout the day) the record was deemed unsafe and a temperature of 36.7C at Raunds, Northants, was established as the new record.
The record stood for nearly 80 years before it was eclipsed, 37.1C being measured at Chelteham.
Thirteen years later the record was broken again, this time Brogdale, near Faversham, registering 38.5C.
Sixteen years on Cambridge became the UK’s hottest place, recording 38.7C. Just three years later the UK recorded >40C for the first time, a record of 40.3C at Coningsby, Lincs.
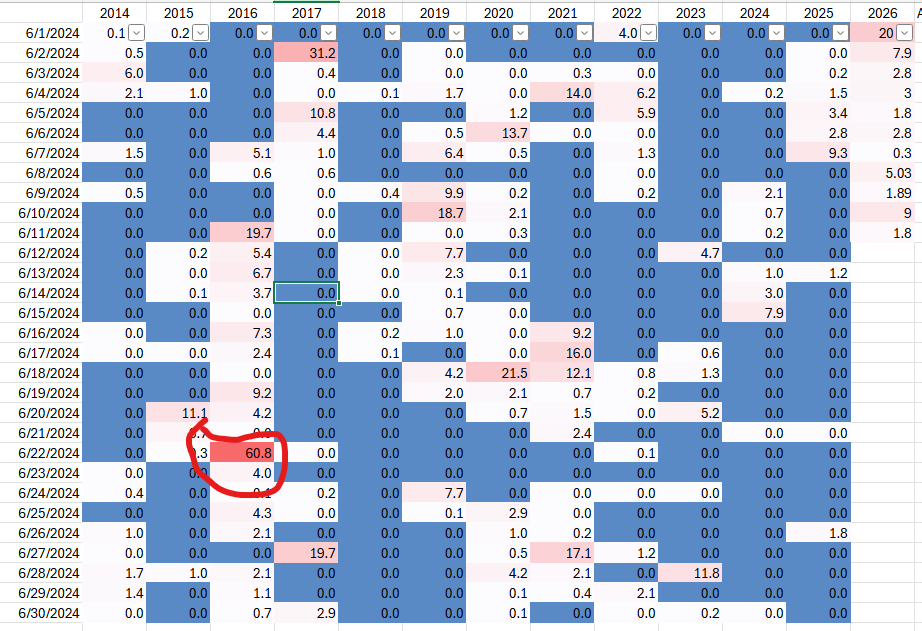
The table below shows how Wanstead and stations around London faired on each day.
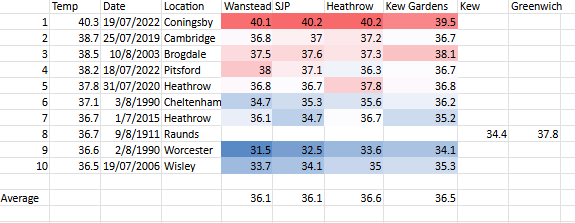
Of note is how much cooler this area is when the core of the heat is at Wisley. The 10th hottest day on July 19th 2006 saw 36.5C recorded at the RHS garden, but Wanstead was nearly 3C cooler.
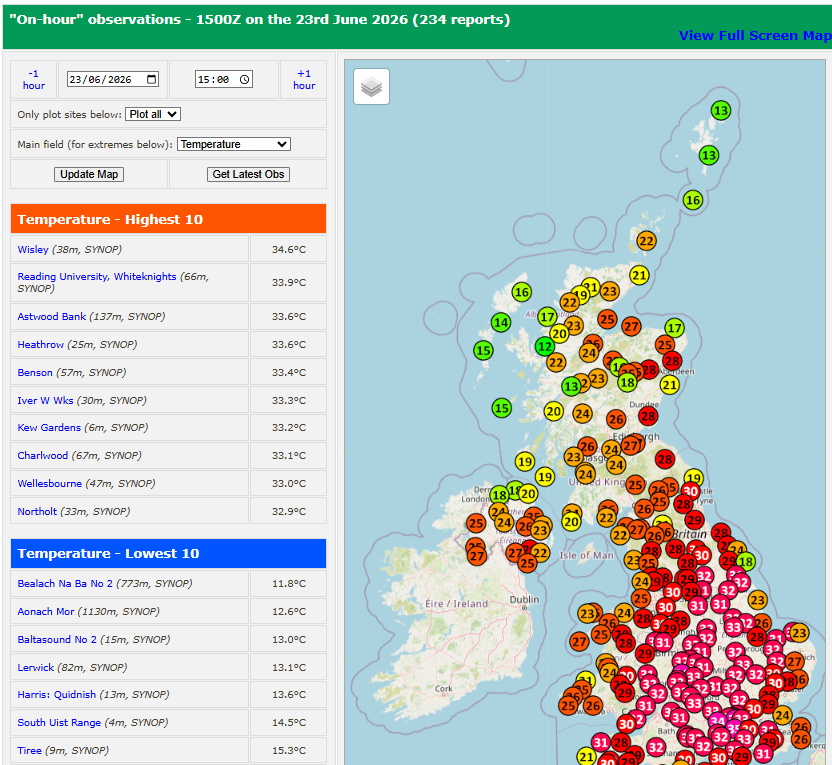
Today (23/06/2026) Wisley recorded 34.6C yet Wanstead, at 31.9C, was again nearly 3C cooler.


You must be logged in to post a comment.