The race to build more riverside property on London’s floodplain has received another boost after a big development on the Greenwich Peninsula was given the green light.
The Environment Agency’s Flood Plan map of the Thames
The Financial Times reported on Friday that Boris Johnson has given final approval to an £8.4bn, 12,700-home development that would transform this area of south-east London into a “high-rise urban village complete with film studio”.
Knight Dragon have already begun construction on the project, a 150-acre scheme approved 10 years ago in a more modest form but revived and expanded after the financial crisis.
The report mentions that local residents are concerned the scheme will place unbearable strain on the area’s transport links and that the size and density is out of keeping with Greenwich’s World Heritage Site of 17th to 19th-century buildings close by.
What is not mentioned is flood risk – a factor that, considering climate models, is deemed too minuscule to worry about. The proposed development satisfies this risk criteria – a report on the ‘Strategic Flood Risk Assessment’, drawn up in October 2011, mentions:
“Tidal flood risk is extensive, but at present Greenwich is fully defended against the 0.1% annual probability extreme tide level with climate change to 2107. A breach in the defences, although a low probability of occurrence, would have a high consequence, causing significant flooding of the Thamesmead, New Charlton and Greenwich Peninsula areas of the Borough.”
But is it wise to build on historic floodplain? Surely we should be looking elsewhere in London for safer sites for projects that will help ease the housing crisis.
The website floodlondon.com shares concern that developments such as these are at severe risk from a tidal surge when the Thames Flood Barrier nears the end of its working life in the middle of this century.
“Perched on the very tip of the Greenwich Peninsula, the O2 Arena finds itself ideally located on a nice sharp bend in the river where it is likely to take the full brunt of the surge as it careers into the bank, much like a racing car taking a corner too fast. The North Greenwich tube station just across the road will prove to be a great asset at this point as it funnels the water into the Jubilee Line.”
Before the Thames Barrier was built this part of the river has seen some catastrophic flooding.
The 1875 flood as reported in the Morning Post
In November 1875, a year that was only slightly wetter than normal, a record high tide of 8.9m was recorded at Blackwall. The figure is 1.36m (4ft 6in) higher than the greatest high tide at North Woolwich (Silvertown) this year, according to tide tables drawn up by the Port of London Authority (7.54m on March 20th).
The flood brought chaos throughout London – with this part of the river particularly badly hit. Much of the Isle of Dogs was inundated, North Woolwich Gardens were under 3ft (1m) of water while the water caused explosions at the Royal Arsenal. Elsewhere in the capital Eton College was ‘completely surrounded by water’. A correspondent for the Press Association said the damage caused on the banks of the Thames was estimated to cost £1m sterling – just over £103m at today’s prices.
The Sunderland Daily Echo & Shipping Gazette on Tuesday, November 16, 1875 reported a depth of water at East India Docks of 29ft 2in. Damage was estimated to be £1m sterling – just over £103m at today’s prices.
Since the flood of 1953 measures, including the Thames Barrier, were put in place to stop this flooding. The Environment Agency has outlined a range of options for the future of the Thames Estuary flood defences. None are particularly cheap. As a minimum, the EA estimates that the cost of maintaining the defences until 2035 will be around £1.5 billion, with an additional £1.8 billion needed to repair and upgrade the defences until 2050. Particular bits of marshland could also be set aside to store tide waters.
The EA estimates a new barrier could cost as much as £7 billion, though that figure could go up if conditions change significantly as the climate changes.
Greenwich Peninsula and another project, City in the East, which was announced last month will need proper flood protection and planning. I wonder if planners are as willing to invest in these defences as they are at making a tidy buck developing these riverside schemes. And do our politicians have the appetite to drive the legislation through?
The problem is that if the climate change does bring greater rainfall and an unprecedented sea-level rise it is the people living in these properties that will be faced with the problem of ever-increasing costs to fight off the risk of inundation.
Much of the UK media has been very persistent in the past few months in saying that large positive anomaly El Niño years herald cold winters – basing their assumption on one year: 2009/10.
Whilst that winter was very cold, among the top 10 coldest of the last 70 years in this area, another El Niñoyear, 1997/98 – the strongest in recent history – brought London its third-warmest winter in a record going back to 1797.
When I had a look at ENSO data going back to 1950 a few months ago I found it impossible to find a definitive teleconnection between El Niño and winters in north-west Europe. However, now that we are midway through November, and with a fair impression of how the monthly mean will finish, I had another look.
NOAA data shows that the most similar El Niño years to this are: 1957, 1965, 1972, 1982, 1997, 2002. Taking in to account only mean temperature shows that November values have increased.
What does this mean for this winter? It is still impossible to tell and is just another variable to consider when the time comes to predict winter.
Tornadoes, earthquakes, heavy rainfall, abnormally low temperatures, pea-souper fogs and exploding meteors are phenomena that marked the Year Without a Summer around the world 200 years ago. But how did London fair?
The monthly anomalies of the two years closely follow the same pattern between March and August
When extreme weather affects Britain, such as the floods plaguing northern England and Scotland, conditions in the capital are benign by comparison.
There is not a great deal written in the press about the weather in London in 1816. So, as ever, Luke Howard’s The Climate of London, is a primary reference point.
After a wild end to 1815 that was marked with snow and lightning 1816 started dry, cold and frosty. Though cold by today’s standards January 1816 was fairly average and much warmer than the previous two when the last Thames frost fair was held.
The highs and lows of 1816 and 2015 compared
Though the temperature reached 10C on 10th the rest of the month was marked with maxima around 6C and the odd frosty night.
Cold weather returned at the end of the month, turning severe in the second week of February. In the early hours of the 7th heavy snow, driven by gale-force north-easterly winds, brought possibly some of the worst winter weather this area has ever seen. Some 35mm of precipitation is recorded on the 8th – this would normally give at least one foot of level snow that could obviously be whipped up into huge drifts.
Luke Howard described the scene in his diary entry saying the abundance of snow “loaded the trees to their tops and weighed down the smaller shrubs to the ground.”
The snow and polar continental air also produced perfect conditions for a textbook radiative cooling night. The minimum recorded on the 10th: -20.6C has not, as far as I can tell, been repeated since.
To put that into perspective the lowest minimum of the severe winter of 1963 for this area was -12.2C recorded at Greenwich on January 21st. The coldest night I have personally recorded was -10.3C on January 12th 1987.
As often happens with severe cold snaps Howard reported on the 17th the the snow “was mostly gone but very thick ice remains on ponds”; a period of just under a week.
The cold snap saw the mean temperature for February over three degrees colder than average at 0.8C.
As well as keeping meticulous observations in Plaistow, Stratford and Tottenham, Howard always kept an eye on what was going on abroad and noted that earthquake activity was high.
On February 2nd an earthquake that ‘lasted nearly three minutes’ was felt at Lisbon. Three days later an earthquake was felt on Madeira.
“At midnight a severe shock of an earthquake was felt all over the island and the following morning at 4 o’clock another shock was felt.”
An extract of a letter from Captain Welsh of the Claudine described an event of an earthquake felt at sea on the 9th.
On the 9th of February off St Michael’s we experienced very tempestuous weather with a tremendous confused sea. The wind shifting from SW to SE and NE with constant lightning and heavy rain. On the 10th at 8.30pm, the ship then under reefed fore sail and mainstay sail, we were much alarmed by a severe shock of an earthquake which lasted four or five seconds.
The dominant wind direction in 1816 was north-west
Later in the month on 23rd it was reported that the snow in the Grampian hills was at its greatest depth for 20 years.
Howard reported a heavy short snowstorm in the capital on March 4th. He also mentions another earthquake on March 17th that affected the north of England in towns and cities including Doncaster, Bawtry, Blyth, Carlton, Worksop, Sheffield, Chesterfield, Mansfield, Nottingham, Lincoln and Gainsborough.
“A smart shock of an earthquake was perceptibly felt in Lincoln at about 12.50pm. The undulation appeared to be from west to east and lasted from about a minute and a half to two minutes.
“Pictures and other articles hanging on the walls were set in a swinging motion. At Newark also and the neighbouring villages the shock was distinctly felt as well as at Leicester and Loughborough.”
Snowy episodes in the capital lasted well into April. On 12th snow fell for two hours “turning the high ground of Hampstead in the distance white”.
Very high tides were reported on the 15th with “much water out in the marshes”. By the 19th it was noted that the growing season was being severely hampered by the cold weather
April 1816 was nearly 1.5C below average. Despite this, by the 21st, the first swallows began to appear.
May and June were again cold. More than twice the average rainfall in June suggests the weather in the sixth month was very disturbed.
On the 25th a tornado, strong enough to carry objects weighing 60lbs, was reported in the Edgware Road area.
At two o’clock being a still sultry day a whirlwind passed over the nursery ground of Mr Henderson in the Edgware Road which lifted seven lights from the greenhouses and carried them to the height of the highest elm trees, each of the lights weighs 50 or 60lbs at least. At the same time two garden mats were carried to an immense height so that the eye could not distinguish them.
The following day “extremely heavy and prolonged rain from 9am (26th) to 9am on 27th gave 2.95 inches”. This total of over 52mm is notably high though not a record.
Overseas, meanwhile, the weather continued to confound observers. Several inches of snow fell in Quebec on June 8th while a letter from a friend of Howard mentioned a reading of -38F that had been recorded in New Hampshire earlier in the season.
July and August were similarly cold and wet. While events in London had quietened down Howard noted that the Kendal Chronicle was reporting snow on the summit of Helvellyn on July 4th while notable gales in Scotland were affecting ships.
More earthquakes shook locations around the world including one on August 14th in Scotland that caused panic and considerable damage in Inverness. Howard quotes a letter from north of the border:
“Last night, exactly a quarter before 11 o’clock the town of Inverness and the surrounding country was fearfully shook by an earthquake. We fled to the street where we found almost every inhabitant; women and children screaming and a very considerable portion of them naked. Many fled to the fields and there remained for the greater part of the night. Chimney tops were thrown down or damaged in every quarter of the town. The Mason Lodge occupied as an hotel was rent from top to bottom, the north sulk of the chimney partly thrown down one of the coping stones weighing, I should think, from 50lb to 60lb, was thrown to the other side of the street a distance not less than 60 feet.”
Elsehwhere in Europe the dreary summer and frequent thunderstorms inspired Mary Shelley to write Frankenstein. A summer vacation in Switzerland led her to spend much of the time indoors. She, along with Lord Byron and John William Polidori entertained each other with a contest to write the scariest story of all. The unseasonal conditions, along with this dare, led to the creation of Shelley’s Frankenstein: The Modern Prometheus— as well as Polidori’s novella The Vampyre and Byron’s long-form poem, The Darkness.
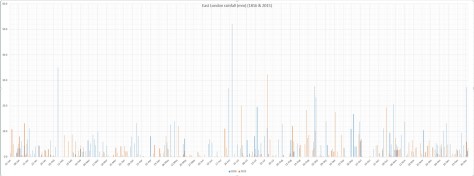
Though it is known as the Year without a Summer 1816 was actually only the 8th coolest summer in the local series going back to 1797. There were also 21 wetter summers – the 250mm that fell was actually less than half the rainfall of summer 1960.
1816 & 2015 compared: monthly rainfall anomalies
A change of month in September failed to bring a change in the weather and the mean temperature continued 2C below the average for the period. Howard mentions a 9-week tour of Europe at this time – his laboratory and climate reading duties left in the hands of his friend and partner, John Gibson.
Howard’s account of his tour explains how excessive summer rains had made life difficult from Amsterdam to Geneva.
“From the sources of the Rhine among the Alps to its embouchure in the German ocean and through a space twice or thrice as broad from east to west the whole season presented a series of storms and inundations. Not meadows and villages alone but portions of cities and large towns lay long underwater; dikes were broken, bridges blown up, the crops spoiled or carried off by torrents and the vintage ruined by the want of sun to bring out and ripen the fruit.
“While the middle of Europe was thus suffering from wet, the north for a time and to a certain extent was parched with drought and public prayers appear to have been ordered about the same time at Riga for rain and at Paris for sunshine.”
On September 16th Howard noted that a ‘dreadful’ hurricane had affected the Caribbean island of Guadalope. “Houses were levelled, plantations destroyed and the soil driven about like dust in a whirlwind.”
October 1816 was a blip during 1816 in that the mean temperature and rainfall were about average though Howard’s records reveal there were four air frosts.
By November the weather began mild but by the 6th the cold had returned with a brief snowy snap. A report from Chester said that day was almost night because of the thickness of the cloud:
“Candles or lamps were obliged to be lighted in all the houses this was succeeded by a slight shower. On Thursday successive falls of hail and rain took place. On Friday the frost was uncommonly severe and on Sunday the snow which fell was above 2ft deep in the streets.”
On the 14th reports came from France that a tempest on the night of the 11th and 12th had wrecked many ships: “winds blowing from the north then SSE”.
Chesterton House, off Balaam Street, Plaistow, was the home of Luke Howard from 1806-13. The building has since been demolished
A solar eclipse on the 18th was followed by a sustained build in pressure from the 22nd with fog now becoming a problem in the capital.
The Evening Mail on November 27th reported that the problem was particularly acute in South London.
“The atmosphere was so darkened yesterday morning in the vicinity of the metropolis by the thick fog combined with smoke that in some parts it appeared like a cloudy night. In the neighbourhood of Walworth and Camberwell it was so completely dark that some of the coachmen driving stages were obliged to get down and lead their horses with a lantern.”
After the average October November had reverted to type and the month in London finished just over 3C cooler than average.
Pressure began to fall with the arrival of December. On the 12th reports of a meteor were made from Glasgow and Perth. The phenomena sounded spectacular:
“The meteor made its appearance in the SW in the form of a small star and gradually increased in magnitude till it reached the zenith when it subtended an angle nearly equal to that of the full moon. In shape it resembled a paper kite. After passing the zenith it again seemed to diminish in size owing no doubt to its gradually receding from the observer till its altitude was equal to about 30 miles when it exploded like a sky rocket. The report of the explosion, which is described as more tremendous than the noise of the loudest thunder, reached the ear about three minutes after the meteor vanished so that it could not be less than 40 miles distant and probably about 27 miles above the surface of the earth. From the various particulars collected its diameter must have been about 240 yards. The light which it yielded was very considerable being sufficient to render the smallest objects visible.”
Two days later the air pressure fell to its lowest point that year: 966.1mb. In the early hours of the 15th Howard wrote of an earth tremor that lasted 15 seconds.
A brief cold snap arrived on the 19th with the temperature falling to -10C on 21st – by the 26th, however, the temperature reached 10C.
Though December was relatively milder than November the month still finished 1.5C below average with 1.5 times average rain.
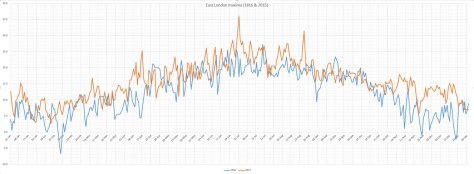
1816 & 2015 compared: East London maxima1816 & 2015 compared: East london minimaEnter 1816 & 2015 compared: East London rainfall
The climate of London can vary greatly to figures revealed in the Central England Temperature series. Because this dataset covers an area of the UK enclosed by Lancashire, London and Bristol the resulting monthly mean temperature can often be quite a bit lower than what is experienced in the capital.
Though these anomalies are smoothed in the monthly series that stretches back to 1659 notable daily extremes that happen nationwide tend to get lost. One example was earlier this month when the UK’s November maximum temperature record was broken. Trawsgoed in Wales reached 22.4C on the afternoon of the 1st whereas a largely foggy east London recorded just 11.5C.
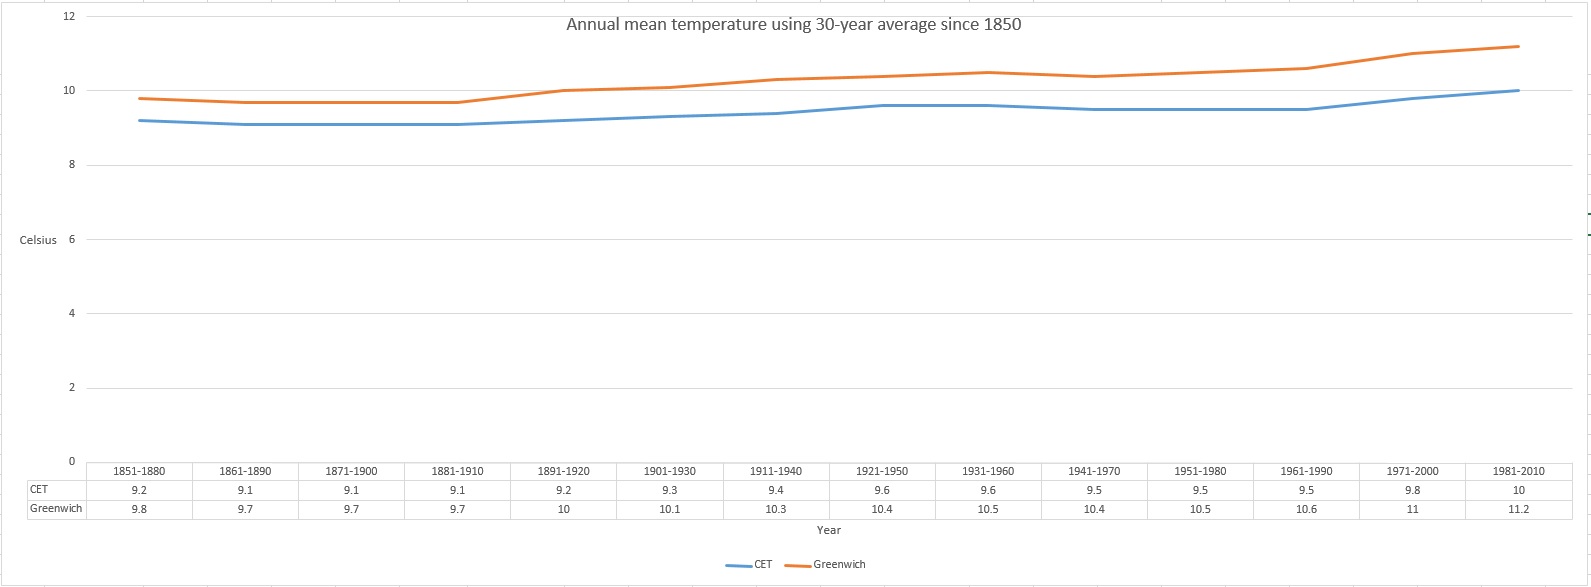
Comparing CET with data from Greenwich back to 1850 reveals a gradual decoupling between the two series, the warmth of London’s urban heat island effect an ever-growing influence.
The 1851-1880 30-year average means show that Greenwich was 0.6C warmer than the CET series. By 1981-2010 this gap had widened to 1.2C – indeed the London series is today 1.4C warmer than it was in 1851-80 whereas CET has warmed by only 0.6C.
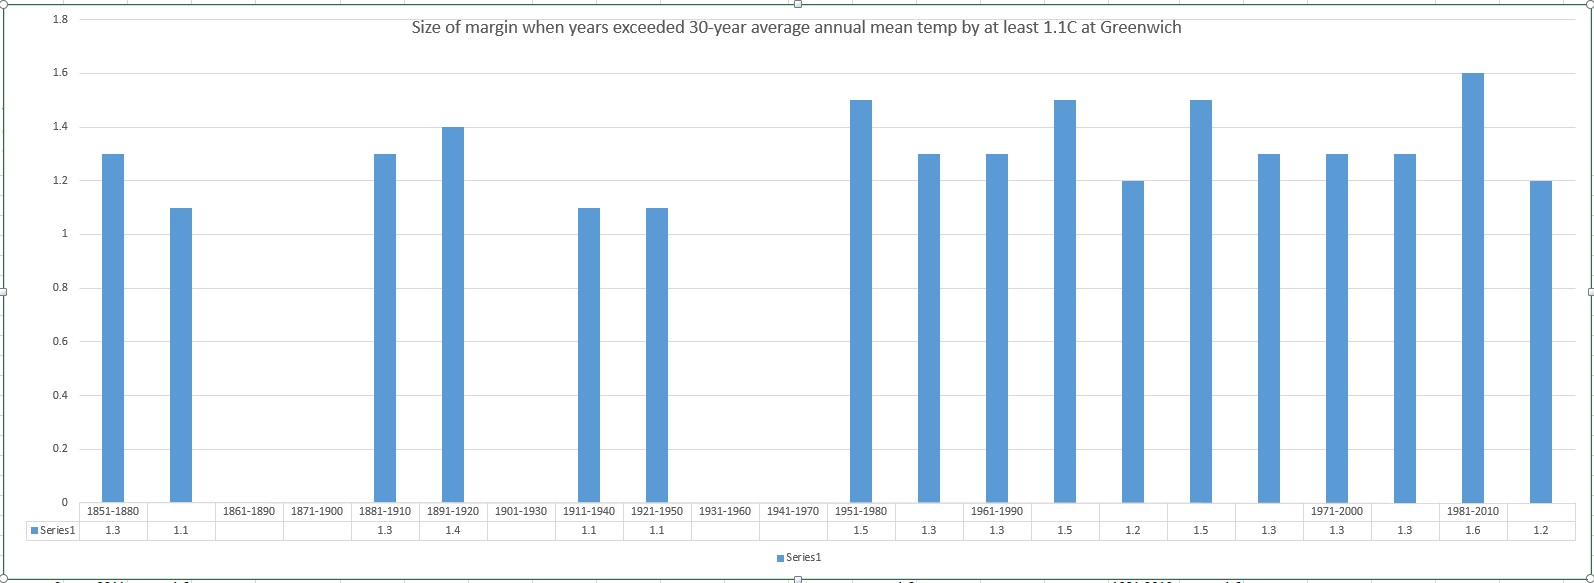
Delving further into the data reveals an increase in the number of times that the 30-year average mean is being breached by at least 1.1C. The period 1961-90 was the warmest in both cases with the mean being breached by 1.1C or more on four occasions in the case of CET and five in London. It is interesting to note, however, that the largest anomaly in the CET series is 1.3C in 1921, greater, albeit by only 0.1C, than the warm years of 1990 and 1999.
The largest anomaly in London, 1.6C, was set in 2011, 0.1C higher than 1999, 1997 and 1989.
The graph below shows the number of occasions that the 30-year average has been exceeded in each period by 1.1C or more. With 1961-90 being so warm it appears that CET warming has slowed though it should be borne in mind that we have another five years before the 1991-20 series can be released.
With reference to the London graph below showing the number of occasions that the 30-year average has been exceeded in each period by 1.1C or more merely confirms that the level of the anomalies have increased but, as already mentioned, there are probably far more outside influences affecting the outcome such as UHI, population growth, further industrialisation etc.
The accelerated warming is a worry in terms of how London would adapt should summer temperatures greatly increase, though, of course, it remains to be seen if the anomalies will advance even further from current levels.
Global temperatures are on the rise though our part of the globe may not be as adversely affected as elsewhere.* The CET dataset is the longest instrumental record of temperature in the world. The mean, minimum and maximum datasets are updated monthly, with data for a month usually available by the 3rd of the next month. A provisional CET value for the current month is calculated on a daily basis. The mean daily data series begins in 1772 and the mean monthly data in 1659. Mean maximum and minimum daily and monthly data are also available, beginning in 1878.
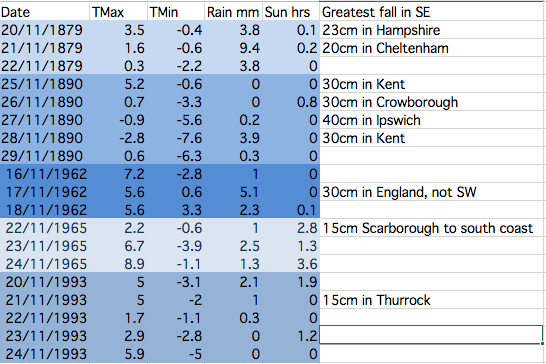
This table shows the stats for Greenwich during spells when there has been heavy snowfall somewhere in the south-east. The figures reveal that it is very hit and miss and that the associated air doesn’t stay cold for long. There is a link to UK-wide November snowfalls here: http://1drv.ms/1PjOB9H
November has produced some potent snowfalls in Scotland and northern England over the past 150 years. These brief shots of cold air, often direct from the North Pole, however very rarely produce anything that can sustain long-lasting low-level snow in London and the Home Counties.
With the GFS weather model occasionally hinting at a blast of polar maritime air I decided to have a look back through the records to see how frequently the capital has turned white during the eleventh month.
Anyone who is familiar with the Objective Lamb Weather Type (LWT) data series will know that there may be an increased likelihood of things turning colder at some point this month. Last month was the joint 5th most anticyclonic October in the LWT series data series that runs from 1871; resulting stats closely resemble both October 1946 and 1962 as being very anticyclonic. Another similar year is 1972.
November 1972 was mild till mid month and then turned much colder with snow in places. November 1962 was cyclonic till the 24th, and then anticyclonic, with a cold northerly outbreak from the 18th for a few days with snow, before turning rather mild. November 1946 in complete contrast to both years, was a mild, dull and very wet month.
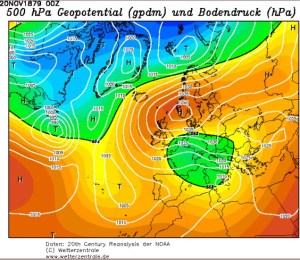
The most impressive November snowy spells seem to have occurred in the late 1800s. These two 500mb reanalysis charts show a cold feed from Scandinavia in both cases.
Snow and sleet falling in the London area is obviously much more common than snow lying. The snowiest Novembers were in 1919 and 1952 when snow or sleet fell for 10 days at Wallington and Hampstead respectively.
Kew saw snow or sleet on 8 days in 1919, while Heathrow and Northolt recorded snow or sleet on eight days in 1952.
This small article appeared on the front page of Reynold’s Newspaper in November 1890
The only decent snowfall that occured in London in my lifetime was November 1993 – and I was abroad for that. I remember my dad mentioning it in a letter written to me as I travelled round China. It arrived in the early hours of one Sunday morning and fell to a depth of five inches.
Given that was the last time London saw a decent fall I won’t be holding my breath that we’ll see any this month – though, if you live in Scotland, the odds are much narrower.
Before 1861 information on snowfalls becomes scarce – at least in terms of correct quantity. However, heavy snowfalls obviously did occur. On November 17, 1816, the Inverness Journal contained this report:
“The winter has commenced with a severity almost beyond example. Frost, rain and snow have been almost incessant during the last week and the greater proportion of corn still uncut or in stocks has suffered material injury.
“We regret to say that several lives have been lost. A postboy of Bennet’s coming from the south was obliged to leave his chaise on the road and would have been lost but for the lights shown from the windows of Moyhall which he reached nearly in a frozen state. The obvious advantage of keeping lights in stormy nights in the windows of houses in the country has thus been illustrated
“The winter it appears has set in with extreme severity in the interior of the continent. At Augsburg on the 19th of November the eclipse of the sun was entirely obscured by a fall of snow which commenced at 7 o’clock in the morning and lasted till noon. The ground was covered with snow a foot in depth. There was a great fall of snow at Frankfurt on the same day and Reaumur’s thermometer showed at from 9 to 10 degrees below the freezing point.”
Perhaps the most impressive, modern day snowfall in the south of the UK occurred around November 18th 1972 when observers recorded 60cm of snow on Dartmoor. Synoptic charts and other data are attached below.
Image courtesy of the Met Office
Image courtesy of the Met Office
Image courtesy of the Met Office
Image courtesy of the Met Office
Inspiration for this piece came from Dr Richard Wild’s PhD study on snowfall which you can find here.
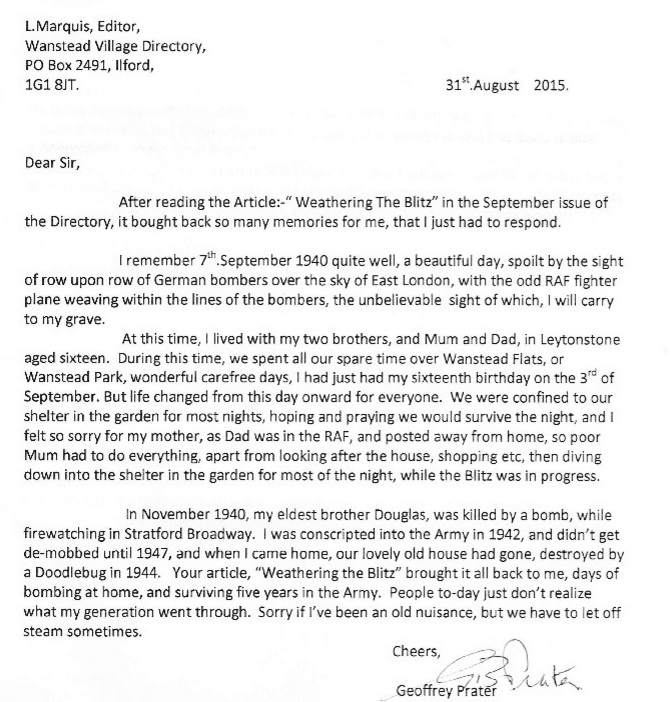
Geoffrey Prater served in the 51st Royal Tank Regiment during his five years’ national service and saw action during World War II in Italy and North Africa.
I met the 91-year-old Wanstead resident earlier this year after my article on the Blitz prompted him to write to the editor explaining what life was like during the war 75 years ago.
Over a cuppa we spoke at length of how he and his family coped with the Blitz. Carefree days spent playing over Wanstead Park and Wanstead Flats were brought to an end in September 1940 as the Luftwaffe’s bombs started to rain down. In November 1940 Geoff lost his elder brother, Doug, during an air raid in Stratford.
He was called up for national service in September 1942 and, after a year of training at Brentwood, Farnborough and Barnard Castle, his regiment set sail from Liverpool docks in December 1943. Five days on mountainous seas, through the Bay of Biscay, ended with arrival in north Africa on Christmas Day from where he was posted to Italy to fight the Axis.
On returning from Italy Geoff had to come to terms with the fact that his family home in Devonshire Road, Leytonstone, had been destroyed by a V1 doodlebug bomb. His mum and younger brother, Dunc, who only narrowly escaped the bomb, had to move to a flat above a shop in Chobham Road, Stratford.
Geoff has written an account of his experiences during World War II. It’s an absolutely fascinating read and is available both in paperback and download here.
I feel privileged to have met Geoff. We owe so much to his generation’s fortitude and courage in the face of adversity.
In his own words, from the introduction of his book:
“Most people of my generation are proud to have been part of those momentous days, whether in the Services, or at home. They all suffered the grim hardships that existed at that time, with determination to see it through, whatever the cost. So, next time you see some old boy, walking down the road wearing his medals, usually at November time, don’t say, ‘Look at that silly old fart’. Just respect his pride in wearing them, after all he might be one of those ‘old boys’ who saved your way of life.”
Between 2mm and 3mm is estimated to fall between 6pm and 9pm . Fog cancelled fireworks organised for Wanstead Flats on Sunday
Bonfire Night celebrations are looking a bit damp tonight with rain spreading in just at the time many will be looking to light the fuses of fireworks as darkness falls.
According to the Euro4 model revellers can expect light but steady rain between 6pm and 9pm – annoying given that Sunday night’s festivities on Wanstead Flats were cancelled thanks to thick fog forming during the late afternoon as the sun began to set.
Wanstead Flats has put on some spectacular Guy Fawkes’ nights over the years. I didn’t realise quite how many years until I stumbled upon this old British Pathe clip which shows nurses at Wanstead Children’s Home building a huge bonfire for the children in 1934.
The footage shows the nurses struggling to get the Guy atop the bonfire, using numerous ladders, while the children, including 12 sat in an old perambulator, look on. The stats for the day reveal that the temperature fell to a chilly 2.7C after a day high of 7.9C. There was also some drizzly rain, though less than 1mm.
The Aldersbrooke Childrens Home for Waifs & Strays is still there in Brading Crescent on the Aldersbrook Estate, although the five lodges have been converted to flats.
In 1907, the West Ham Guardians purchased the Aldersbrook site. In 1911, five receiving homes were completed. The homes were called lodges and were: Elizabeth Fry Joseph Lister, Tom Hood, Edward North Buxton and William MorrisA bit of history…
In 1913, a workshop, for training of the older boys and girls was opened. Skills learnt were in tailoring, carpentry, laundry work and needlework, under skilled industrial trainers.
In 1930, on the 1st April, the ownership of Aldersbrook homes and the leases of the Scattered Homes, were under the 1929 Local Government Act, and by agreement with the Essex County Council and the West Ham Corporation, vested in the East Ham Corporation who are required to continue to receive destitute children from the Essex County Council and West Ham, formally comprised in the West Ham Union area.
On 27th May 1933, the Aldersbrook Children’s Homes new nursery was opened. The County Borough of East Ham owned it. Alderman T.W.Burden, Chairman of the Public Assistance Committee, opened it. The Mayor of East Ham, Alderman G.H.Manser J.P, proposed a vote of thanks, which was seconded by Alderman C.W.Brading J.P, and supported by Alderman Mrs Taylor (East Ham) and Councillor G.Doherty, of West Ham. After the official opening, the older children (14 to 16 years old) of the homes put on the play “David Garrick”.
The superintendent of the home was W.T.P. Steele, and the matron was E.M.Steele. S.R.N. The building was described as being divided into three sections – ground floor, babies under twelve months and toddlers one to three years, first floor staff. Accommodation is given for ninety infants under three years. Wards are provided for these age groups were newly admitted children will be housed for three weeks before being sent to the general rooms. Two ranges of isolation rooms are also provided where “suspects” can be nursed to reduce the risk of infection. The south end of the building is allotted to the youngest or cot babies and comprising of long dormitory with sun rooms at the end, designed to catch the winter sun.
The former Aldersbrook Children’s Home is still there in Brading Crescent but has been converted to flats
The programme went on to describe the building as being the most modern of children’s institutions. The building has a veranda at the front. The first floor has 21 separate staff bedrooms. The building had an oil fired heating system and flooring with fire resistant Terazzo material whilst the children’s play room and dormitories are protected by rubber flooring. The lighting and power points are controlled by locking device to prevent the children switching them on and off. The building was built by Messrs Hammond & Barr Ltd Chelsea.
The Nursery is now gone and the Aldersbrook estate covers the area, although the recreation Hall, the lodges (See photo) and the porters lodge are still there.
The incident of frosts during the season from October to May. There has been a general uptick overall since 1999/2000
1934 and this year, together with the last couple of years, is a far cry from my memory of Bonfire Night being a frosty affair – despite the fact that frosty nights during the season from October to April have been showing an uptick since 1999/2000.
The synoptic chart on November 5th 1934 portrays an unsettled regime
The synoptic chart from 7am on November 3rd 1940 showed a deep depression crossing the country that brought over 40mm of rain to Greenwich Image: Courtesy of Met Office
November 1940 was the wettest on record for this area. Over 170mm of rain fell in Greenwich, beating the previous record set over a hundred years before in 1836.
Other areas of London were even wetter: Croydon was wettest with just under 196mm while Addington recorded just under 194mm, Bromley 179mm and Regent’s Park 175mm.
Nearly a quarter of the month’s rainfall fell on the 3rd. The total of 40.8mm is a daily November record that remains to this day. Indeed, throughout the month, there were falls of more than one inch (25.4mm) somewhere in the London area on four days: 40.8mm (3rd, Greenwich), 26.7mm (4th, East Ham), 26.4mm (11th, Camden Square), 27.4mm (13th, Southgate).
In Wanstead and Woodford the inclement weather coincided with a 6-day pause in bombing incidents during the Blitz. November was a very cyclonic month that probably hampered German air operations.
Another 6-day pause in the bombing happened after November 16th. When the Luftwaffe returned on Saturday, November 23rd, it was Wanstead that bore the brunt. At 4.12pm, as light was fading on a dull, dreary afternoon, high explosive bombs caused fires at and partly demolished nos 78 and 89 New Wanstead. A minute later another bomb ruptured water and gas mains in Spratt Hall Road. At 4.30pm a further high explosive bomb fell in the High Street, killing 4 people. The raid ended at 5.16pm as a bomb fell in Fitzgerald Road though this time there were no injuries.
By now the weather was beginning to quieten down though weeks of deep depressions with associated gales and heavy rain had taken their toll – many residents reported problems of Anderson bomb shelters being constantly flooded – but it was probably the design as much as the weather that was to blame.
As pressure built in the last few days of November the first frosts of winter arrived but the bombs returned. High explosive devices fell in Woodford New Road and Bunces Lane on the 30th, fracturing a water main.
To put November 1940 into some sort of perspective the average fall for the month in this area, with regard to the 1981-2010 average, is 59mm. The closest this area has come to matching the record was 2009 when 150mm was recorded and preceded a cold winter.
The following synoptic charts are for each day of November at 7am. All courtesy of the Met Office
This October was the coolest since 2012 though the mean of 11.7C is just 0.1C below average – nearly 2C colder than the same month last year.
The last week of the month saw the leaves turning in earnest. The horse chestnuts, such as this one in Wanstead Park however, turned much earlier because of the leaf miner pest
A persistent anticylone around mid-month pumped quite cool air from the north-east for a time, prompting some cold nights. Though we have yet to experience an air frost this autumn the ground temperature fell below freezing on five nights – that’s five occasions more than last year: -2C was recorded during the early hours of the 8th.
The month was rather dry: some 46.8mm of rain fell which is 70% of what we can expect in an average October. The wettest day was the 27th when 19.4mm fell. The heavy rain in the early hours of the 28th was quickly replaced by sunshine and a stunning day followed.
Just over 91 hours of sunshine were recorded – that’s 86% of what we can normally expect in an average October.
What has November got in store weatherwise? The models today (November 1st) suggest this week will see a gradual decline in conditions overall as the ridge from Europe weakens and weak Low pressure edges up from the south and SW. Thereafter it looks like winds will settle SW’ly as high pressure relocates to the south of the UK, bringing this area mild temperatures and mostly dry and bright conditions – though a little rain will be possible at times. Overall the models continue to have little appetite to serve us up anything remotely cold and stormy.
My long range outlook method suggests that November will be average to rather mild temperature-wise, a mean of about 8.9C, at 56% probability. The next highest probabilities are for rather cold or cold, at 18% probability. The chance of a very mild month comes out at just 6% probability.
The highest probability for rainfall is 69% for something average to rather dry, between 37mm and 59mm. A wet November comes in at 20% probability.
My data for sunshine only stretches back to 1878. The signal is for something average, at 60% probability.
Looking beyond November it is notable that October 2015 was very similar to October 1997 – the year another strong El Nino occurred. A very mild winter unfolded from 1997-98, though I’m sceptical about how much influence ENSO has on our part of the world.
With the sun lower in the sky at this time of year there’s often a great opportunity for a decent sunset
My October outlook for temperature was good in that I estimated that there was a 44% chance of the mean being average. My rain estimation was way out in that a signal for a rather dry October was only a 22% probability – though bearing in mind that the probability for a wet October was only 33% it is not surprising the outcome was wrong.
Here follows the full weather diary for October…Full stats for the month here:http://1drv.ms/1rSfT7Y
1st Sunny with just a few wispy clouds. Heavy overnight dew.
2nd Sunny and clear all day and evening. Mist thickened overnight with fog elsewhere in the UK.
3rd Misty start and cloudy till midday. Evenutally cleared to leave sunny spells. Cooler than yesterday.
4th Sunny start but with a few cumulus developing during the day. Clouding over during the night with few drops of rain from high-level feature before obs time.
5th Cloudy start with rain spreading in after midday, this being steady on and off into evening before turning to drizzle late evening and lasting into early hours. Another outbreak of rain at 9.30am to obs time.
There were five ground frosts during the month of October
6th Rain to start, some of it heavy. Drying up a bit at 11.30am. More rain in the evening and overnight into the early hours. Rain again at 9.20 until obs time.
7th Cloudy start but with rain moving in again. This rain dried up a bit at 11am but then more rain at 2.30pm before petering out and clearing overnight to leave it cold.
8th Sunny, clear start with just a few cirrus. More cloud at noon and through the day. Cleared at dusk to give a cold night and heavy dew.
9th Sunny start but cloud bubbled up from noon to give cloudier periods.
10th Bright start though stayed mostly cloudy and cool. Milder overnight than of late.
11th Sunny start with a bit more of a breeze. Some alto-cumulus late on made for a stunning sunset. Cloud overnight held up temperature.
12th Cloudy start, some brightness at 11am.
13th Cloudy, cold start with cloud off North Sea making it feel colder. Cloud was very thick at 3pm with drops of drizzle.
14th Clearer periods overnight saw temperature fall sharply but too much wind for frost.
15th Sunny with just a few cumulus – very cold wind though. Cloud thick enough at times for brief showers through day. Quite overcast at night
16th Cloudy start though with some brightness. Strong easterly breeze.
17th Cloudy though warmer than past week. Felt a bit muggy.
18th Cloudy and breezy start, cloud persisting through the day.
19th Bright start and was more glimpses of sunshine than past few days. However, cloud returned with a vengeance last afternoon – felt like it was getting dark at 5pm.
20th Cloudy all day. Clearer overnight.
21st Cloudy start. This turn to long sunny spells and a pleasant afternoon.
22nd Rain to start which fell until 2.30pm. Then outbreaks of rain into the afternoon. Cloudy and damp overnight.
23rd Bright start though mostly cloudy through the day.
24th Cloudy all day. Feeling colder.
25th Cloudy start with light rain around 10.40am then intermittent. Very heavy burst of rain after dark before the skies cleared to leave a cold night.
26th Bright start with cloud breaking to long sunny spells – pleasant in the sun. Temp fell away quickly at dusk. Precip was dew accumulation.
27th Sunny start. Some cloud developed through the day but then largely melted away to leave a warm late afternoon.
28th Cloudy start. This broke to sunny spells into the afternoon in Rye. Light rain seen in Rye at 8pm – this turned heavier into the evening but most fell at dawn.
29th Bright start but quickly clouding over with rain in the evening and overnight.
30th Light rain and drizzle to start then cloudy all day and overnight.
31st Bright start, the cloud gradually clearing to leave a warm afternoon.


You must be logged in to post a comment.