November: an Indian summer before turning cold?

With the mean temperature of both October and September finishing 0.2C below average it is probably safe to say that the weather is in an average kind of mood.

Conditions during the first part of November look changeable, according to the Met Office’s 30-day forecast . After mid month, however, the agency says the forecast is uncertain.

Now that much of the UK has had its first frost any warm spell in November will, correctly, be called an Indian summer. A singularity called the St Martin’s Summer occurs in 66 per cent of years, occurring between 15th and 21st and peaking on the 18th.

And, as if by magic, the GFS model today has this chart for the 16th, an Atlantic ridge of high pressure with daytime temperatures about 6C to 8C above average. Though warm during the day I would imagine there being a risk of fog forming at night
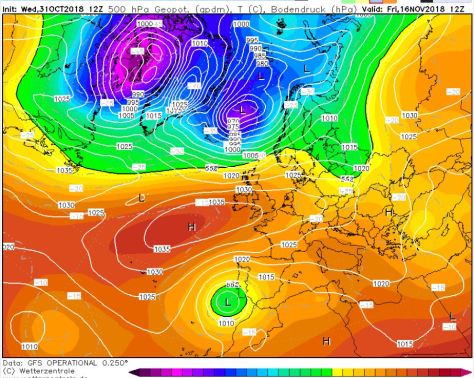
16th

Beyond that there could be a tendency for much more unsettled weather at the end of the month. The early December storms singularity occurs in 98 per cent of years, starting between November 24th and December 14th, often peaking on December 9th.

November, the last autumn month, can often surprise with its extremes, though it can also often be characterised by days of anticyclonic gloom. The warmest, coldest and wettest November conditions in London back to 1959 can be found here.


Perfectly average months are extremely rare

Readers of this blog know that I often described a month as fairly average – a look at local statistics shows that many months come in very close to the monthly mean.

But when you combine mean temperature with rainfall that is 100 per cent average it becomes very rare and non-existent with 100 per cent sunshine hours considered.

Of the 2650 months since 1797 just one, February 1972, saw a mean temperature and rainfall precisely average. However, sunshine hours were just 40 per cent of the 1981-2010 average.

To extend the data I included monthly rainfall totals that were between 90 per cent and 110 per cent of average. Even then just five more months were revealed: September 1806, February 1876, January 1883, October 1886 and March 1972.

Although on paper February 1972 was perfectly average a look at the weather for the month reveals typically variable weather. The website London Weather explains:

The maximum temperature was only 3C on the 1st as mild Atlantic air slowly displaced the very cold continental air eastwards. There were outbreaks of rain, and during the remainder of the first week, although mild, it was often dull and wet. During the second week, active frontal systems crossed the country bringing strong winds but with sunshine between the rain bands. After mid month, east winds returned, and although not cold, it was frequently dull.

Considering the Met Office forecast the mean for this month, October 2018, is set to finish precisely average. However, rainfall looks set to finish well under the average for the time of year.

First frosts in East London since 1959

Although many parts of the UK have already recorded their first air frost this part of the capital, being so built up and close to the City, remains frost free.

Although many may think that frosts are getting later a look back through local statistics to 1959 shows these events are very random.

The scatter graph below illustrates this.

first frost in east london a

Taking out the winters of 1974/75 and 2002/03, which didn’t see frosts until February and January respectively, the scatter can be seen better here.

first frost in east london b

The median for the first frost is November 6th with an average minimum of -1.4C.

October frosts can be a precursor to a mild winter much in the same way that heavy October snowfall in the Alps has lead to an awful season. But there are exceptions, as happened in 2008/09.

* To record an air frost the temperature must fall to -0.1C or lower.

September 2018: average, dry and sunny

September was most notable for the amount of cold nights. The record minimum was matched together with three further new entries into the top ten list of extremes back to 1959 – a rare occurrence.

The mean temperature finished 15.2C, 0.2C below average, ending a run of 5 months where the mean has been, at times, well above average.

Some 32.6mm of rainfall was recorded, 63 per cent of the 1981-2010 average. Some 183 hours of sunshine were recorded, 132 per cent of average and more than August!

For the first time in years the autumnal equinox period was very stormy, as shown by this graph.

wind run

To view full stats follow this link:http://1drv.ms/1kiTuzv

Summary for September 2018 to follow…


London’s October extremes since 1959

October is one of those months that can see both ends of the spectrum; from calm ‘mists and mellow fruitfulness’ and, rarely, frost, to wet and wild systems whistling in off the Atlantic, best known being the 1987 Great Storm and, more recently, the St Jude storm.

I’ve put together a few top 10s of stats for Wanstead, St James’s Park and Heathrow for the month of October.

october extremes

October SJP

Heathrow oct

Some national UK October values according to TORRO

Hottest: 29.4C March, Cambs – 1st 1985
Coldest: -11C Dalwhinnie 28th 1948
Wettest: 208.3mm Loch Avoich 11th 1916

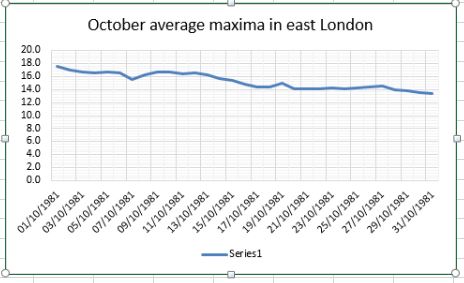
In terms of climatology October maxima, considering the 1981-2010 average, shows a decline through the month, though around the 8th and 20th there is often a spike. This would reflect the October singularities; early October storms, between 5th and 12th, peaking on the 9th, occur in 67 per cent of years. St Luke’s summer, between 16th and 20th, peaking on 19th, also has a 67 per cent probability.
Mid-autumn storms occur between 24th and 29th October, with a 100% probability.

october average graph

The average rainfall graphic shows that downpour amounts are variable through the month. A tendency for dry weather around the 17th and 18th before the wettest days on the 20th and 21st.

October rainfall