With the mean temperature of both October and September finishing 0.2C below average it is probably safe to say that the weather is in an average kind of mood.
Conditions during the first part of November look changeable, according to the Met Office’s 30-day forecast . After mid month, however, the agency says the forecast is uncertain.
Now that much of the UK has had its first frost any warm spell in November will, correctly, be called an Indian summer. A singularity called the St Martin’s Summer occurs in 66 per cent of years, occurring between 15th and 21st and peaking on the 18th.
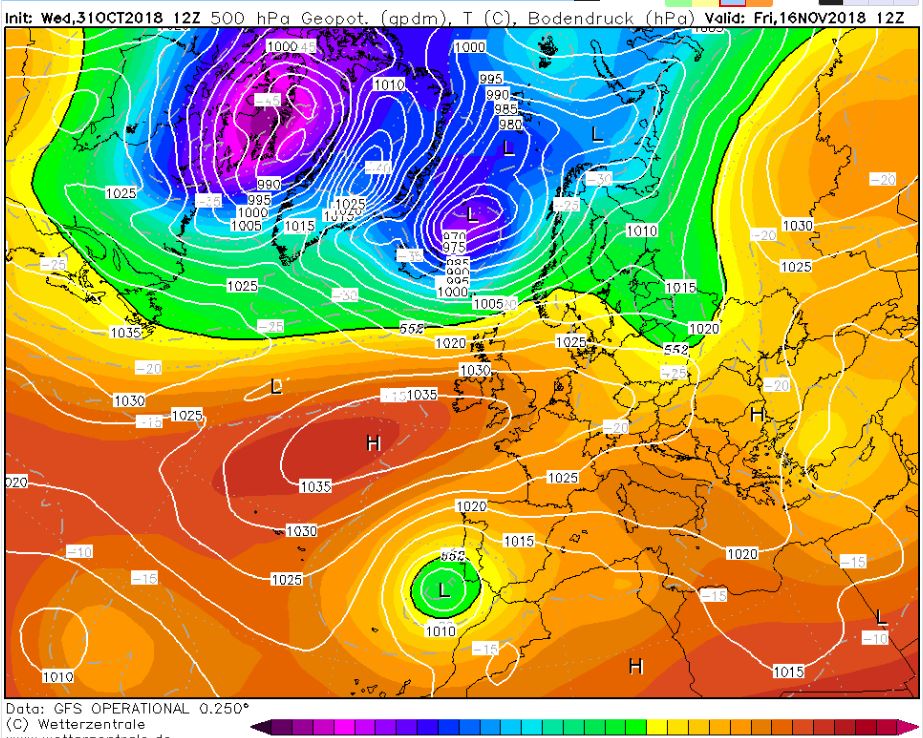
And, as if by magic, the GFS model today has this chart for the 16th, an Atlantic ridge of high pressure with daytime temperatures about 6C to 8C above average. Though warm during the day I would imagine there being a risk of fog forming at night
Beyond that there could be a tendency for much more unsettled weather at the end of the month. The early December storms singularity occurs in 98 per cent of years, starting between November 24th and December 14th, often peaking on December 9th.
November, the last autumn month, can often surprise with its extremes, though it can also often be characterised by days of anticyclonic gloom. The warmest, coldest and wettest November conditions in London back to 1959 can be found here.
Much has been printed in the tabloids over the past month or so that we are in for a severe winter. Not a week goes by without the Daily Express splashing that the ‘Worst winter EVER is on the way’. Just this morning the same rag told us that three months of ‘exceptionally cold’ weather are due. On closer inspection the story elaborated the scene with quotes from James Madden of Exacta Weather, one of the ‘experts’ feeding these fantastical stories.
The Temple, Wanstead Park, always looks that much more stunning with a covering of snow
Quite how Mr Madden and other experts arrive at these forecasts is a bit of a mystery. The mystery has deepened further since I decided to crunch a few numbers and try to predict what is in store for the months ahead. Looking at data for this area stretching back over 130 years to 1881 I decided to calculate a seasonal average and arrived at a final figure using singularities – basically looking at the weather patterns we’ve had during October and November.
Many professionals would scoff at this method of pattern-matching, so I’ve incorporated a couple of other ‘now’ factors and taken on board current variables such as sea surface temperatures in the Atlantic and Pacific.
The figure I arrived at, taken as an average of the closest matching autumn periods, is a mean temperature of 4C with rainfall totalling 133mm over the months of December, January and February – that’s about a degree colder than average and 90% of average rainfall. The probability of a winter with a mean temperature of between 4C and 5C is 37% – the most likely outcome. With this in mind a winter in the form of 1986-87 is possible – though whether we would see the same extremes of temperature and snowfall that we experienced in January 1987 is open to question.
The Met Office, with all their computing power and expertise, seem to be hinting at something similar – ie slightly colder than normal. The opening couple of weeks to my forecast seem quite plausible, looking at tonight’s models. Look at the similarity in the synoptic charts for December 8th here.
Shoulder of Mutton pond, Wanstead Park
Over the last few years the snow lovers among us have been spoiled after a run of very mild winters during the late Nineties and early Noughties that prompted climate expert Dr David Viner to utter the immortal words that one day “children just aren’t going to know what snow is”. It was only a matter of a few years before the words from the senior research scientist at the University of East Anglia seemed a bit hollow.
Mark Twain, born this day in 1835 , once uttered the famous phrase: “Climate is what we expect; weather is what we get” – there is always a chance we could suddenly lurch back to milder winters. This winter could spring a surprise, be it very cold or very mild. But judging what’s happened over the last 130-odd years – a 1962/63 or a balmy 1989/90 look very unlikely.
* Forecasting models use probability on any given outcome. Millions of observations are fed into the Met Office database (and other countries’ weather agencies) every day. Supercomputers then crunch through this data to give probable outcomes. With the volatility of the atmosphere it is not surprising that certainty of any outcome often falls away rapidly. Forecasting has improved greatly in the last 20 years – though anything the models churn out beyond three to five days should be handled with caution. Long range models can give *some* idea of general trends for the months ahead – but changing just one variable can vastly alter an outcome at the end of the run.
* *Over the past few months I have been collating data for the area around Wanstead. This data is freely available from the excellent Met Office library and is emailed via Excel spreadsheet. Rainfall stats include a near-complete daily archive, stretching from 1961 to 2003, from City of London Cemetery . Sadly the rainfall station, along with many others, ceased to supply the Met Office after cuts were made shortly after the turn of century. Prior to 1961 I have used monthly figures taken at the Greenwich Royal Observatory stretching back to 1881. Though this is 6 miles away the difference in temperature between the two areas would be miniscule compared with rainfall data and so can be used. I use my own stats for the period after 2003.


You must be logged in to post a comment.