This winter since the turn of the year has been remarkably snowy for locations above 500m. Which, in the UK, means few of us would have noticed.
A pattern of predominant SE’ly winds feels like it has been locked in for weeks and has brought endless rain to many parts of the country. And much snowfall, particularly above 500m.
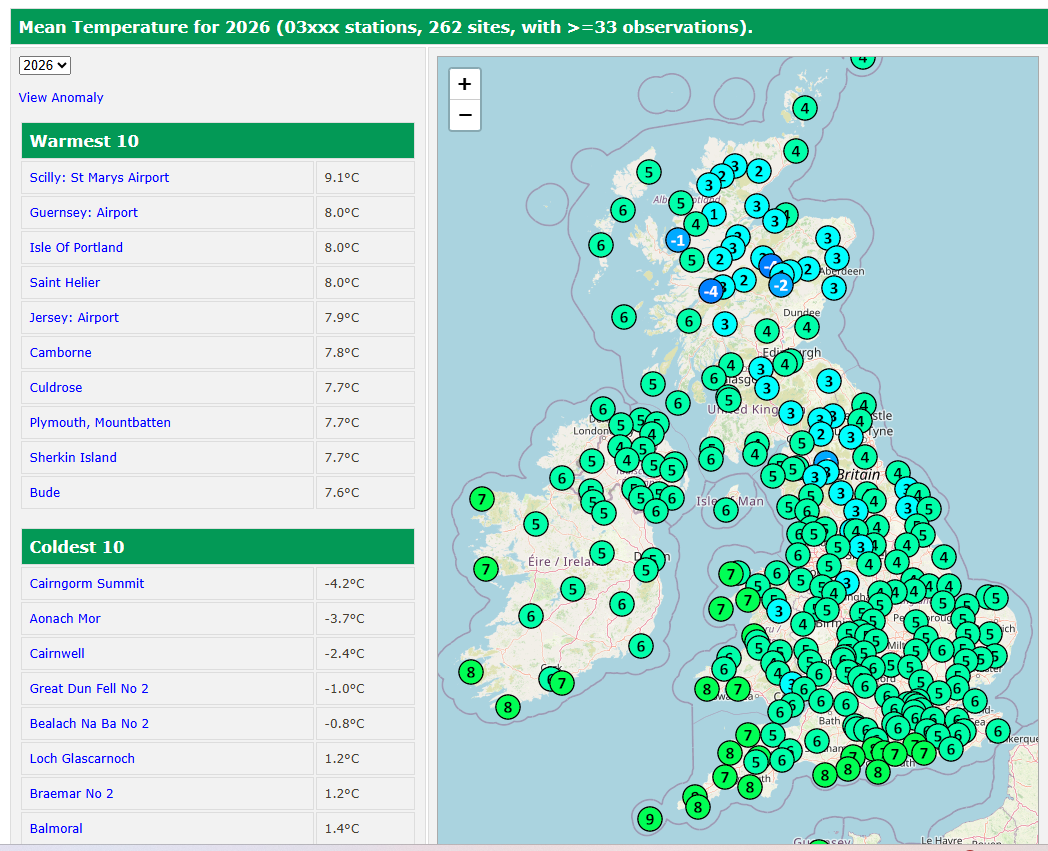
The Scottish Highlands have been the main beneficiary. And, looking at data on the RoostWeather site, there has been quite a sharp gradient in the decrease of mean temperature. Epic snow drifts on NW facing slopes have resulted in large avalanches. One frequent visitor to the Cairngorms said it is the deepest snow he has seen in 60 years.
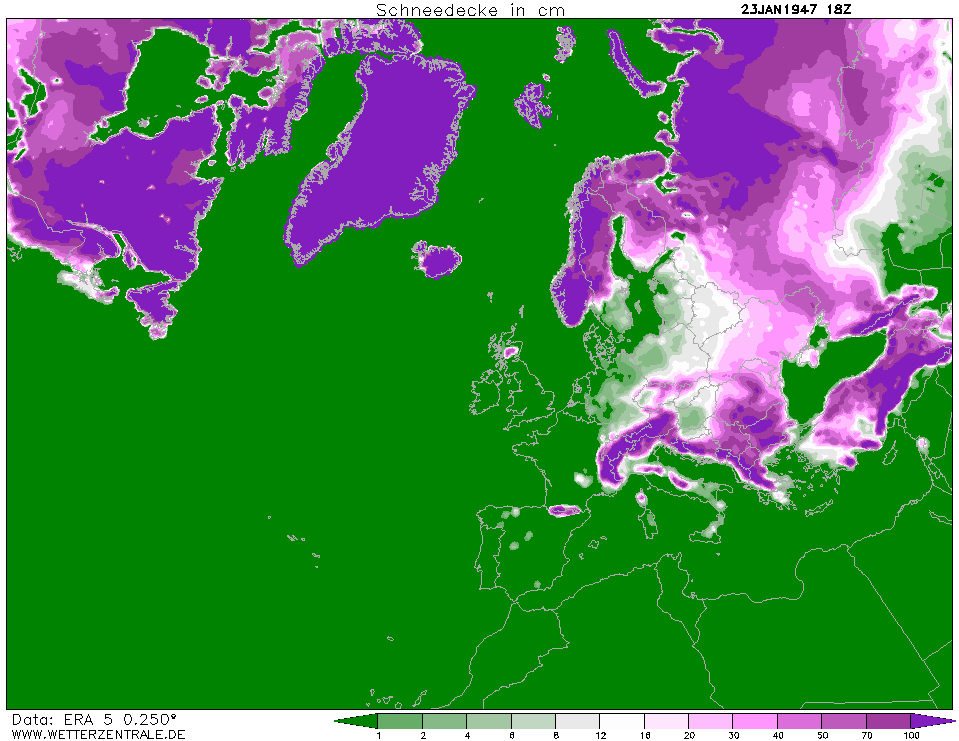
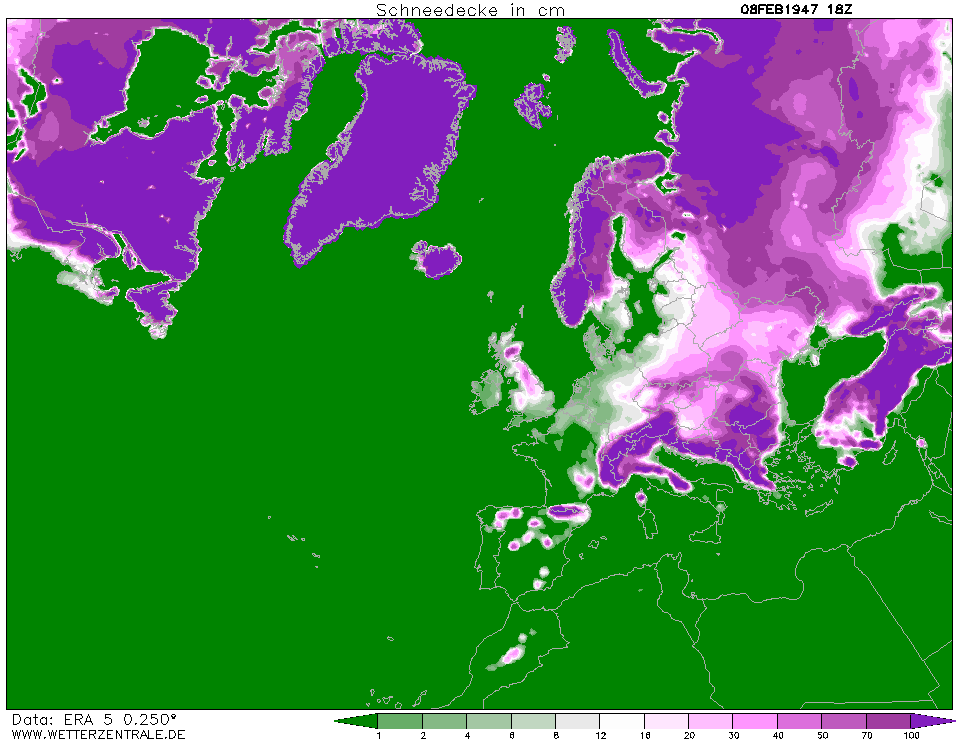
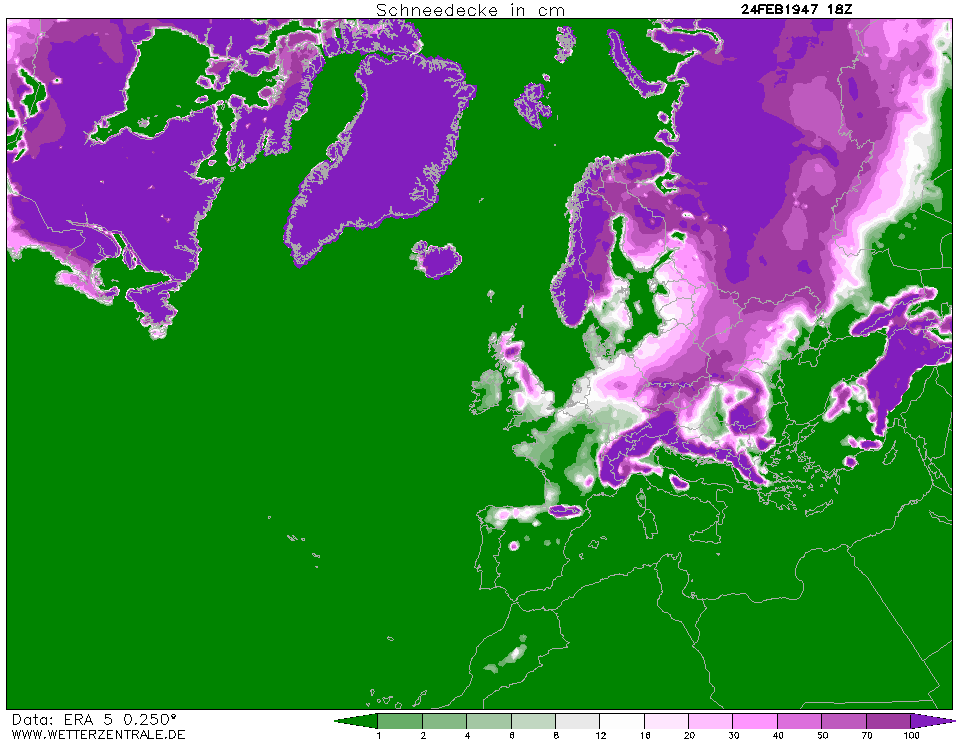
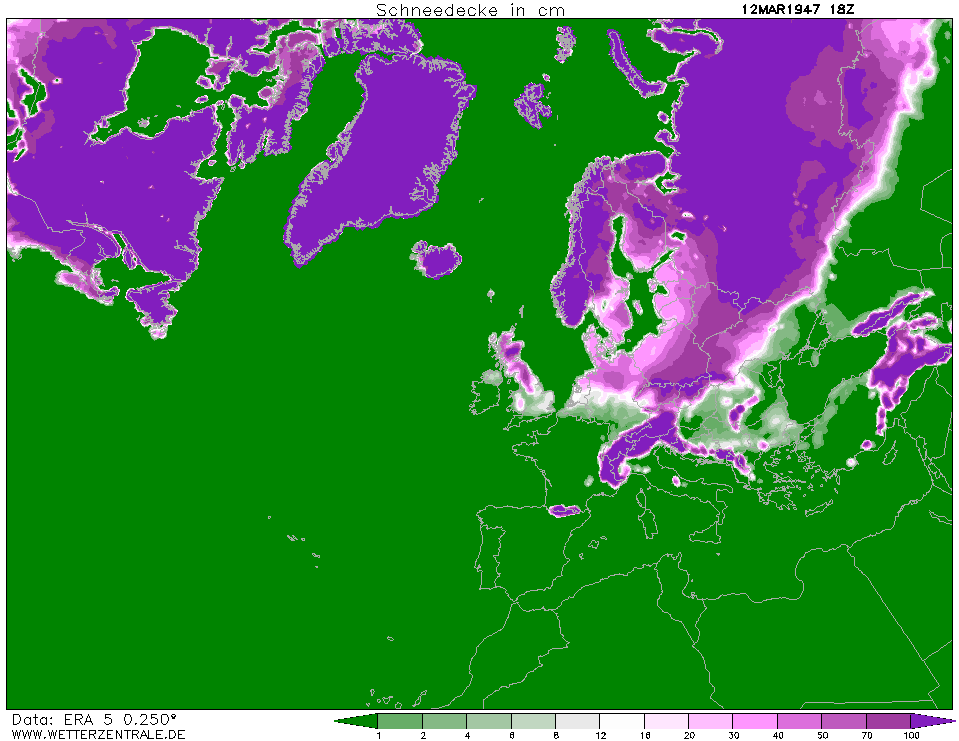
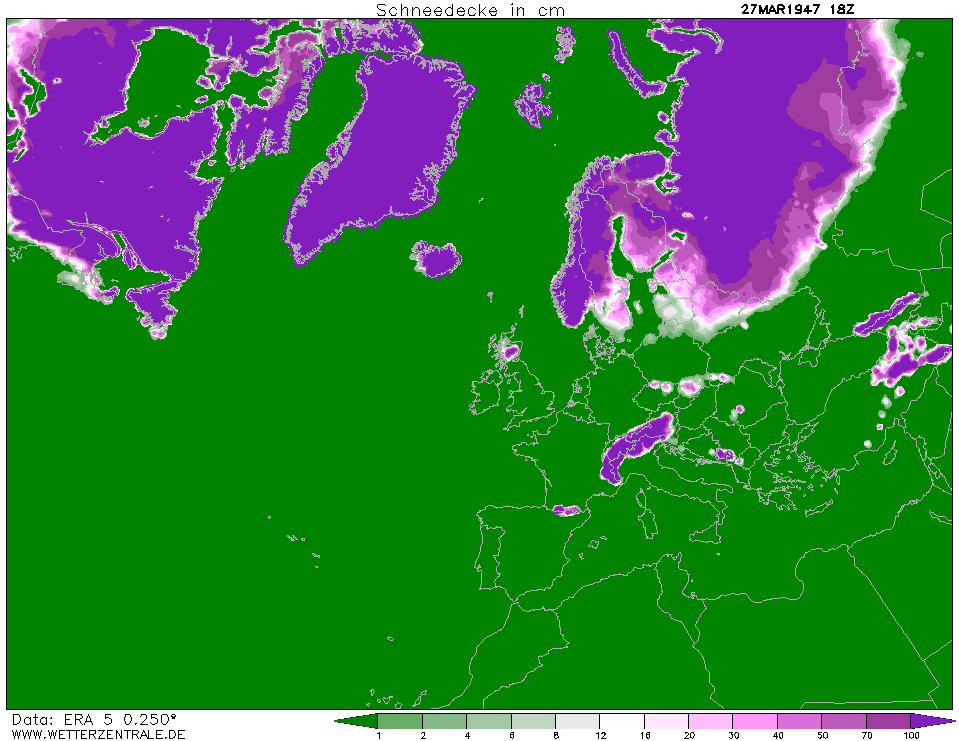
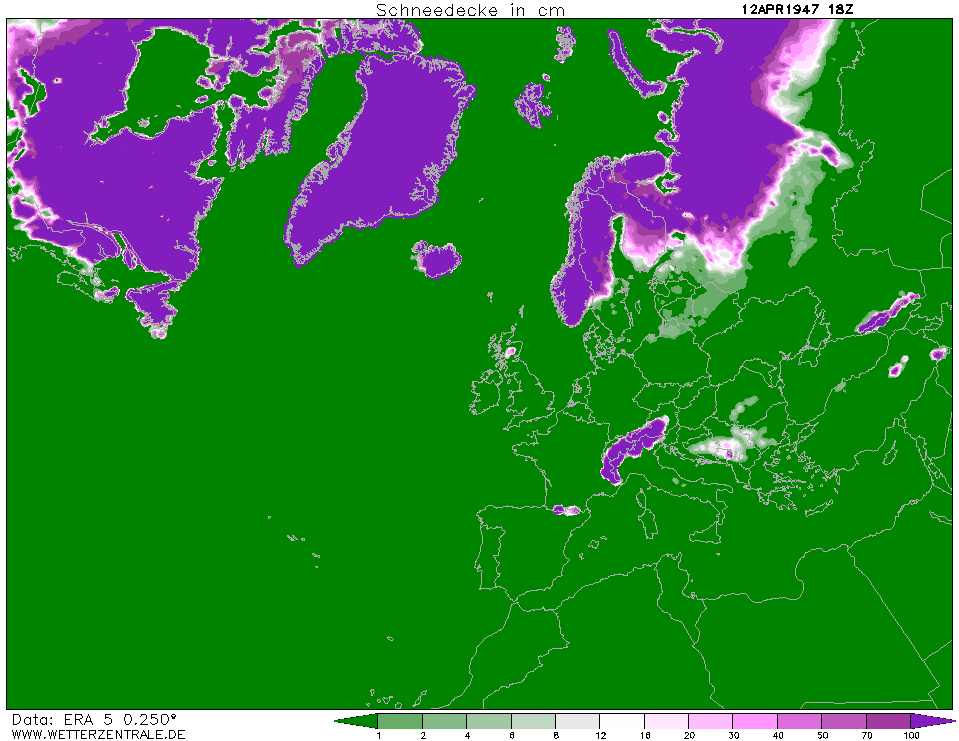
Below is a number of GIFs that illustrate snow cover across the Northern Hemisphere during the late winter of 1947.
This part of the British Isles saw snow cover from late January to mid March. The animation suggests there was snow cover in the London area for an astonishing 51 consecutive days.
A superb account of this fabled winter can be found here.
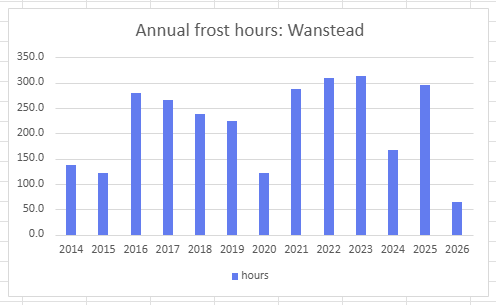
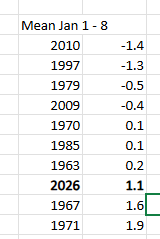
The opening week or so of 2026 has already seen 30 per cent of frost hours recorded locally in an average year.
The temperature at the site in Wanstead has been -0.1C or lower for nearly 64 hours, already more than half of what was recorded here in the whole of 2020.
The mean for January is currently 1.1C, 4.1C below average. It’s also been a wet start with 28mm of rain, 53 per cent of the whole month average.
While there’s been colder starts to a year continuous data that allows this kind of analysis only stretches back to 2014 on this site.
There’s been some very interesting output on the weather models these past couple of days – not least the GFS’s dew points from Christmas Day into Boxing Day.
Very cold air from the east can be seen moving toward the SE of the UK to just across the North Sea – one run has the dew point down to -20C!
The outcome will be different but it’s been a fair while since I’ve seen this sort of solution in what is a relatively short timeframe.
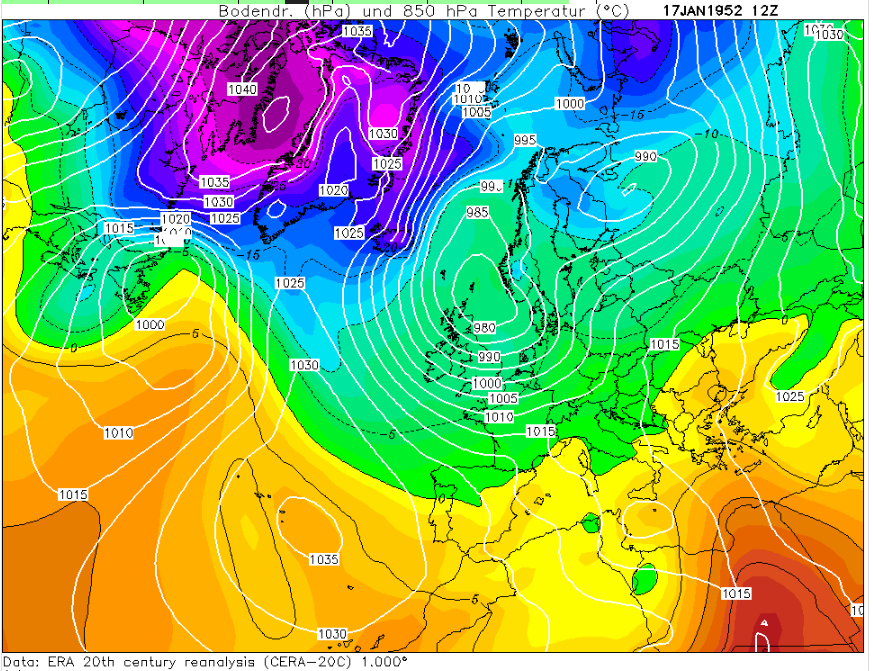
Back in the days of proper winters folk had it hard, especially those living in the Cairngorms. And probably none more so than Bob Scott who experienced more than his fair share of severe weather.
Reading Adam Watson’s fascinating memoir of his time with the legendary Bob Scott o’ the Derry I picked up this fascinating account of the time he had to hand over navigation to his horse, Punchie, to guide them home through a blizzard in January 1952.
Watson writes on his conversation with Scott: “…it was the worst storm I’ve ivver been oot in, on my wey hame fae the Linn in the aifterneen. The drift came on sae thick I couldna see the horse’s heid as I sat on the sledge. I couldna have got hame if it hadna been the horse”.
A gale battered his face with suffocating drift. He judged that he must be near the Derry wood, but the storm now became violent. He had to turn his head away and let Punchie take over. Suddenly the gale dropped and the drifting stopped as a dark wall loomed yards away, the lodge wood! Snow still fell thickly, but he had shelter and knew where he was. Punchie had come right to the narrow gap where the road entered the wood.
Watson’s book It’s a Fine Day For The Hill is a beautiful memoir packed with anecdotes of his life in and around the Highlands.
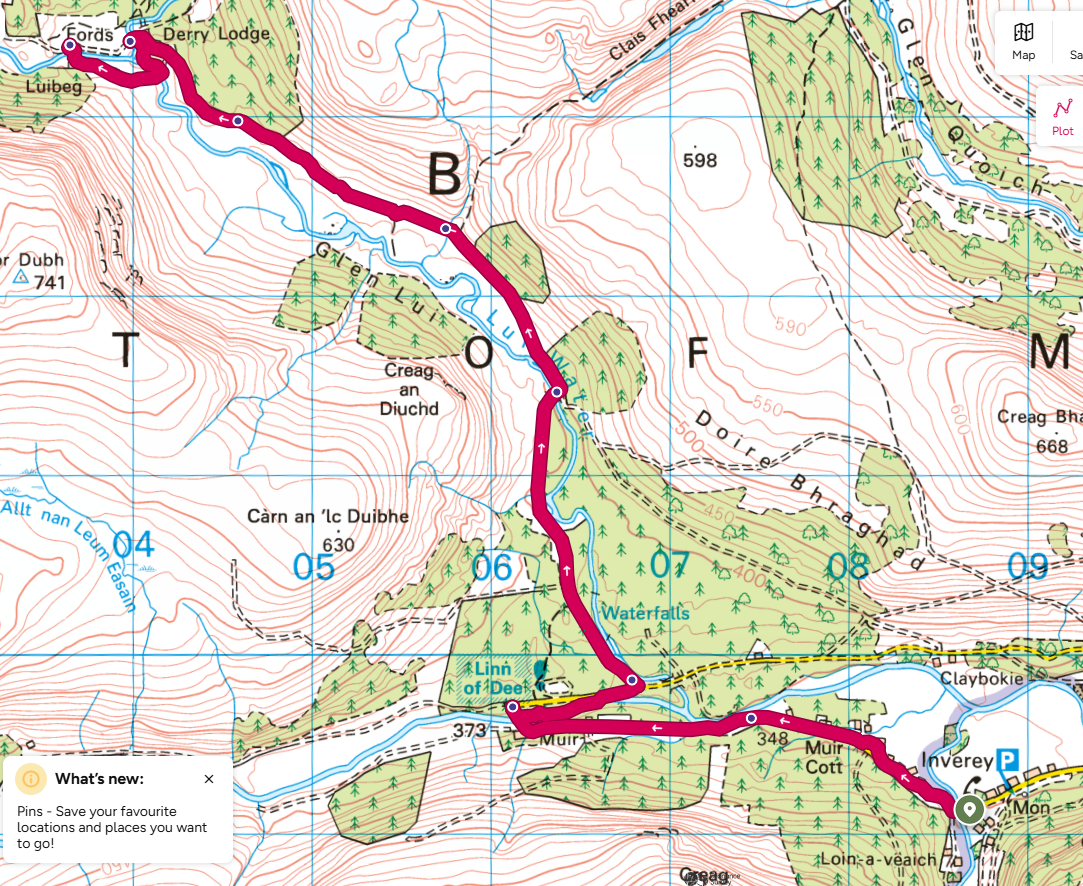
The route from Inverey to Luibeg, the ‘most beautiful part of the Cairngorms’
The mean for summer 2025 in Wanstead finished 19.8C, 1.8C above the 1991-2020 average and the second warmest summer in a local record going back to 1797. The figure was just 0.2C short of the warmest summer in 2022.
It was a dry season; just 84.5mm of rain was recorded, the driest for three years and 21st driest to 1797.
Taking a broader view of Greater London, using Met Office statistics for St James’s Park and Heathrow, reveals that summer, as an average of the three, finished second warmest, just 0.174 behind 2022.
In terms of rainfall it finishest 22nd driest with an average of 92.2mm.
Some 590.5 hours of sunshine were measured at Heathrow, 105% of average and the sunniest for 3 years.
The very dry spring had already taken its toll on the Ornamental Waters, Wanstead Park
Sunshine of late seems to have been endless with the past 10 days being virtually cloudless from dawn to dusk.
After a very sunny March which saw over 170% of average sunshine recorded at Heathrow April has already seen over 56% of average sun hours in the first eight days.
In terms of the total percentage possible of sun hours the past 11 days are second only to a period in 1990 that stretched from April 27th until May 7th.
The pattern has seen an anticyclone near stationary to our north, generating a dry NE’ly feed. Some 12.2 hours of sunshine were recorded at Heathrow on the 6th.
There’s been quite a few superlatives thrown at this early January cold spell, not least the recording of the coldest January night at Altnaharra in 15 years.
Snowfalls across the Highlands, Lake District and northern England have been notable in their longevity relative to recent years.
But the absence of any lying snow at 9am in this locality and fairly standard minima for January left me looking elsewhere for something notable.
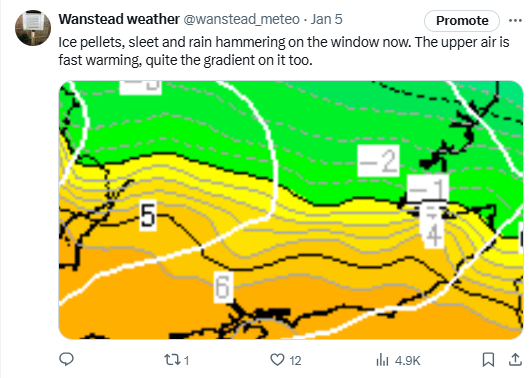
Airmass battlegrounds are a regular feature of UK winters though I can’t remember a time when this region has been right on the boundary.
The temperature on the 5th climbed from 3.2C at 0810 to 11.3C at 1050. Here it hovered until 0710 on the 6th before plunging to 3.2C again by 0910 – a period of just 2 hours.
There was some transient snowfall on the evening of the 4th but it lasted a matter of hours with the incoming warm air after midnight..


You must be logged in to post a comment.