Summer forecast 2017: average

The dry nature of spring this year has scuppered a large part of my usual method of trying to predict the summer season.

burning sunset

With El Nino forecast to be neutral I decided to once again rely on pattern matching of meteorological data from this area for March, April and May stretching back to 1797.

The mean for the spring season, the second warmest on record, was 11.9C with 88.6mm of rain and 430.3 hours of sunshine.

If you take into account all years that were within +/- 10 per cent of these figures, for rainfall some 12 ‘best fit’ years emerge. I normally go on to reduce the list further by considering mean temperature but, this year, no figures would remain!
The list of 12 summers, ranging from 1807 through to 2005, saw all manner of summers, including 1808 when early July heat gave way to fierce thunderstorms with hail the size of tennis balls recorded. Only one was a real corker, 1906, but most were fairly nondescript.

As an average this summer could be expressed as: Mean: 17.2C (just below average) Rainfall: 141mm (about average).

Or, expressed in probabilities, I concluded the following:


summer 2017 prob

From the above you could deduce that the next three months will be around average, with average rainfall.

To try to give some idea of what month will have the best weather I’ve broken down the summer into June, July and August probabilities.

Looking at June, considering the unsettled outlook after the weekend, I would guess that a few very warm, thundery spells are possible– though much of any precipitation will stay to our west.June 2017

On to July. After an average June I wonder if the ‘return of the westerlies’ will happen just in time to affect this month?

July 2017


The above chart would suggest that July will be classically average overall. Fine, not too hot spells, with occasional depressions bringing cooler weather and showers.

On to August. Apart from last year this month has been a real disappointment the previous few years. Looking at the probabilities would suggest that August will be the most disappointing month.

august2017

Looking at the above probabilities there seems a fair chance of something cooler than average.

There’s not really much to go on. I note the Met Office is going for ‘warmer than average’ but a look at their methodology and the coming season doesn’t look that exciting.

* Taking into account the fact that temperatures in London are up to 0.66C warmer than they were 100 years ago I have added 0.66C to mean temperatures before 1915.

** Obviously, in the event of a series of direct hits from thunderstorms, my rainfall estimate could be hopelessly short – a symptom of abundant solar energy at this time of year which creates a ‘noisy’ atmosphere compared with winter.

*** The 1981-2010 average mean for summer in this region is 17.6C, with 144.9mm of rain and 564 hours of sunshine

Winter sports and Alpine snowfall variability

The Alpine snowfall season finished just below average in the Splügen area of the Swiss Alps. Abnormally warm weather after decent snowfalls in February and March curtailed the season; mean temperatures finished over a degree warmer than average between November and April.

The figures make depressing reading for anyone who enjoys winter sports and come after a study suggested that bare Alpine slopes could become a much more common sight in the future.

I first visited this area of the Alps in 1981, returning most February half-terms, apart from 1989 when the snows failed to arrive until after Easter. The season that hastened the installation of artificial snowmaking in resorts across Europe has always left me wondering just how much snowfall has varied.

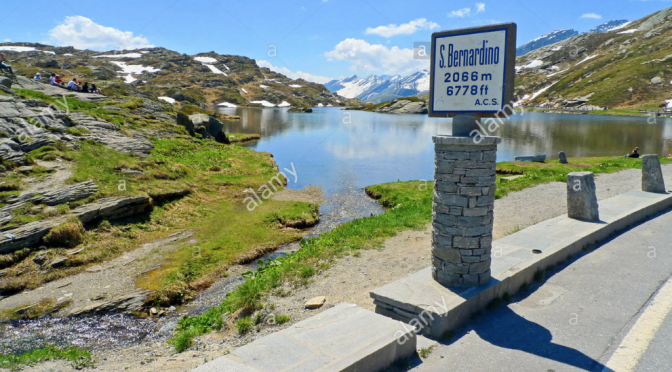
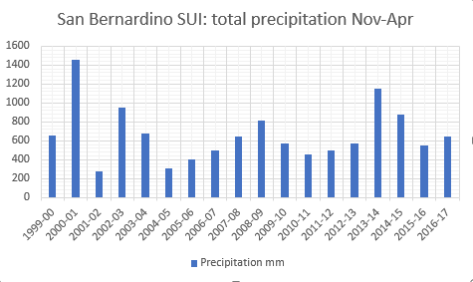
Using San Bernardino, a village at 1636m in the southwest of Grisons canton, I had a look at temperature and rainfall data back to 1999 to see what patterns were present. The figures confirm that some years see metres fall while others have barely enough to cover the pistes.Screen Shot 2017-05-17 at 13.20.29


Temperatures, meanwhile, show a general upward tick from 2005-06.

Screen Shot 2017-05-17 at 13.24.46


While the above graphs show typical variability they don’t reveal much about month to month conditions.

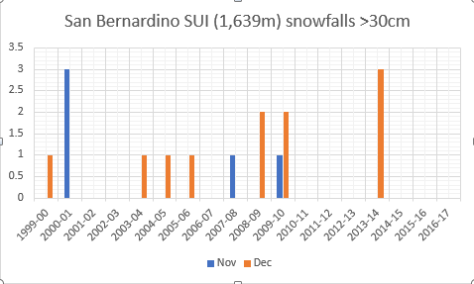
Closer scrutiny of the data shows that early season dumps of over 30cm, the kind that really get the snow bases going and keep the earth below chilled for a long season, are becoming rarer. Indeed, apart from a blip in 2013/14 there have been no big early season dumps since 2009/10. The seasons are taking much longer to get going.

Screen Shot 2017-05-17 at 13.15.52

Screen Shot 2017-05-17 at 13.30.23

As the second graph shows big dumps of snow are happening later in the season. If there is not already a decent snow base these snowfalls can thaw much faster because spring sunshine has already warmed the ground.

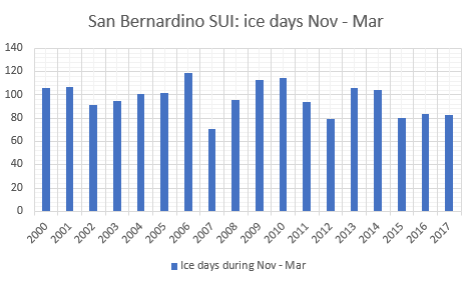
Another way of trying to find how the climate has changed is to look at how many ‘ice days’ there were in a given period – ice days are when the maximum temperature reaches -0.1C or lower over 24hrs.

The graph below shows the past three years have been fairly constant though this season’s total of 83 is 37 days fewer than the highest total in the series, 2005-06 which clocked up 119 days.

Screen Shot 2017-05-17 at 13.38.36

I’ve visited many resorts in the Alps which, obviously, will be affected differently by the changing climate – the range of microclimates in the Alps is staggering.

In conclusion, considering the data and my experience, I’d say that though the Alps have definitely warmed the variability and ebb and flow of the climate means it is impossible to say with confidence that by the end of this century the slopes won’t be covered in the white stuff.

I chose San Bernardino because it is fairly central in the entire Alpine range and is also the most local SYNOP station I can find to the Valtellina range that I have been visiting most years since 1981. Any climatologists reading this would point out that my data range does not stretch back the necessary 30 years to make a judgment on the stats. If anyone can point me to a site that offers data back to 1980 I would happily update my figures and graphs.

My trip this year to Madesimo, 8 miles as the crow flies from San Bernardino, was timed just right for a dump of snow in February that followed weeks of dry weather.

Screen Shot 2017-05-17 at 14.04.58
Temperature inversions were seen in February (above). Snow was only deep enough to descend Madesimo’s Canelone run, reached by the Groppera lift to 3,000m once February snows had arrived

The area has enjoyed some epic snowfalls over the years including 2013/14 when many found themselves snowed-in following a 2m dump of snow.  The first of many snowfalls during what was an epic season.

Here is a timelapse of the huge 2m snowfall in Madesimo over Yuletide 2013


Is this the last remaining snow of winter?

I spent last weekend in the Lake District, on Saturday ascending both Scafell and the Pike, England’s two highest mountains.

The 964m Scafell, though lower than the Pike, is a much more technical ascent with hard to negotiate gullies, among them Lord’s Rake, where I discovered three lumps of icy snow. My findings, that I later Tweeted, attracted the attention of Iain Cameron, who, with a team of volunteers, maps and measures all British snow patches that survive through the summer.

Screen Shot 2017-05-05 at 18.26.12.pngI’ve read about Iain’s findings in the Royal Meteorological Society‘s journal Weather but to find one of these surviving patches myself enabled me to empathise just why he and others find the task of mapping and measuring them fascinating, a sort of first-hand insight into how the UK’s climate varies from year to year.

On descending from Scafell I thought I’d seen further patches lower down but these turned out to be melted puddles on the moorland that were reflecting white against the bright sky.

It was a cracking weekend weatherwise. Though the wind on Sunday was fairly brisk at the top of Hellvellyn it didn’t impact much on the conditions. Two dry days in a row with excellent visibility are rare at any time of year in the Lakes. I can’t wait to return.


April 2017: seventh driest since 1797

The driest April since 2011 was also the seventh driest in a local record going back to 1797. Just 4.3mm fell, nearly half of which was recorded on the final day.

An ‘absolute drought’ that began in March coincided with the month; a run of 26 days with a daily total of <0.2mm! Dry early springs seem to be becoming a pattern in this area with eight of the last 11 Aprils being notably dry.Screen Shot 2017-05-02 at 21.14.02

Though the mean temperature for April finished a fraction above average – 10.6C is 0.8C above average – it was a month of two halves. The month started warm with the temperature peaking at 25.4C on the 9th – Sunday of what was a warm weekend in London.

A polar low on 24th brought an unseasonably cold end to the month with cold days and night frost. Thunder was recorded on 26th and was accompanied by <5mm hail.

The total sunshine hours were just above average: 178.4 hours is 111% of the 1981-2010 average

The wettest day occurred on the 30th with 2mm.

Air frosts: 1, Ground frosts: 7Screen Shot 2017-05-02 at 21.34.19

Looking ahead, I think May will be another slightly milder than avrage month and continuing much drier than average.

Here follows the full weather diary for April. To view full stats follow this link:http://1drv.ms/1kiTuzv

1st: Cloudy into the late morning before some cloud breaks appeared. Brief shower and some warm sunshine but cooler than lately. Cold in early evening and cloud breaks overnight.
2nd: Sunny with variable cumulus. Variable cloud through the day and chilly overnight
Sunny with bubbly cumulus.
Screen Shot 2017-05-02 at 21.35.103rd: Cloudy but with bright breaks and blue sky in distance.
4th: Sunny and pleasant early with bubbly cumulus – this lasted all day.
5th: Sunny with just a few cumulus.
6th: Sunny with just a few wispy cumulus floating around, slight haze.
7th: Sunny and gin clear.
8th: Sunny spells with a few cumulus. Much cooler.
9th: Sunny with some cirrus and cumulus.
10th: Sunny though with lots of cloud at times.
11th: Sunny start then clouded over then sunnier again with cloudier periods.
12th: Early sunny spells, the cloud thickening by 11.30pm to leave a mostly cloudy afternoon.
Screen Shot 2017-05-02 at 21.33.4513th: Cloudy though high base made it seem bright. Feeling chilly. A shower overnight.
14th: Bright start though with plenty of cloud around. Clear spells overnight.
15th: Sunny early though cloud increasing – a very light shower at 2.15pm.
16th: Cloudy, dull and cool. Some brightness at 2pm but then cloud thickened and breeze freshened to leave a cold afternoon.
17th: Sunny with variable cloud – clear overnight with ground frost.
18th: Sunny with broken cloud to start.
19th: Sunny start but clouded over, then sunny intervals.
20th: Cloud and mild all day.
21st: Very light drizzle to start then heavy cloud. Drizzle turned to light rain in Beckton but dry in Aldersbrook.
22nd: Bright start with broken cloud.
23rd: Bright early with patchy cirrus and altocumulus then completely cloudy and chilly. 24th: Some spots of rain around before moderate shower arrived at 5pm with 0.54mm falling.
25th: Sunny, clear start in polar air before cloud bubbled up around 10.30am. Then sunny spells – dew point stayed around or below freezing all day.
26th: Overcast and chilly with a cold breeze.
27th: Sunny, frosty start but cloud quickly bubbling up. Felt chilly.
28th: Mostly cloudy with the odd sunny spell
29th: Bright start but quickly turning cloudy
30th: Sunny early but gradually clouded over with rain at 1am. This stopped around 2am with small fall before 9am.