
October is one of those months that can see both ends of the spectrum; from calm ‘mists and mellow fruitfulness’ and, rarely, frost, to wet and wild systems whistling in off the Atlantic, best known being the 1987 Great Storm and, more recently, the St Jude storm.
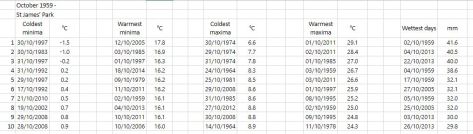
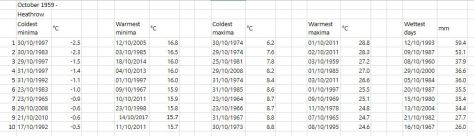
I’ve put together a few top 10s of stats for Wanstead, St James’s Park and Heathrow for the month of October.

Some national UK October values according to TORRO
Hottest: 29.4C March, Cambs – 1st 1985
Coldest: -11C Dalwhinnie 28th 1948
Wettest: 208.3mm Loch Avoich 11th 1916
In terms of climatology October maxima, considering the 1981-2010 average, shows a decline through the month, though around the 8th and 20th there is often a spike. This would reflect the October singularities; early October storms, between 5th and 12th, peaking on the 9th, occur in 67 per cent of years. St Luke’s summer, between 16th and 20th, peaking on 19th, also has a 67 per cent probability.
Mid-autumn storms occur between 24th and 29th October, with a 100% probability.

The average rainfall graphic shows that downpour amounts are variable through the month. A tendency for dry weather around the 17th and 18th before the wettest days on the 20th and 21st.

