Wild equinox brings memories of childhood

Wild weather in the run up to the autumnal equinox was frequently a staple of the Septembers of my childhood but it has been absent in recent years.

Since 2013 I have been recording the ‘wind run’ data on my AWS, a stat generated by the amount of times the anemometer spins.

wind run

The results show there has been nearly two-and-a-half times more wind than the 5-year average.

Stormy weather over the equinox is one of the less frequent recurring singularities. The meteorologist Philip Eden a few years ago noted that ‘Mid-September storms’ during the period of 17th to 24th September had a frequency of 60 per cent.

20th
The wind run was the highest on 20th

The disappearing street trees of Wanstead

Street trees around Wanstead and the surrounding area have been disappearing at an alarming rate over the last few years. But it is not just the council’s technical policy of removing mature specimens that is to blame.

Changing rainfall patterns and poor husbandry have both contributed to the loss of some of the magnificent trees that once graced our roads and avenues.

A huge horse chestnut that once stood outside Wanstead High School first showed signs of distress in 2011. By 2017 it was completely dead and has since been chopped down.

One of the large limes on St Mary’s Avenue was a picture of health in 2015 but within two years it was completely dead and has also since been chopped down.

A huge old beech in the front garden of a property in Blake Hall Road was showing signs of distress in 2017 and came crashing down in 60mph winds from Storm Fion in January 2018.

Yet another huge old beech that stood proud in a front garden of St Mary’s Avenue has been dying since 2012. The second image reveals very thin foliage in summer 2017. The tree was chopped down a couple of weeks ago as it was clearly dead and posed an obvious safety risk, given what happened to the beech in Blake Hall Road in January this year.

The mature trees of Christchurch Green took a real hammering during the St Jude Storm in October 2013, among those lost were three gorgeous old limes. New trees have been planted but they will take decades to match the size of those lost.

Of course the loss of these trees and other could be attributed to bad luck and coincidence that many are reaching the end of their lives at the same time.

As a country we get a bit hung up on cutting trees down – in the near continent they are much more pragmatic and proactive through planning over a period of years in getting trees in the ground. So that when trees do die there’s not such a huge gap left in roads and parks.

On tree basesaying this there also needs to be more joined up thinking by councils in terms of looking after the existing tree stock. Far too many trees suffer because contractors are inconsistent with road and pavement repairs. Ideally the base of trees should have space for mulch to be applied but, too often, Tarmac is applied right up to the base.

Have you noticed mature trees dying suddenly recently? Please reply to this blog and I will add them.


The disappearing deluges of September

While putting together my September extremes blog I noticed that the month was marked by some big rainfall episodes. On a national scale TORRO statistics show that a south-east climate station holds the daily record for September – unusual in that every other month is dominated by stations in the north and west of Britain.

Further analysis of local data since 1959 shows how September has slowly evolved from being dominated by autumnal to summery weather. The wettest period, from the mid Sixties to the mid Seventies, saw 42 per cent of highest daily rainfall events recorded.

Two of these events, in 1968 and 1973, are well noted and appear in RMET’s Weather magazine.

1968

In Wanstead, between 14th and 15th September, a total of 58.4mm fell, a large total though far less than elsewhere.

The rain became torrential overnight in southeast England and continued through most of the 15th. Rainfall totals ranged from three inches in the London area and nearly four inches in southern Essex to approach the quite abnormal level of nearly seven and a half inches in parts of Kent during the 14th/15th.

The area of greatest precipitation was near the Kent, Surrey and Sussex border where violent downpours in the 12 to 15 hour period from midnight on Saturday to the early afternoon of Sunday 15th led to widespread and disastrous flooding. The heavier rain area moved north and east during the night of 15th/16th and Gorleston recorded.

The highest accepted two-day falls were 201mm at two rain gauges at Tilbury
and Stifford in Essex, and a similar fall north of Petworth in Sussex. The highest ‘rainday’
totals (i.e. nominally 0900–0900 GMT) listed in British Rainfall 1968 were 129 mm at
Bromley and 125 mm at South Godstone sewage works in Kent, both on 15
September.

This exceptional event was described by Bleasdale (1974), Salter and
Richards (1974) and Jackson (1977) and the map below (Fig. 1) is taken from Bleasdale’s
paper in British Rainfall 1968 (p. 231). In all, some 575 km2 received more than 150 mm
in 48 hours.

1968 rainfall

1973

In Wanstead, on 20th, a total of 55.4mm fell, the largest daily total recorded in September. Again it was far less than elsewhere.

5pm gmt 20th 1973

There were notable falls of rain in London, Surrey, West and East Sussex, and particularly Kent. At Manston, near Margate, 172 mm fell in 18 hours 40 minutes commencing 1710 GMT; at nearby West Stourmouth 190.7 mm fell in the rainfall day i.e. the 24 hours commencing 0900 GMT on 20 September (source: Met Office internal list of heavy falls of rainfall in short periods in the United Kingdom during the year 1973; Rainfall/heavy falls section listing, available in manuscript/computer printout form in Met Office archives).

The future

Big September rainfall events seem to be becoming rarer in our part of the UK, the last was in 2014, on the day of the Scottish referendum, though this was convective rather than frontal rainfall.

The outlook for the rest of this month suggests yet another absence of a large rainfall event. The ingredients for large rainfall totals in the south-east – blocking high to the north with slow moving low pressure over Brittany – look unlikely to form during the remainder of the month. We probably will see rain but any fronts are likely to move through quickly, with typical totals being around 5mm.

rain rest.gif

When did September become a summer month?

The answer is around 1993. A look back at mean temperature and rainfall statistics for east London over the past hundred years reveals that the ninth month has, since that date, slowly become warmer and drier.

Putting all the arguments of meteorological and astronomical summer aside, many people of a certain age regard September as an autumnal month, but as recent years have shown it can very often be an extension of summer; September 2016 was the second warmest on record in the local area, warmer than many previous summer months!

Looking back even further, over the past 100 years, the September mean has trended upward, though many peaks and troughs reveal how the month has ebbed and flowed from being summery to autumnal.

The prognosis to the end of this month suggests that air pressure will be anomalously high – so the pattern in the south-east for settled, summery weather in September doesn’t look like ending any time soon.

sept means
The September mean trend has crept generally upward.
sept rainfall
A look at rainfall back over the last 100 years shows that wet Septembers have been on a general decline since 1994.

sept chart.gif

Climbing the 3,200m Jegihorn

Four months on from an amazing ski tour I was back in the Swiss Alps in August, this time for a week of mountaineering and rock climbing.

The (mostly) white wonderland of April had transformed into the deep green of summer in the valley, the temperature on my arrival in Visp was a hot 30C. Waiting patiently was my guide, Davide, and we were soon on our way to the cooler climes of Saas Grund, little sister to Saas Fee – though with scenery as, if not more, spectacular.

weissmeis
The glacier leading up to the 4,017m Weissmies stops abruptly around 3,000m

Day 1: Jagihorn from Hohsaas hut

Mountain sickness saw me abandon any attempt of climbing the Weissmeis. Though sleeping at the the Hohsaas hut was intended to help me acclimatize to the altitude I think the 3,100m elevation was simply too much for my system to handle. It is hard to put into words the symptoms; imagine your worst-ever hangover and multiply it by five.

hohsaas
The Hohsaas hut, left, and cable car

Anyone can get sudden altitude sickness, even top athletes. After an awful night I was ready to descend back to Saas Grund but was soon sent back to bed with a painkiller. Two hours later I was just about fit to set off and was soon descending down the valley to climb the 3,200m Jegihorn in the far distance. I felt a pang of disappointment as I glanced over my shoulder at the magnificent Weissmeis; the purpose of the week was to get as much glacier mountaineering as possible.


jegihorn distance
The Jegihorn can be seen in the distance

As we traversed over the scree and across gurgling streams however, the beauty made me forget my disappointment. The sheer magnificence of the Jegihorn soon became apparent, too. It reminded me of Tryfan in Snowdonia, only this was three times the size.

The route up soon forked – it was either the ‘easy’ way up or via ferrata, a series of steep drop offs, grab handles, steps and precarious looking ladders allowing access up sheer cliffs. After a couple of hours progress to the peak proper becomes a choice of climbing down and up or this suspension bridge that is like something out of the film Cliffhanger.

bridge
This suspension bridge, high above a ravine, saves the pain of walking down and up to the summit proper.
bridge me
Like something out of the film Cliffhanger

After the bridge it is a further scramble up steep ledges and narrow gullies for the remaining couple of hundred metres to the summit.

summit marker
The summit of the Jegihorn with Saas Fee in the far distance
summit me
The 3,206m Jegihorn using the via ferrata route up

With every summit comes a descent, the part I always find the hardest because of the strain on the knees. But the trek back to the bottom of the Hohsaas cableway presented plenty of scenery.

blue lake
A solitary cloud hangs above a aquamarine mountain lake
grey glacier
The rugged and harsh glacial landscape, shaped over millions of years
boulders
The landscape on the way down from the Jegihorn shows all the signs of movement that comes with time
marmotte
I saw about 5 marmottes on the descent. You can see one under the rock if you look closely


UFO flies by the Shard

I often look at the excellent webcams of London site to help me decipher cloud types and amounts for my 9am GMT observation. This evening I discovered that the timelapse of the last 24 hours included a very interesting white light floating past the Shard.

At limited resolution it is difficult to see what the object is. My suspicions that a UFO had been captured were quickly shot down with the help of Twitter including the excellent 

My UFO was the Moon!

London’s September extremes since 1959

September in recent years has often been a more summery month than August. But this month in some years can see a rapid onset of autumn.

I’ve put together a few top 10s of stats for Wanstead, St James’s Park and Heathrow for the month of September.

september extremes

SJP september

heathrow sept

Some national UK September values according to TORRO

Hottest: 35.6C Bawtry, South Yorkshire – 2nd 1906
Coldest: -4.5C Dalwhinnie, Highland, – 26th 1942
Wettest: 190.7mm West Stourmouth, Kent – 20th 1973

In terms of climatology September maxima, considering the 1981-2010 average, shows a slight decrease through the month, though around the 1st and the 22nd there is often a spike. This would reflect the September singularities; early September warmth occurs in 82 per cent of years while the ‘Old Wives Summer’ has a 64 per cent probability.

september mean


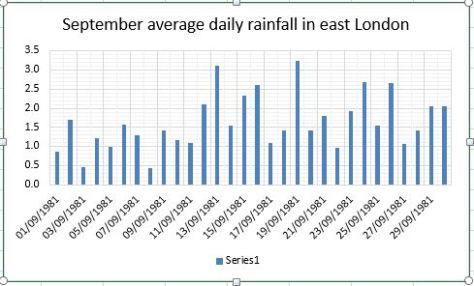
The average rainfall graphic shows that downpour amounts are variable through the month. A tendency for dry weather to the 8th prevails before the trend increases, the wettest days usually 13th and 19th.

sept rain


August 2018: average temps, rain, sun

August was a big let down in a summer that saw the mean temperature nationally match the UK’s best-ever summers.

summer max 2018
Summer maxima took a real dip during the first week of August

The mean temperature finished 18.9C, 0.7C above average.

Some 69.5mm of rainfall was recorded, 139 per cent of the 1981-2010 average. Some 169 hours of sunshine were recorded, 87 per cent of average. Apart from being 1.5C warmer than average it was a carbon copy of last August.

To view full stats follow this link:http://1drv.ms/1kiTuzv

Summary for August 2018

Temperature (°C):
Mean (1 minute)  18.8
Mean (min+max)   18.9
Mean Minimum     13.8
Mean Maximum     24.3
Minimum          6.9 day 10
Maximum          33.1 day 03
Highest Minimum  19.1 day 03
Lowest Maximum   17.0 day 09
Air frosts       0
Rainfall (mm):
Total for month  69.5
Wettest day      13.6 day 16
High rain rate   48.3 day 10
Rain days        14
Dry days         17
Wind (mph):
Highest Gust     22.8 day 24
Average Speed    2.5
Wind Run         1841.7 miles
Gale days        0
Pressure (mb):
Maximum          1025.1 day 31
Minimum          1001.3 day 26
Total hours of sunshine        169


England’s heatwave hangover

These superb MODIS satellite images from Nasa show how the bulk of England turned from a vibrant green in June to a parched brown a month later, as the weeks-long heatwave reached its peak.

At the beginning of September the South and North Downs are once again turning green but, after the driest summer for 15 years in many places, the landscape still has a long way to go.

25062018x
June 25th 2018
27072018
July 27th 2018
020920198
September 2nd 2018

Summer 2018: second hottest since 1797

The results are in and statistics show that this summer was the second hottest in a local record going back to 1797. The mean temperature of 19.57C was 2.4C warmer than average, just six hundredths of a degree cooler than the summer of 2003.

A sustained period of heat that continued the theme of the hot late spring was enough to see a new entry into the hottest-ever list of heatwaves.  But the hottest weather was over by the end of July, August being very disappointing compared with the first two months of summer.

It was also the driest summer for 15 years. Just 87mm were recorded, that’s 60 per cent of average and just 7mm wetter than the historic summer of 2003, the year the UK’s highest temperature record was set.

It was the sunniest summer for 5 years: 663 hours of sunshine were recorded, over 100 hours less than 1976, the 24th sunniest summer since 1881.

Hottest day: 34.7C (26/7)
Coolest day: 17C (9/8)
Warmest night: 19.7C (26/7)
Coolest night: 6.4C (12/6)
Wettest day: 13.9mm (16/8)

summer max 2018

summer 2018 rain

Summary for period 01/06/2018 to 31/08/2018

Temperature (°C):
Mean (1 minute)  19.4
Mean (min+max)   19.6
Mean Minimum     13.7
Mean Maximum     25.5
Minimum          6.4 on 12/06/2018
Maximum          34.7 on 26/07/2018
Highest Minimum  19.7 on 26/07/2018
Lowest Maximum   17.0 on 09/08/2018
Air frosts       0
Rainfall (mm):
Total for period 86.9
Wettest day      13.9 on 16/08/2018
High rain rate   48.3 day 10/08/2018
Rain days        19
Dry days         73
Wind (mph):
Highest Gust     22.8 on 24/08/2018
Average Speed    2.6
Wind Run         5714.2 miles
Gale days        0
Pressure (mb):
Maximum          1029.9 on 21/06/2018
Minimum          1001.3 on 26/08/2018