
Continuing on from last month this blog focuses on the weather recorded at this station over the last 11 years.
A look at the twelfth month shows some interesting trends…
The 9am air pressure readings were not included in previous climate summaries owing to analogue barometers only giving approximate air pressure readings. The advent of AWS has changed that, particularly for independent amateur observers.
A look at the below graphic shows pressure falling through the first half of the month. A sharp rise is then seen before falling again – there’s often storms around the 23rd until the 27th.

Average daily windrun is how much wind there’s been during a 24 hour period. The 23rd comes out as windiest.

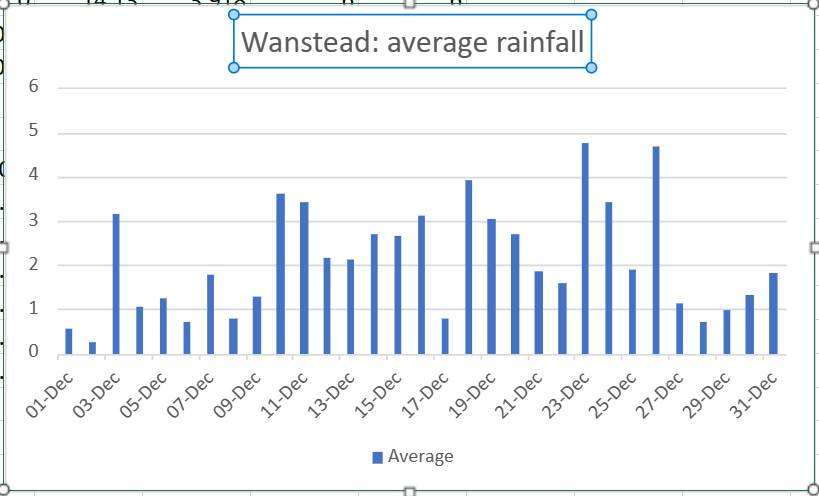
Average rainfall shows precipitation building through the month, to peak on the 23rd before a sharp drop off after the 27th.
Average daily maximum temperatures during December show a stuttering first 10 days before a steady rise through the next fortnight before a steady fall off from the 23rd .

Average daily minima is up and down in the first 10 days before a steady rise from the 11th. Again there’s that falling off a cliff on the 23rd.
This pivotal date, being so close to Christmas Day, is one of the reasons why ‘will it, won’t it be a white Christmas’ is a perennial fascination among the nation.

Advertisements

You must be logged in to post a comment.