A third of winter gone…

…And not a flake of snow. There’s been lots of talk about how an SSW will eventually usher in a cold January and February but it is by no means guaranteed.

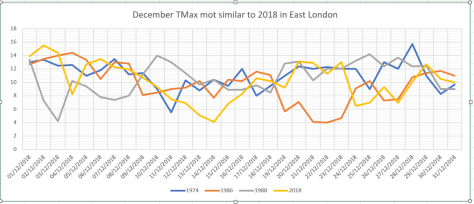
The average maxima for this December will finish 10.2C, precisely the same as December 1985. Other Decembers that finished close to this average maximum are shown below.
As you can see apart from the middle of the month the temperatures are all over the place. And so are the conditions that followed in January and February.

december all.PNG

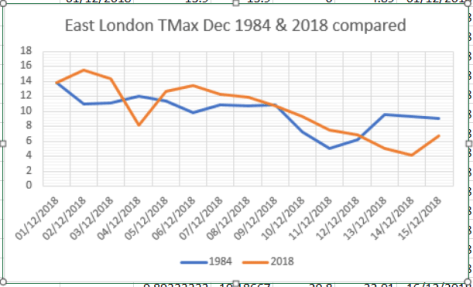
A closer inspection of every year reveals that just three were very similar to 2018: 1974, 1986 and 1988.

748688.PNG

Again, there’s plenty of spread. The 500mb reanalysis charts below show the situation of the northern hemisphere on December 31st of each year, including this year.

What followed in January 1975, 1987 and 1989?
January 1975 in this area was the warmest on record, back to 1797, while January 1989 was the 12th warmest. Conversely, January 1987 saw one of the coldest spells on record.

Perhaps it is fair to say that there is a 66 per cent chance of a very mild January, though you cannot discount the 34 per chance of another January 1987…


Heading for a 1984/85 style winter?

With talk of an imminent statospheric sudden warming (SSW) I thought it would be interesting to have a look back at previous SSWs and see what precedents could be found.

December so far is showing similarities with 1984: mean maxima is within 0.3C of 1984 while rainfall is virtually the same at around 30mm!

During the winter of 1984-85 the polar vortex split on January 2nd, setting up that month to be among the coldest of the 20th century, on a par with 1979 and 1987. A more recent January that was just as cold was 2010.

Indeed, the winter of 1984-85 was among the snowiest of the past 70 years, ranking at number 5 in my survey of winters.

1984-2018.PNG

een

A white or green Christmas 2018?

The GFS model is now within range of the big day on the 25th. From now until Christmas Eve I will be having a look to see what is on offer.

The first operational run suggests something of interest but please bear in mind there is a long way to go yet. While operational runs are often exciting, the below suggests a potent northerly with snow for many, the right hand average is much more realistic though admittedly boring.

My own guess at this stage is for something benign, a high of 6C with a low of 2C, perhaps some frost early or late on?

10th: Op run this morning is showing quiet weather. A high of 4C after overnight frost.

11th: Op run now shows a slack north-easterly and possible snow.

13th: An anticyclone to the north of Scotland continues to keep things seasonal on the op run this morning. The average again benign.

14th: More interest on today’s midnight run. The op shows a cold pattern. Frost early and late and a high of 2 or 3C. A chance of flurries. Even the average looks less mild!

15th: The interest of yesterday has faded. Not terribly mild but not cold either. Xmas morning starting chilly, 6C with rain in the evening, a warm sector bring the temp up to 10C in the evening. The average suggests something similar.

17th: All change again on the op run today with an Atlantic ridge with plenty of cloud. High 7C Low 4C. Gloomy. The Average less settled…

18th: The op this morning suggests the 25th will be something of a changover from the present regime to something more settled. The op chart suggests a temperature of 9C day and night though perhaps the reality may see some frost late on in the day.

20th: It’s looking quiet and calm.

21st: quiet and calm.


You can find out what every Christmas Day in London was like weatherwise here.


The green lung of Wanstead

The tree canopy cover map on the Mayor of London’s website reveals just how blessed Wanstead’s inhabitants are in terms of clean air relative to the proximity of the City.

Those living closest to the junction of Wanstead Park Avenue and Northumberland Avenue benefit most from Wanstead Park, Wanstead Flats and Bushwood.

green lung

city green lung

November 2018: average and rather sunny

November was most notable for the amount of sunshine. Some 79 hours were recorded, that’s 135 per cent of average, the sunniest November for two years.

The mean temperature finished 8.4C, 0.4C above average, the mildest November for three years.

Some 72.5mm of rainfall was recorded, 122 per cent of the 1981-2010 average, the wettest November for two years.

To view full stats follow this link:http://1drv.ms/1kiTuzv

november 2018

London winter forecast 2018-19

Long range modelled forecasts have been all over the place of late and, looking at the underlying signals, it is easy to see why.

When I’ve produced these forecast in the past, in terms of QBO and ENSO data, there’s usually a lot of analogues to compare with. This year, however, seems to be an exception.

Considering QBO first I looked back over data to 1950 and found nothing similar for October. However, looking over the whole series the cyclical nature of this circulation may give some clue.

bestfit

Some 20 months were revealed, ranging from June 1959 to June 2015.  Using NOAA’s  Niño 3.4 region I narrowed this list down to the few that had an ENSO value of around +1 with a rising trend. With NOAA’s forecast of a Modoki El Nino (one that occurs in the central Pacific) this narrowed the list to just 1 period: June 2015. Considering maxima anomalies this would give the following winter.

winter 2018-19 max anomaly.PNG

The above would suggest there being a general cool down through December with a cold spell starting just before Christmas into the new year? And another cold spell end of January into the first week of February?

winter 2018-19 precip anomaly

The above precipitation anomaly chart would suggest a wetter than average December,  January and February, though February by much less so.

It’s been a very busy autumn so I’m keeping this short.

The below figures, particularly January and February, may be different in the event of an SSW occurring. In all then.

The mean:
December: +0.8C
January: -1.2C
February: -1.7C
Overall: -0.3C (broadly average)

Precipitation:
December: 158%
January: 155%
February: 120%
Overall: 134%