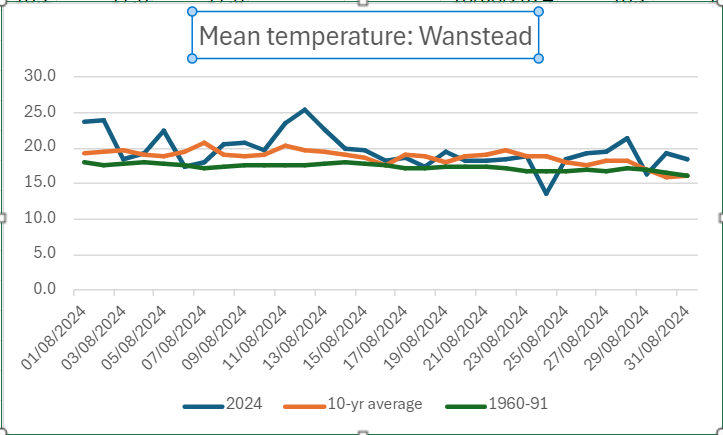
The mean for August in east London was 19.7C, 1.5C above the 1981-2010 average. It was the 11th warmest back to 1797.
Rainfall of 17.8mm was 35 per cent of average, the driest August for 8 years. It was the 22nd driest back to 1797.
Sunshine at 177 hours was 91 per cent of average. It was the 68th dullest back to 1881.
Thunder was heard once on the evening of the 1st but the core of the storm was south of the Thames with over 50mm at Godstone and New Addington.
A look at the mean temperature shows how much the climate has warmed since the period 1961-90. Though the mean last month was only 0.9C up on the previous 10 years it was actually 2.3C warmer than 1961-90.
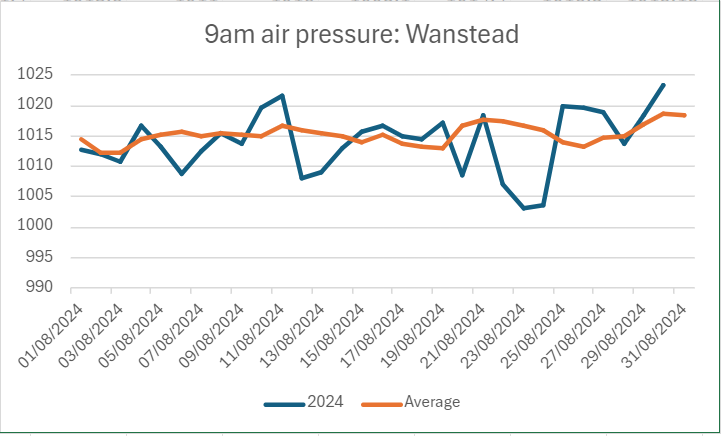
9am air pressure was largely below average with a pronounced dip on 24th bringing notably inclement weather for the time of year.
Here’s a few extremes for the month of September across the capital.
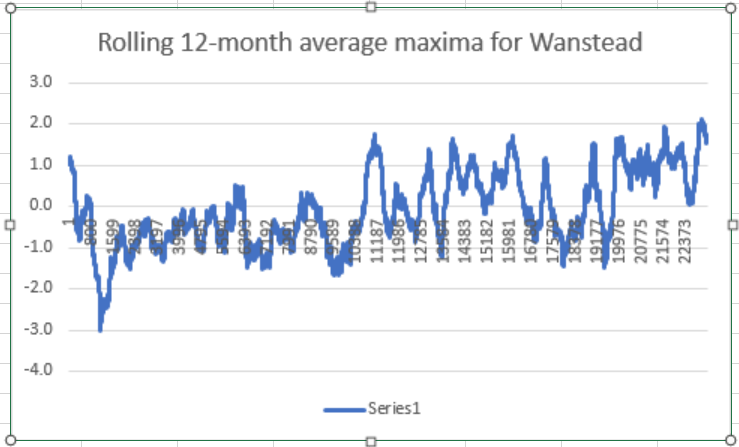
The rolling 12-month average maxima anomaly in Wanstead on June 10th is sitting at 1.6C.
Considering local statistics back to 1959 the figure reached an all-time high of 2.1C last November, a level it stayed until December 11th, when a very remarkable week of snow and frost arrived.
With unremarkable maxima for most of this year the figure has been falling. But with a building El Nino it remains to be seen if the highest anomaly ever of 2.1C will be breached.
The crux of the article is that certain weather types can repeat at the same time of year with one having a 100 per cent probability!
The Christmas storm singularity occurs in 84 per cent of years.
While 84 per cent certainly doesn’t mean ‘nailed on’, in the current set up of models being evenly spread between settled and stormy it can be safely guessed at this range that there will be unsettled weather around on the 25th. Whether it will affect the whole country remains uncertain.
The last big snorter of a Christmas storm I can remember in London was 2013. The entry for the 23rd into the 24th reads.
“Cloudy and breezy start grew steadily duller with rain just before noon. Rain grew heavier with some really strong gusts into evening culminating at 2am. Cloud at one point was 10kms thick. Three deaths related to weather.”
There was chaos nationwide with flooding and power cuts.
This winter is most likely to be on the colder side of average with near normal rainfall.
While the modelled prognosis for the first half of December looks unsettled with an Atlantic influence evolving from the current chilly NW’ly to a mild SW’ly, local analogues of the climate of London suggest the season could be a bit of a rollercoaster with spells of wet, windy and mild weather alternating with dry, calm and cold.
A large factor to consider this winter is the presence of a slight La Nina that is forecast to evolve cooler.
Given the uncertainties involved with the influence of ENSO I’ve decided to stick with analogues found in local data that stretches back to 1797.
Overall then the probabilities for the next 90 days are.
Mean
Probability
Rainfall
Probability
Mild (>5.9C)
14%
Wet (>178mm)
19%
Average (5.1C – 5.9C)
38%
Average (107-177mm)
62%
Cold (<5.1C)
48%
Dry (>107mm)
19%
The above table doesn’t reveal a great deal in that extremes can be hidden in a month or season that finishes broadly average. So I decided to look closer at the winters that were revealed in the analogues.
December
The first month, as already mentioned, looks like it will be on the mild side with possibly a notable storm off the Atlantic before things calm down over Christmas – the period between Boxing Day and New Year’s Eve possibly presenting the best chance of any lying snow in this region.
The below graphs are a smoothed representation of the years revealed in the analogues most similar to this autumn.
What is probably most interesting is that the analogues that shared a similar ENSO / La Nina index to this autumn tended to ‘turbo charge’ any yo-yoing in the weather type, be that super-mild or abnormal cold.
December probabilties for maxima: Mild: 48% Average: 19% Cold: 33%
And precipitation. Wet: 33% Average: 29% Dry: 38%
So, the month overall will be mild and slightly dry
January
The first month of 2022 probably represents this region’s best chance of lying snow this winter. A mild start perhaps with a falling off of temperatures in the final third of the month and a cold spell of a week or so. As with December the influence of La Nina could tend to boost the swings in the pattern.
January probabilties for maxima: Mild: 33% Average: 10% Cold: 57%
And precipitation. Wet: 19% Average: 43% Dry: 38%
Greatest chances for January, then, are cold with average precipitation.
February
The second month may see a slight return of the cold spell in January before temperatures recover for a mild and wet spell in the second half.
February probabilities for maxima. Mild: 33% Average: 15% Cold: 52%
And precipitation. Wet: 38% Average: 38% Dry: 24%
The stats suggest on the cold side overall with average to above average rainfall. Perhaps the depth of the cold skewing any very mild second half of the month?
The extremes that no-one can forecast
As well as the very mild winter of 1989/90 the analogues also revealed the very cold winter of 1978/79. There were others but their occurence makes the probability of a repeat at either extreme at less than 10 per cent.
Compiling a list of sunless, rainy days revealed some interesting spells of wet weather – the most miserable runs of June days in the capital since 1959.
First up was a three-day spell starting on June 25, 1974. Some 34.3mm of rain was recorded.
Next was a three-day spell starting on June 23, 1991. Some 26.3mm of rain was recorded.
Another three-day spell started on June 25, 1997. Some 36.2mm of rain was recorded.
Finally, and most recently, a two-day spell this month that began on June 17th. Some 28mm of rain was recorded.
The above spells all happened around the date of the ‘June monsoon’ singularity which has a probability of 77 per cent. Though the fact that these occurred 47 years, 30 years and 24 years ago shows that these extreme cases happen a lot less than three years in every four the singularity would suggest.
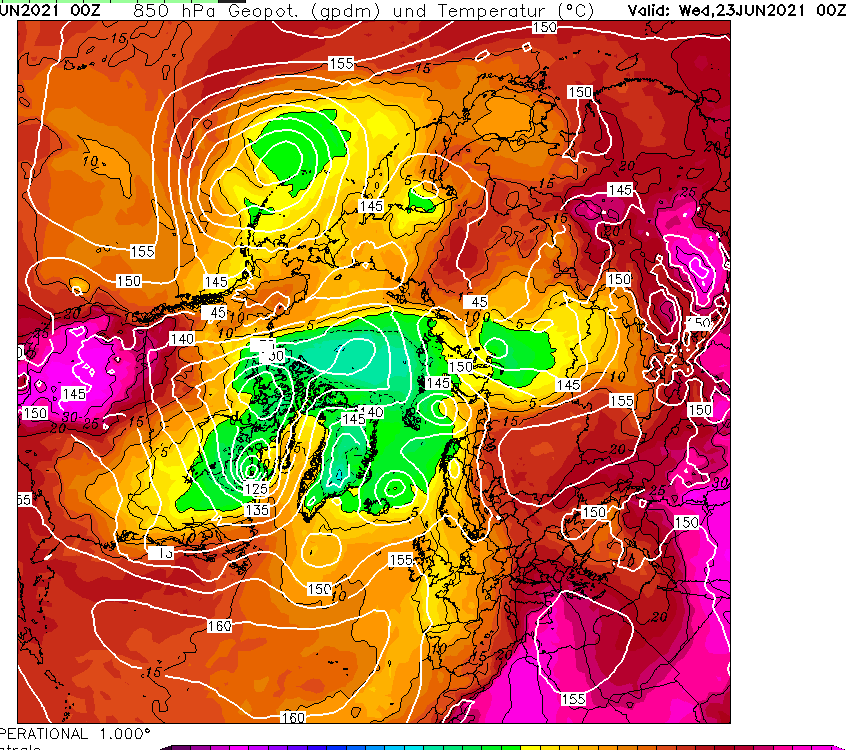
Comparing the current Northern Hemisphere pattern with 1974 suggests that while there’s just as much heat around at 850mb as there was 47 years ago, including an extreme heatwave over some Nordic countries, the air above Greenland appears colder.
The weather of late has been in stark contrast to the mostly dry, sunny (if a bit chilly) spring many enjoyed. Indeed the first half of June saw more of the same and, locally, was the warmest start to the first meteorological summer month since at least 1959.
My memory of summers years ago was that it was often hot and sunny but I also remember countless days of staring out the window for hours waiting for relentless rain to let up.
Looking back at sunshine stats to 1959 there has been over 4,400 days where no sun was recorded, roughly a one in five chance of a totally cloudy day.
Considering the months where the absence of sun is most noticed, May to October inclusive, the probability decreases to just under one in ten.
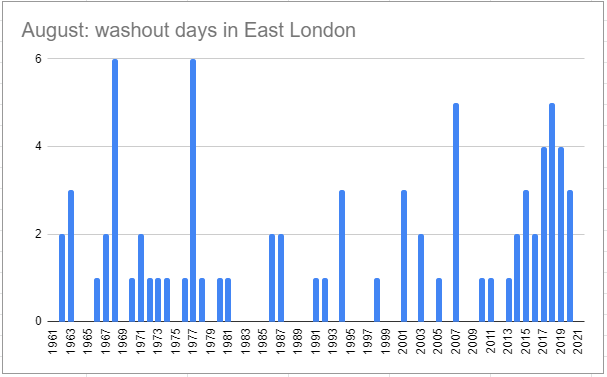
To decant these to ‘washout days’ I’ve only included those sunless days that were also ‘wet days’ where 1mm or more of rain was recorded. The probability further decreases to just under one in twenty.
All very interesting but were there more washout days decades ago or is the memory playing tricks?
Looking overall shows an increase since 2013. Out of all the months the most notable change has been August.
Spring in this neck of the woods was really mixed.
A chilly start to March became fairly benign before ending with the warmest March day locally since at least 1959.
April then turned much colder and drier; just 2.4mm of rain fell during the month – the driest April since 2007 and fourth driest in a local rainfall series back to 1797! Sunshine was abundant with over 200 hours. But clear skies at that time of year, with a polar continental airmass, often means air frost. And the ten recorded overnight was far higher than normal.
May saw things warm up slightly but the month still finished a degree colder than average. Some 80mm of rain fell which is over one and a half times what we’d normally expect. The wettest May since 2007 – the month playing catch up on the total absence of April showers that bring the spring flowers! It was a dull month with only 126 hours of sunshine, 69 per cent of average – the dullest since 1990 was third dullest back to 1881.
In terms of flora and fauna the colder weather played havoc with the trees, bud burst coming much later than recent years. As I write this on June 6th some of the later budders like false acacia have only just come into full leaf. The birds, as they normally do, just seem to get on with it raising their young. I’m not sure what the food supply has been like but judging by the amount of healthy juvenile fledglings I’ve seen I would guess that it has been a good season so far?
Here’s the stats. March 8C (+0.3) 30.9mm (76%) 90.9 hours (84%)24.1C on 30th (a record that had stood since 1965) April 7.2C (-2.6) 2.4mm (5.5%) 202.6 hours (127%) 10 air frosts in April, much higher than normal May 12.1 (-1) 80mm (156%) 125.6hours (69%) Spring 2021: Mean : 9.1C (1.1C below average, coldest since 2013, 111th coldest) Rain : 113mm (84% of average, wettest since 2018, 150th wettest ) Sun : 425.4 hrs (94% of average, dullest for three years. 51st dullest) The average masked extremes.
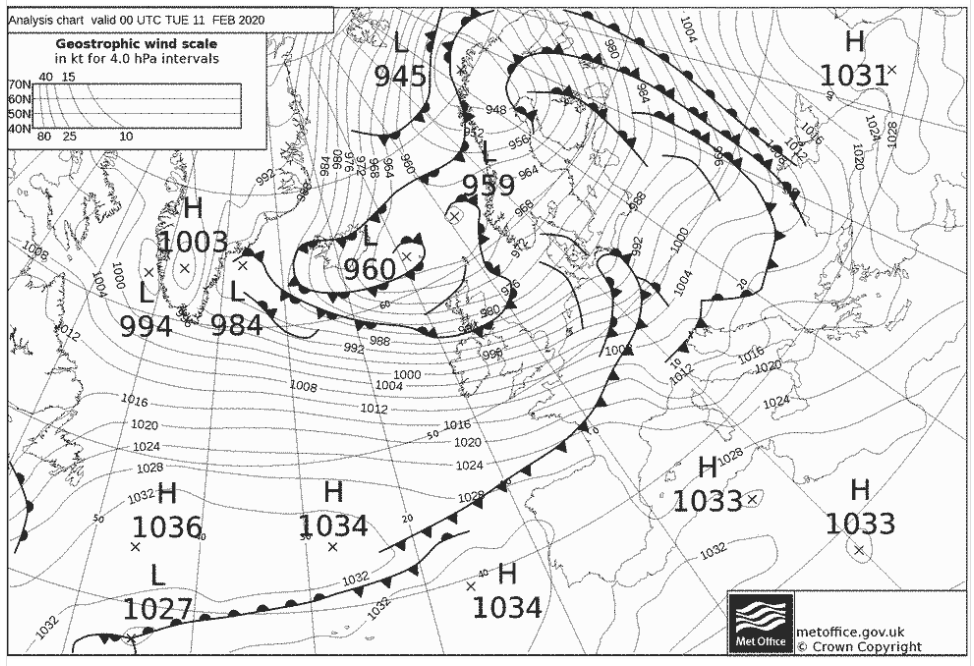
Damage from Storm Ciara was a lot less notable than further north though the relentless wind saw three records broken locally. Though the gusts were nothing like the St Jude storm in October 2013 the sustained wind blew at its greatest 1, 2 and 3-day rate since this particular automatic station was reset in November 2012.
Over the 3 days the wind direction was locked in a south-westerly, from 199 to 203 degrees.
The December monthly mean finished 6.3C, that’s 0.7C above average, making it the ninth month of 2019 where the monthly mean temperature finished above average.
The wet theme of October and November carried on into December; the 111.1mm collected was 209 per cent of the 1981-2010 average, the wettest since 2002.
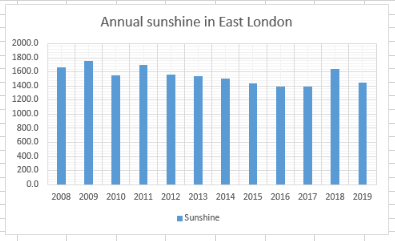
Some 51hrs of sunshine were recorded, 126 per cent of average, the sunniest for three years.


 : 9.1C (1.1C below average, coldest since 2013, 111th coldest) Rain
  : 113mm (84% of average, wettest since 2018, 150th wettest ) Sun
  : 425.4 hrs (94% of average, dullest for three years. 51st dullest) The average masked extremes.


You must be logged in to post a comment.