Super El Niño = another mild winter on the way for the UK?

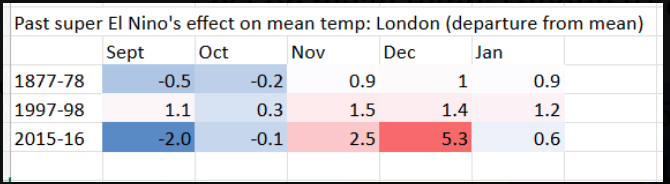
The Oceanic Niño Index (ONI) jumped 0.4 points, from +1.4 to 1.8, in July, the greatest total in a rising El Nino since that particular index began in 1950.

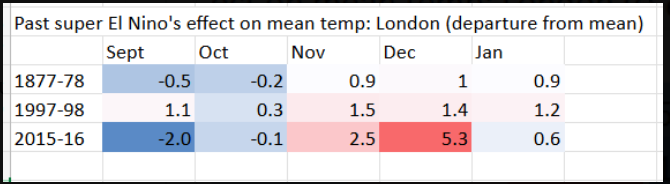
While the effect of ENSO is possibly very little in our latitude a look back at previous events, I think, can provide some guidance about what we might expect later in the year.

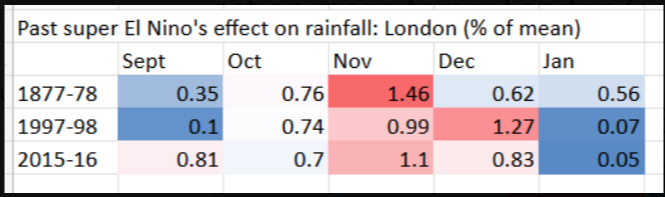
The best fit in terms of where we are now and where we were in past Super El Niños is 1997 – though I would guess we’re about a month ahead of that period. Like 1997 the current hurricane season is well below average.

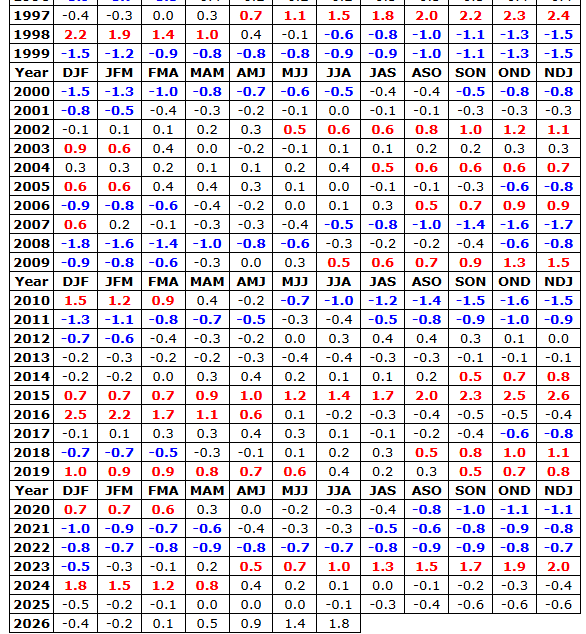
So, with that in mind, the following table can be drawn.

In terms of months it would give:
October: +1C anomaly and very dry.
November: average and on the dry side
December: +1.5C with average rain
January: +1.3C with above average rain
February: +1.2C and very dry.

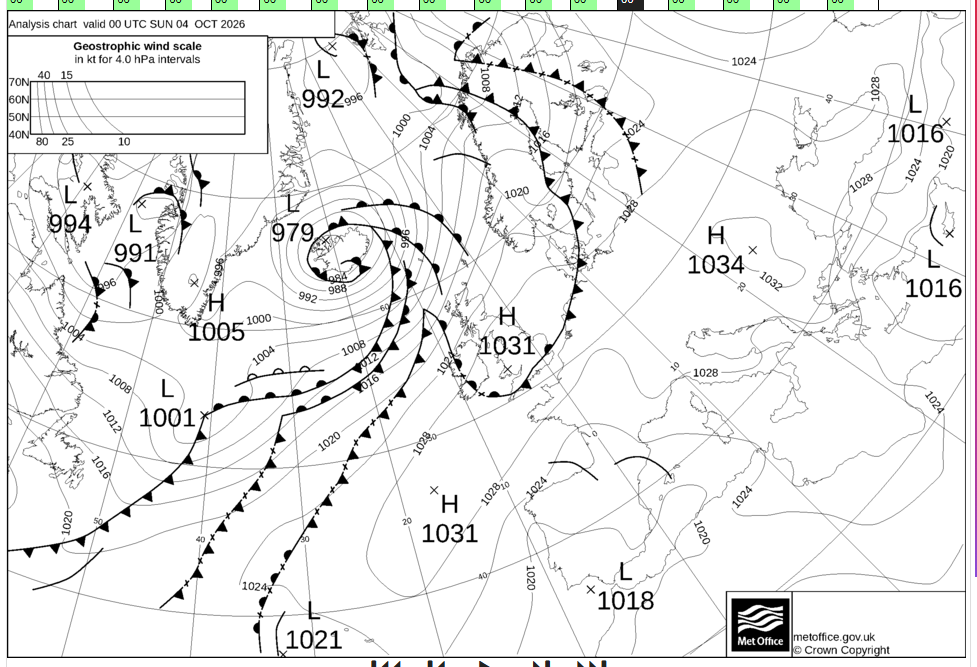
Broadly, I would expect a very stubborn Azores High to form bringing mild and mostly dry weather the further SE you are in the UK. Obviously this would bring higher risk of Atlantic storms barreling across the Atlantic with heavy rain across northern Scotland.
Any repeat of February 1998 would hail a very early spring and a record early +20C?

As anyone knows you cannot completely write off the chance of snow. One bonus for anyone looking for snowfall may be the persistence of warmth down the US Eastern Seaboard, conditions which tend to favour a quieter jetstream and, hence, fewer storms moving across the Atlantic.

Want the climate of the Eighties? Move 275 miles north

The mean temperature for July so far in Wanstead stands at 22.2°C, that’s 4.6°C above the 1961-90 average.

Far too hot for many it would seem. And, with many regions in England now officially under drought conditions, far too dry.

So where has the climate of my childhood got to?

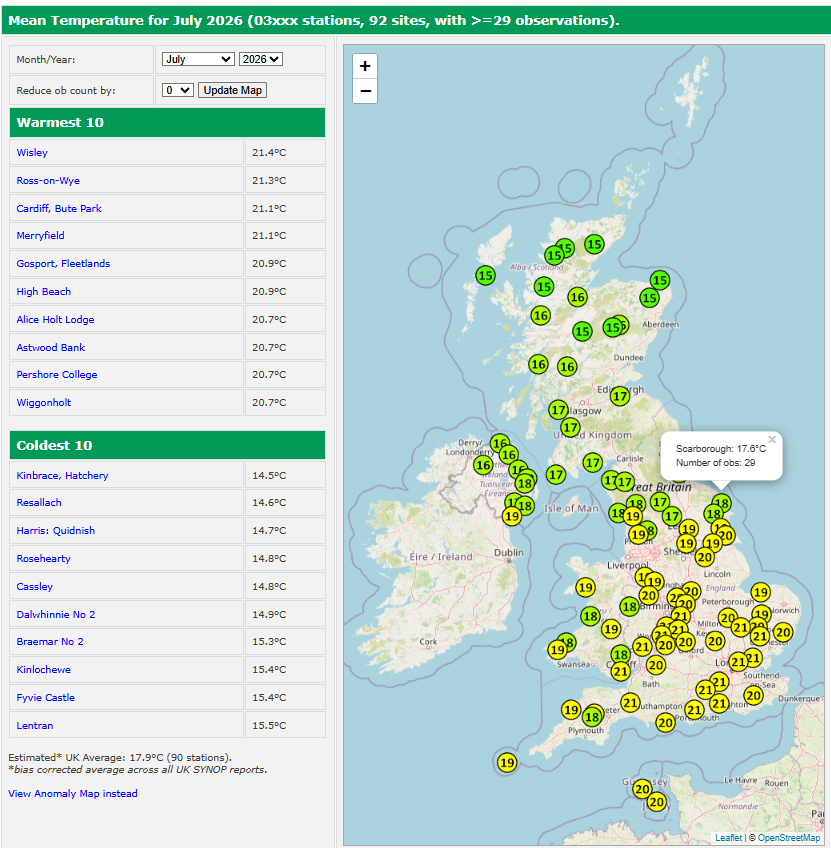
A look on the excellent RoostWeather site shows that a mean temperature of 17.6°C this July lies somewhere between Scarborough and Edinburgh.

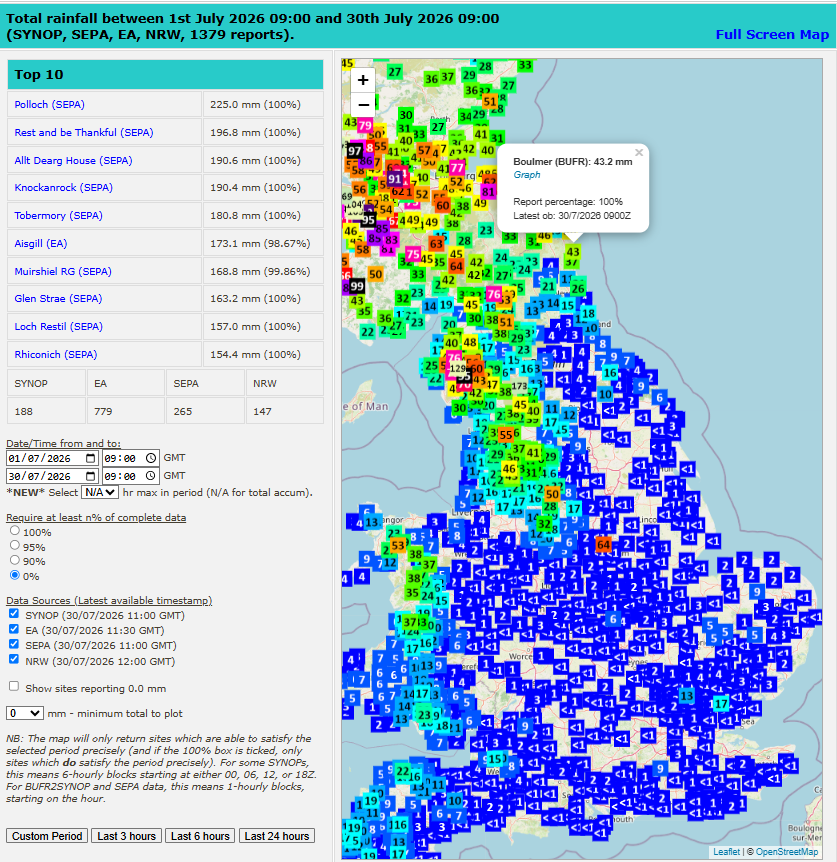
But, with just 6mm of rain all month, that’s far too dry. You need to move another 93 miles north to find somewhere with over 40mm of rainfall, the average amount during a July in 1961-90.

Which takes us up to somewhere between Boulmer and Alnwick.

Another day, another June record (again)

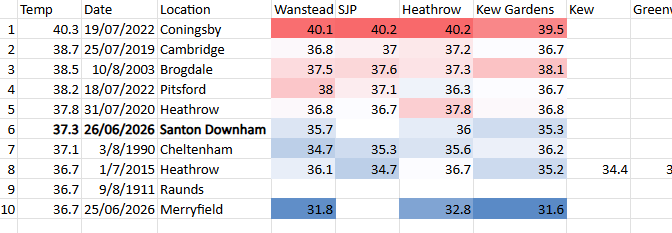
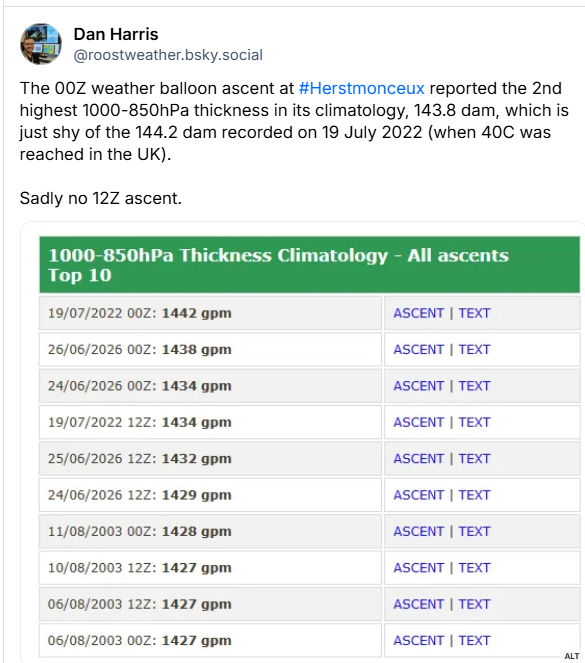
The temperature of 37.3°C recorded at Santon Downham, Suffolk, represents a new June maximum record for the UK just a day after a new record of 36.7°C was recorded at Merryfield, Somerset,

It is also now the 6th hottest day ever recorded, beating the 1990 record set at Cheltenham.

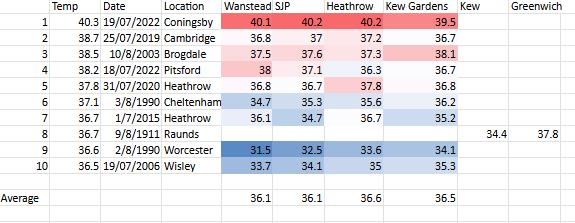
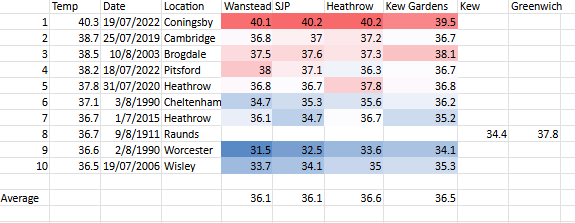
The top 10 list below shows the day. Kew Gardens was 2°C cooler – more in keeping with heat records.

The previous day was different in that Merryfield, a site 119 miles SW of Kew Gardens, was some 5.1C hotter than Kew which recorded just 31.6C!

Kew Gardens, and other London stations, are usually no more than around 2C cooler than where records are set.

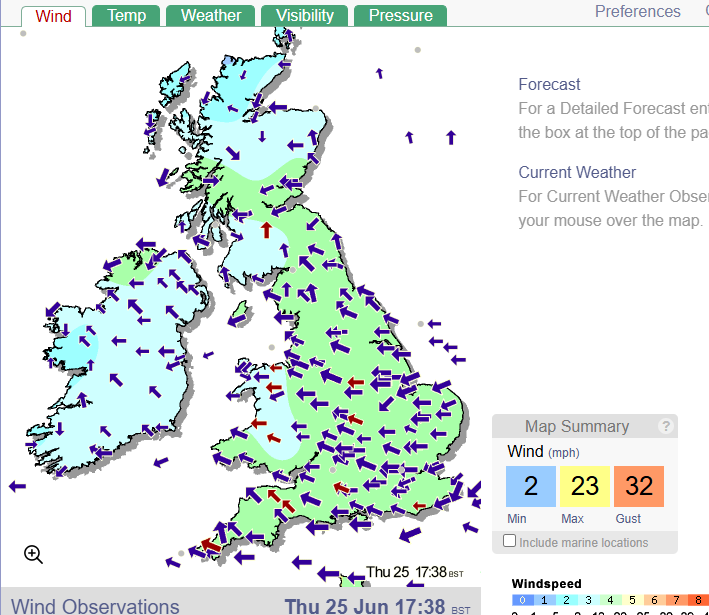
It would seem that the strong easterly breeze helped keep a lid on the temperature in the east of the UK on Thursday.

Wanstead and the UK’s top 10 hottest days

Britain’s capital is often the location of the UK’s hottest weather but a look back to 1911 shows it is often elsewhere the mercury is highest.

The highest temperature record has been broken three times in my lifetime. Before the first occasion in August 1990 you’d often see press articles speculating: “Will the UK ever break 100 Fahrenheit?

Polo advert for the heatwave that coincided with the Queen Mother’s 90th birthday in 1990

Though 100F was recorded at Greenwich in August 1911 the station’s use of a Glaisher stand (an instrument that depends on the observer turning it away from direct sunlight throughout the day) the record was deemed unsafe and a temperature of 36.7C at Raunds, Northants, was established as the new record.

The record stood for nearly 80 years before it was eclipsed, 37.1C being measured at Chelteham.

Thirteen years later the record was broken again, this time Brogdale, near Faversham, registering 38.5C.

Sixteen years on Cambridge became the UK’s hottest place, recording 38.7C. Just three years later the UK recorded >40C for the first time, a record of 40.3C at Coningsby, Lincs.

The table below shows how Wanstead and stations around London faired on each day.

Of note is how much cooler this area is when the core of the heat is at Wisley. The 10th hottest day on July 19th 2006 saw 36.5C recorded at the RHS garden, but Wanstead was nearly 3C cooler.

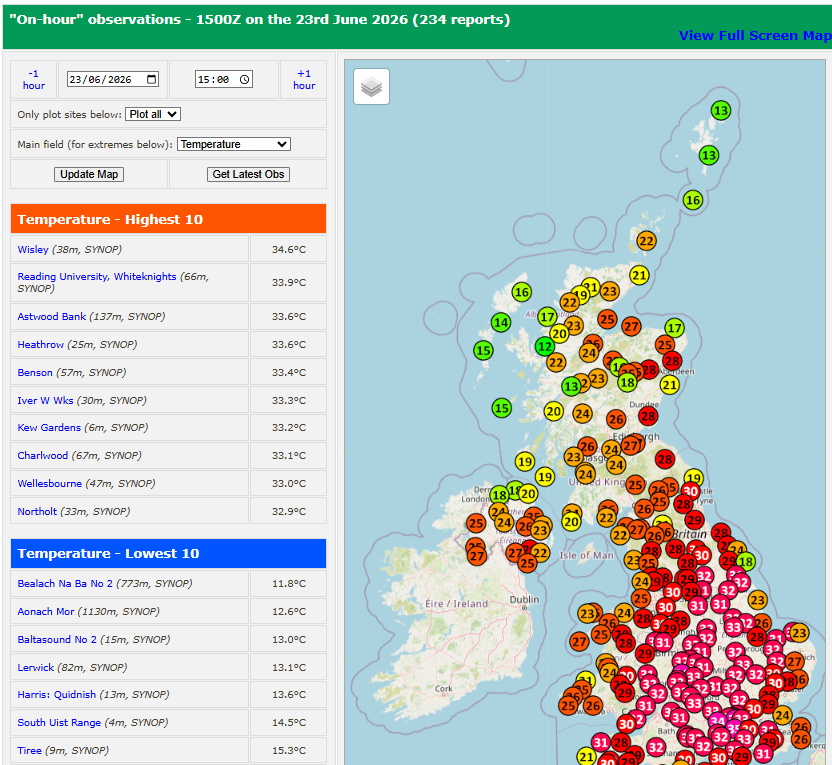
Today (23/06/2026) Wisley recorded 34.6C yet Wanstead, at 31.9C, was again nearly 3C cooler.

Hours of thunder on June 23, 2026

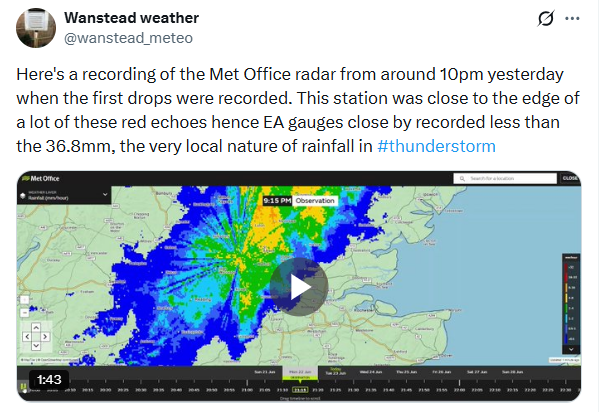
I noticed the first drops of rain from this event riding back over Wanstead Flats from the Holly Tree around 10pm, thoughts of Messi’s majesty in Argentina’s win against Austria fast being replaced by watching clouds bubbling overhead.

Reaching home the drops didn’t come to much and I wondered if the action would miss us, like so many damp squibs in the past.

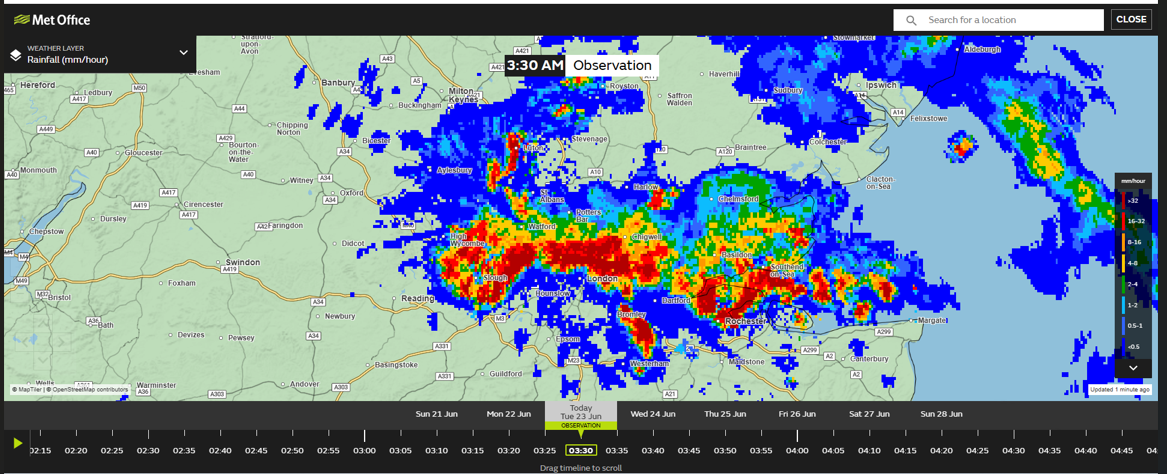
Nevertheless, I closed the roof windows and sure enough the first heavy rain arrived at 0130. And rumbled on and off for another four hours. It reminded me of the overnight storms that were so common in the 1980s.

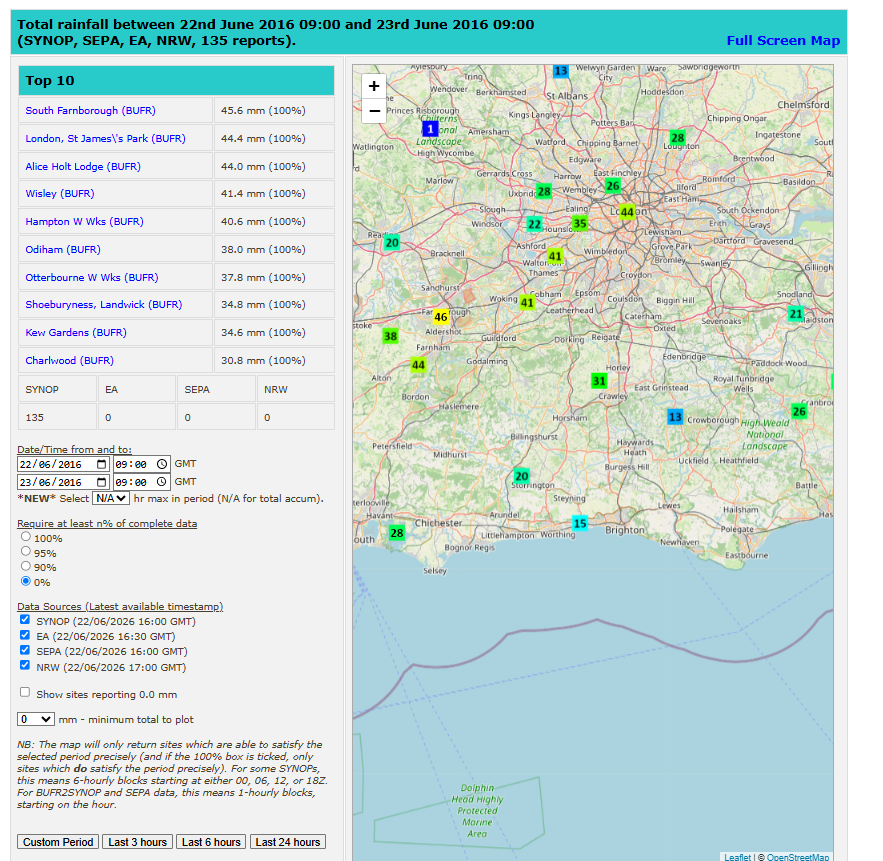
Some 36.8mm fell, the greatest June downpour at this station for 10 years. This month’s rainfall total now stands at 93mm, 181% of average, the wettest June for 10 years and 7th wettest back to 1960.

It feels strange that the storm happened 10 years almost to the minute of the Brexit deluge of 2016.

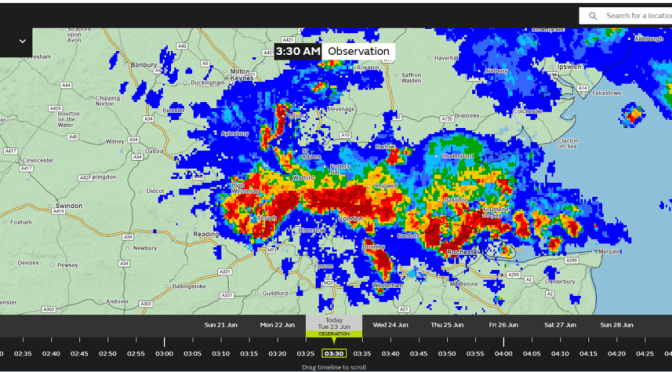
Radar from the storm can be found at this link.

The Brexit deluge, 10 years on

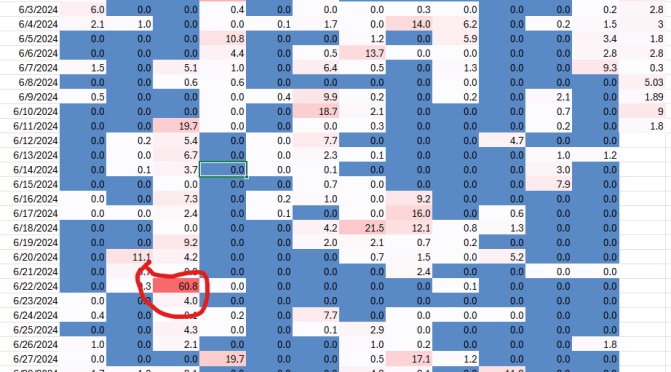
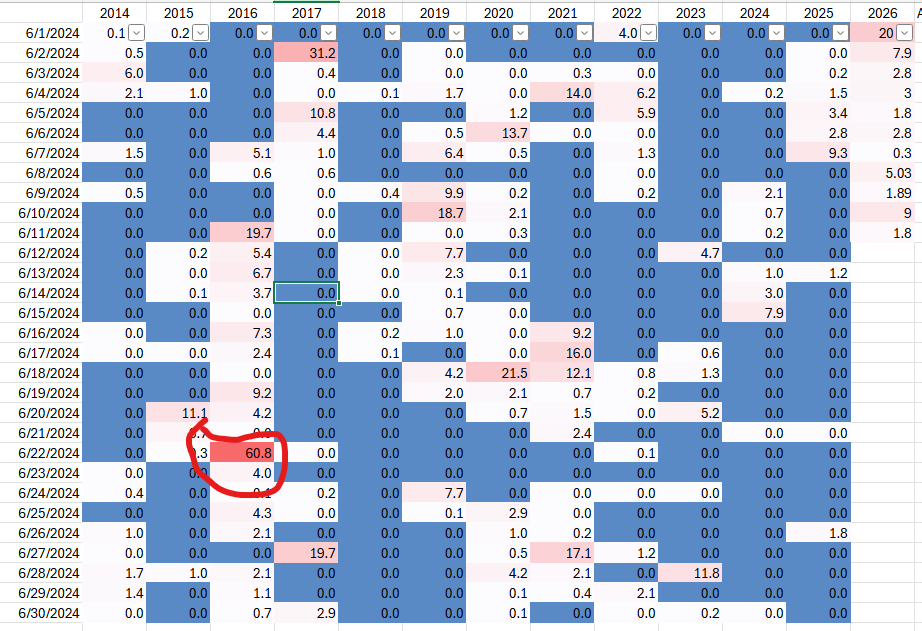
It’s 10 years tonight that this station recorded over 60mm of rain in 24 hours.

It remains the largest daily fall at this station since records began in 1960.

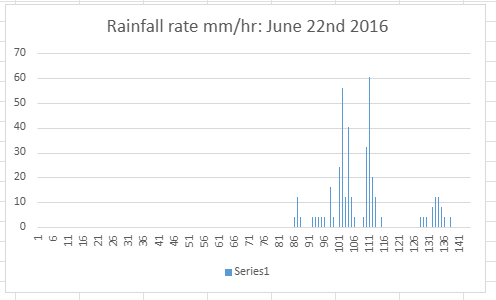
Rainfall rates touched over 60mm/hr during the early hours of June 23rd.

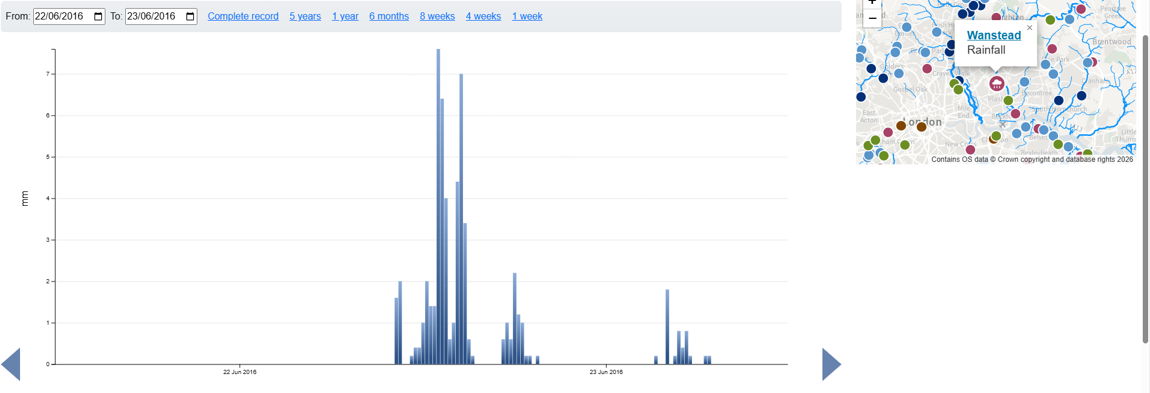
The closest station at the waterworks at Redbridge Roundabout recorded a similar amount.

The next closest official station, St James’s Park, recorded only 46mm, illustrating how varied rainfall can be over a small area.

The rainfall during the event was around three times heavier than the deluge on June 2nd.

The magic 500m snow line

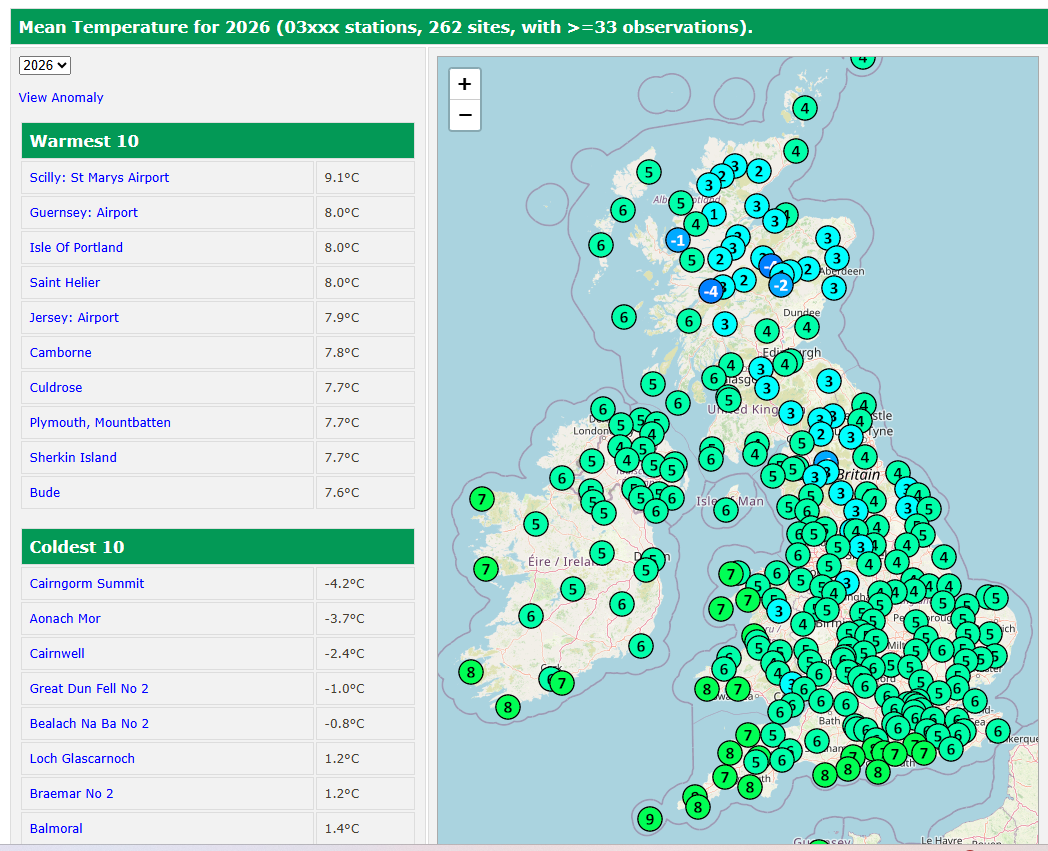
This winter since the turn of the year has been remarkably snowy for locations above 500m. Which, in the UK, means few of us would have noticed.

A pattern of predominant SE’ly winds feels like it has been locked in for weeks and has brought endless rain to many parts of the country. And much snowfall, particularly above 500m.

The Scottish Highlands have been the main beneficiary. And, looking at data on the RoostWeather site, there has been quite a sharp gradient in the decrease of mean temperature. Epic snow drifts on NW facing slopes have resulted in large avalanches. One frequent visitor to the Cairngorms said it is the deepest snow he has seen in 60 years.

A look at the map below reveals thus.

SummitHeightMean
Cairngorm1244m-4.2C
Cairnwell933m-2.4C
622m-0.6C
518m0C

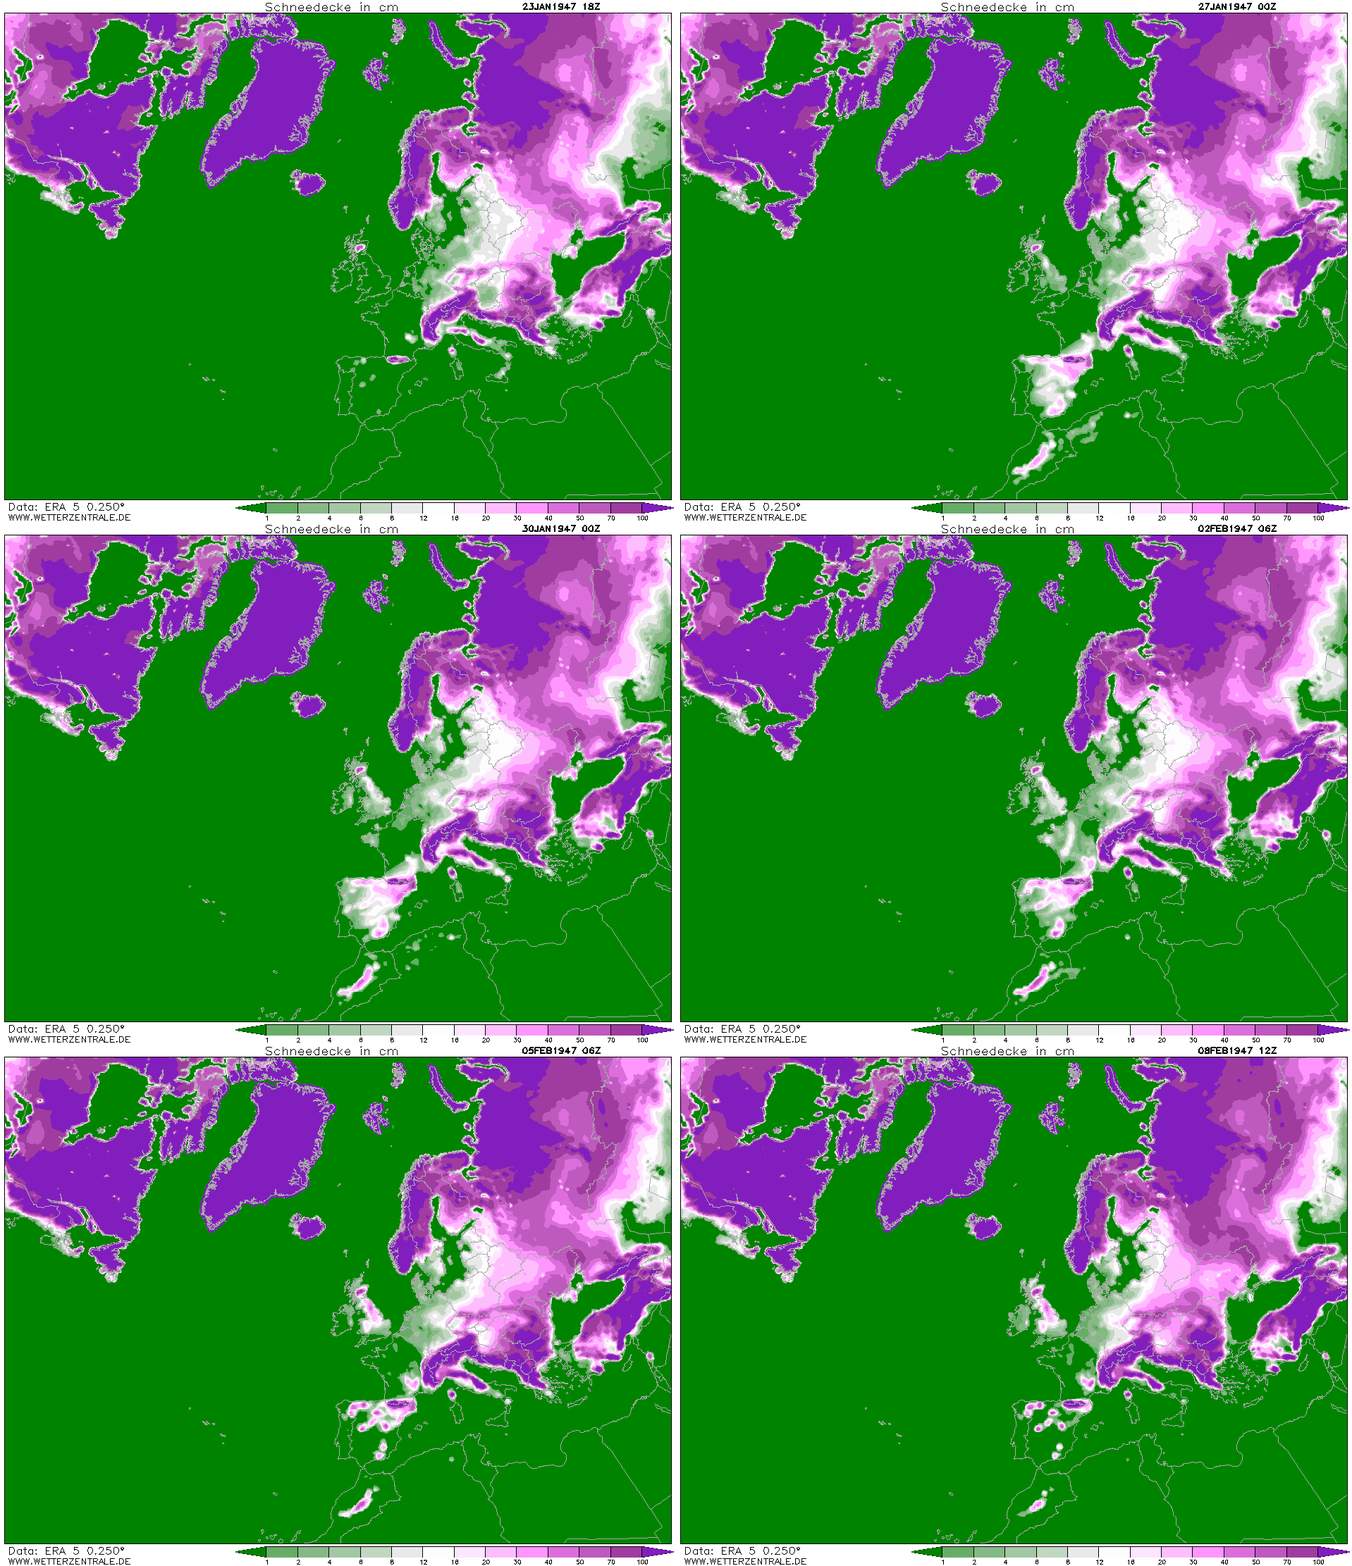
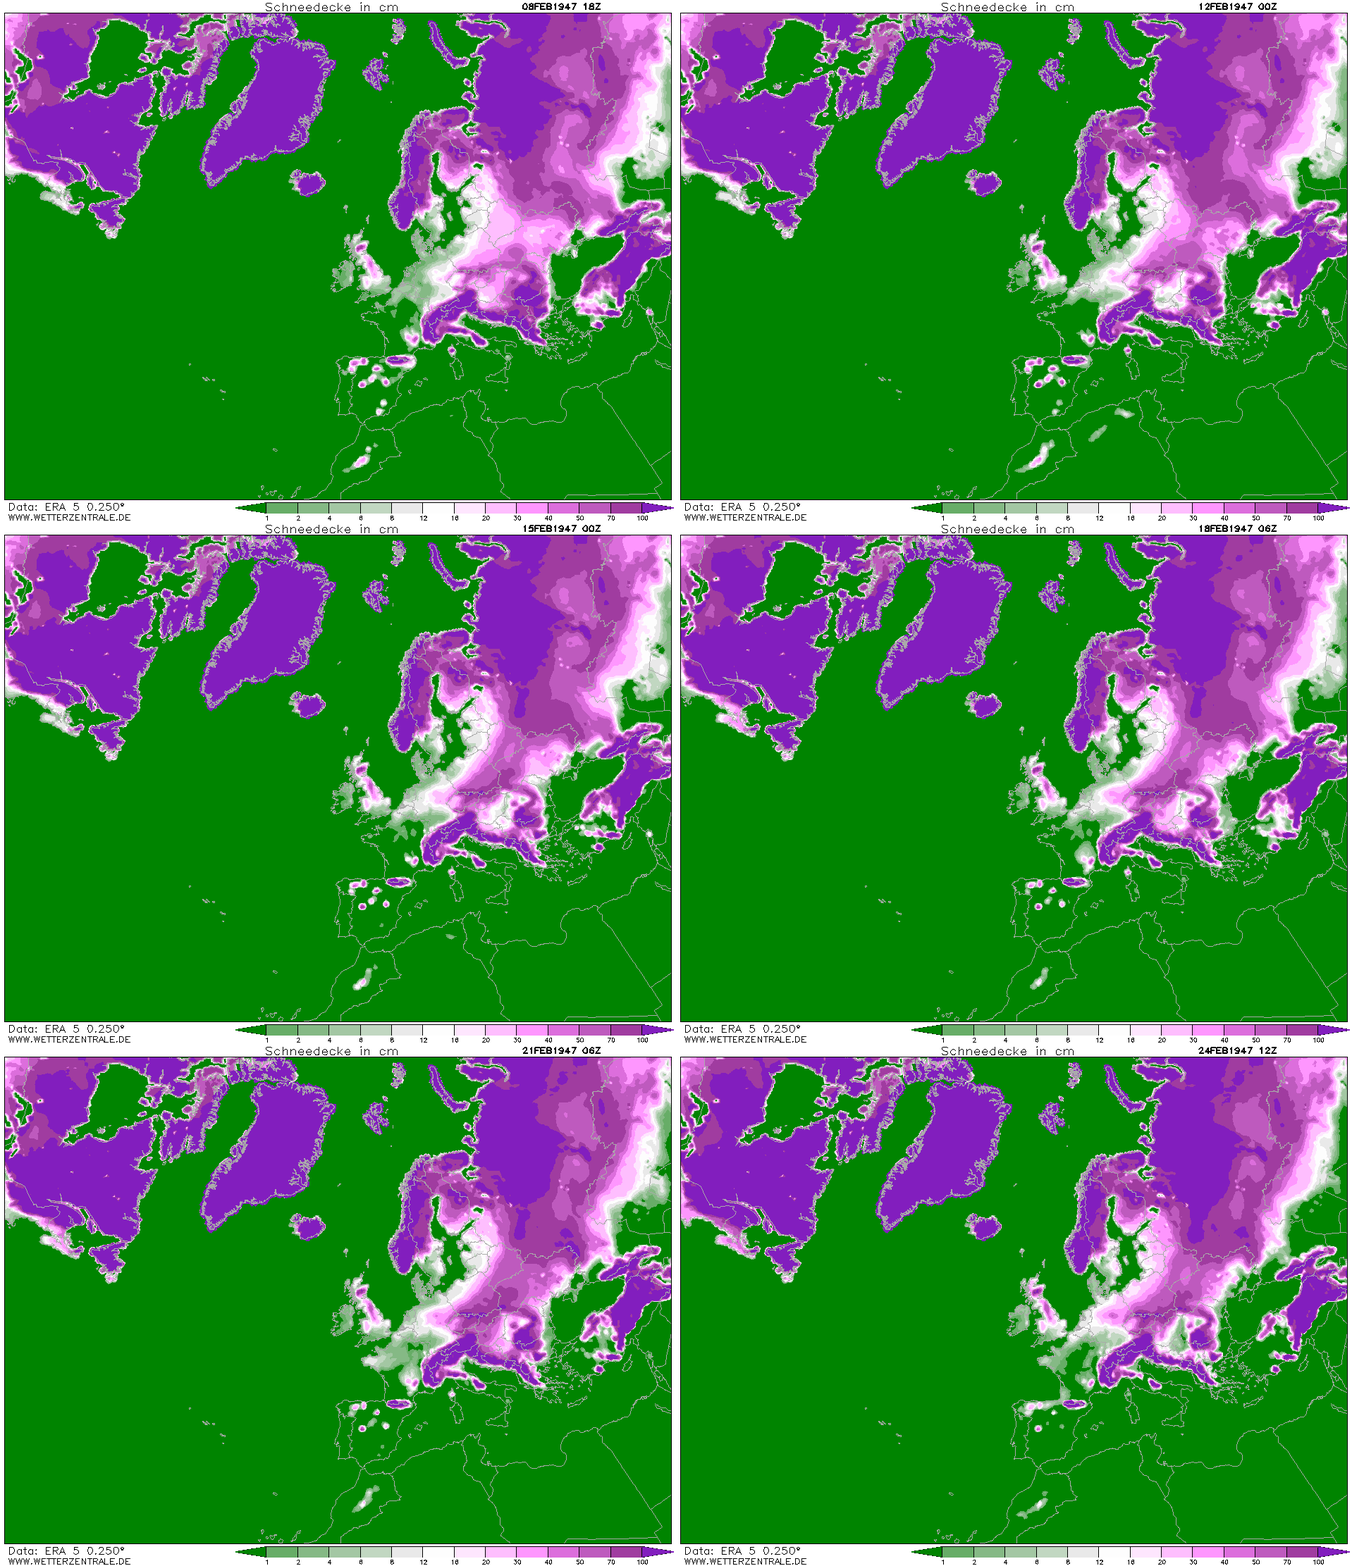
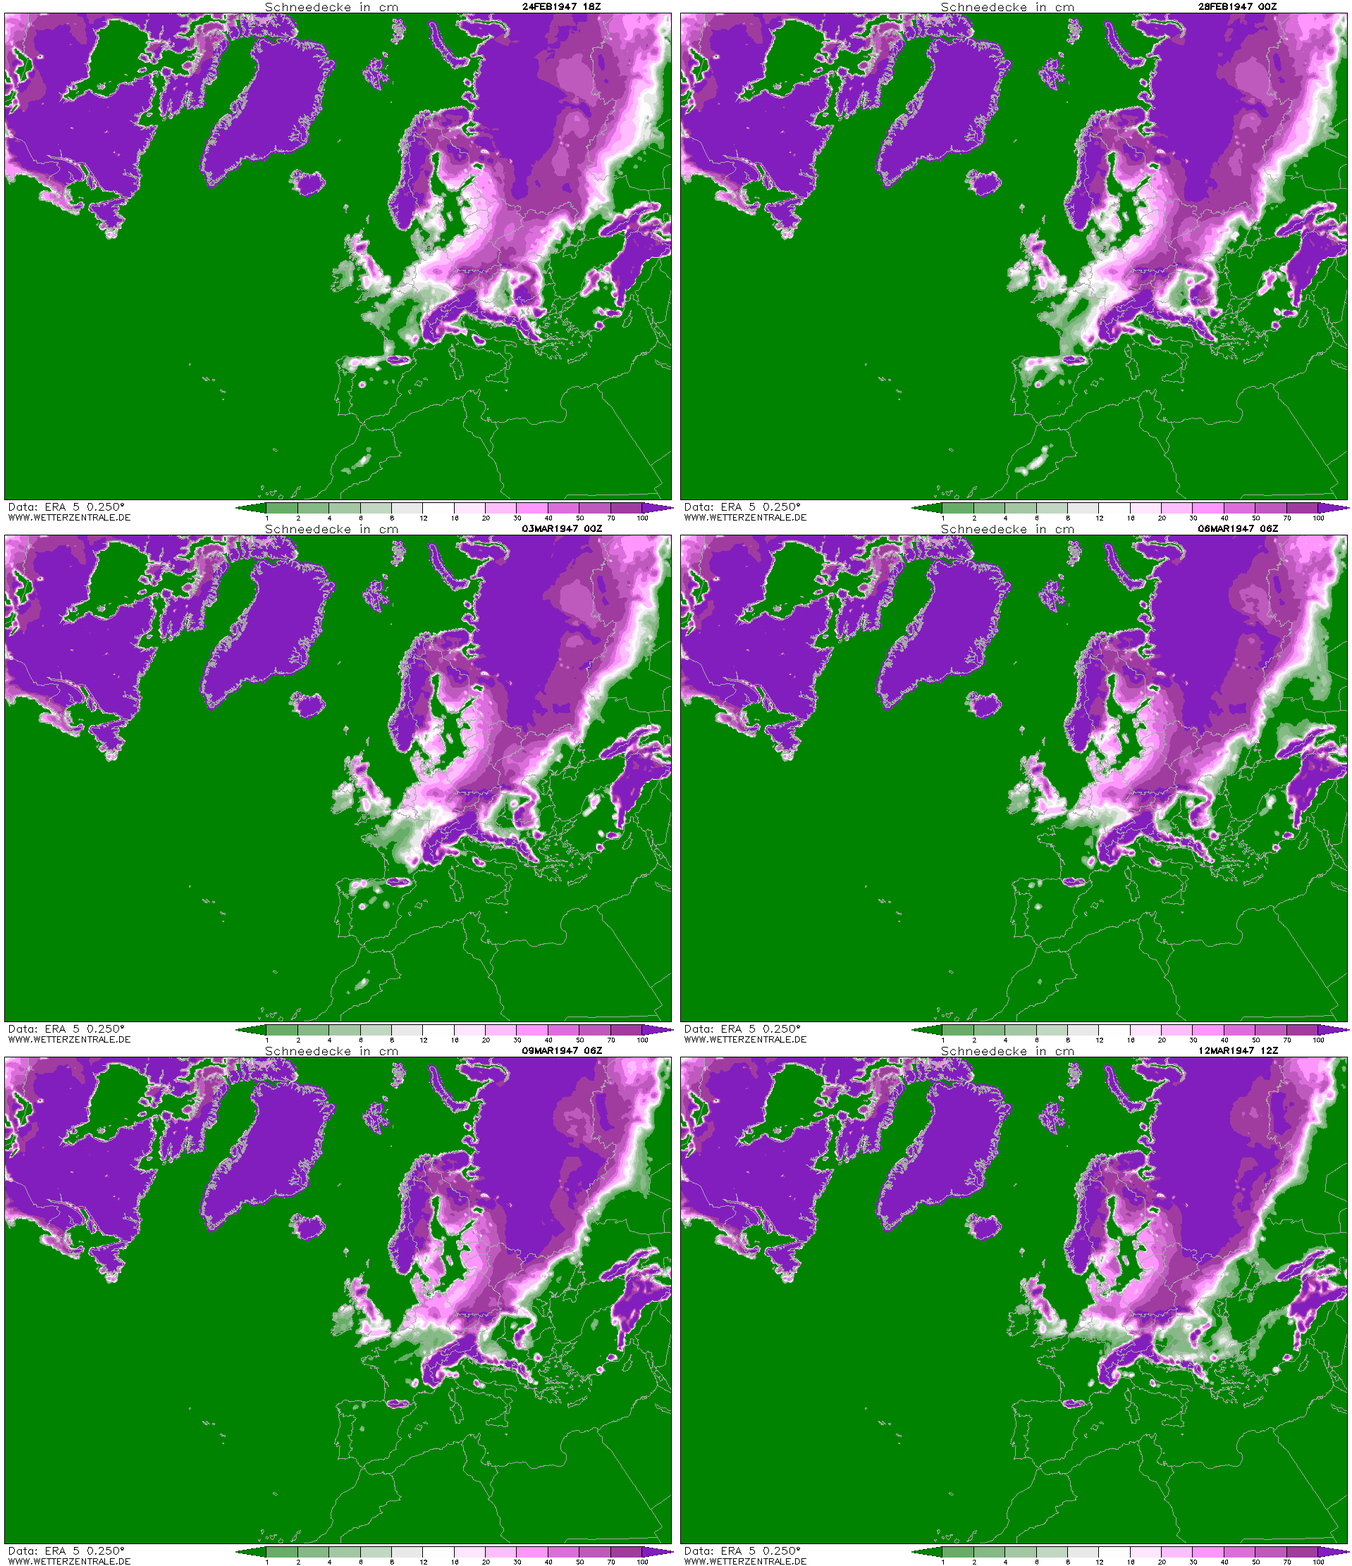
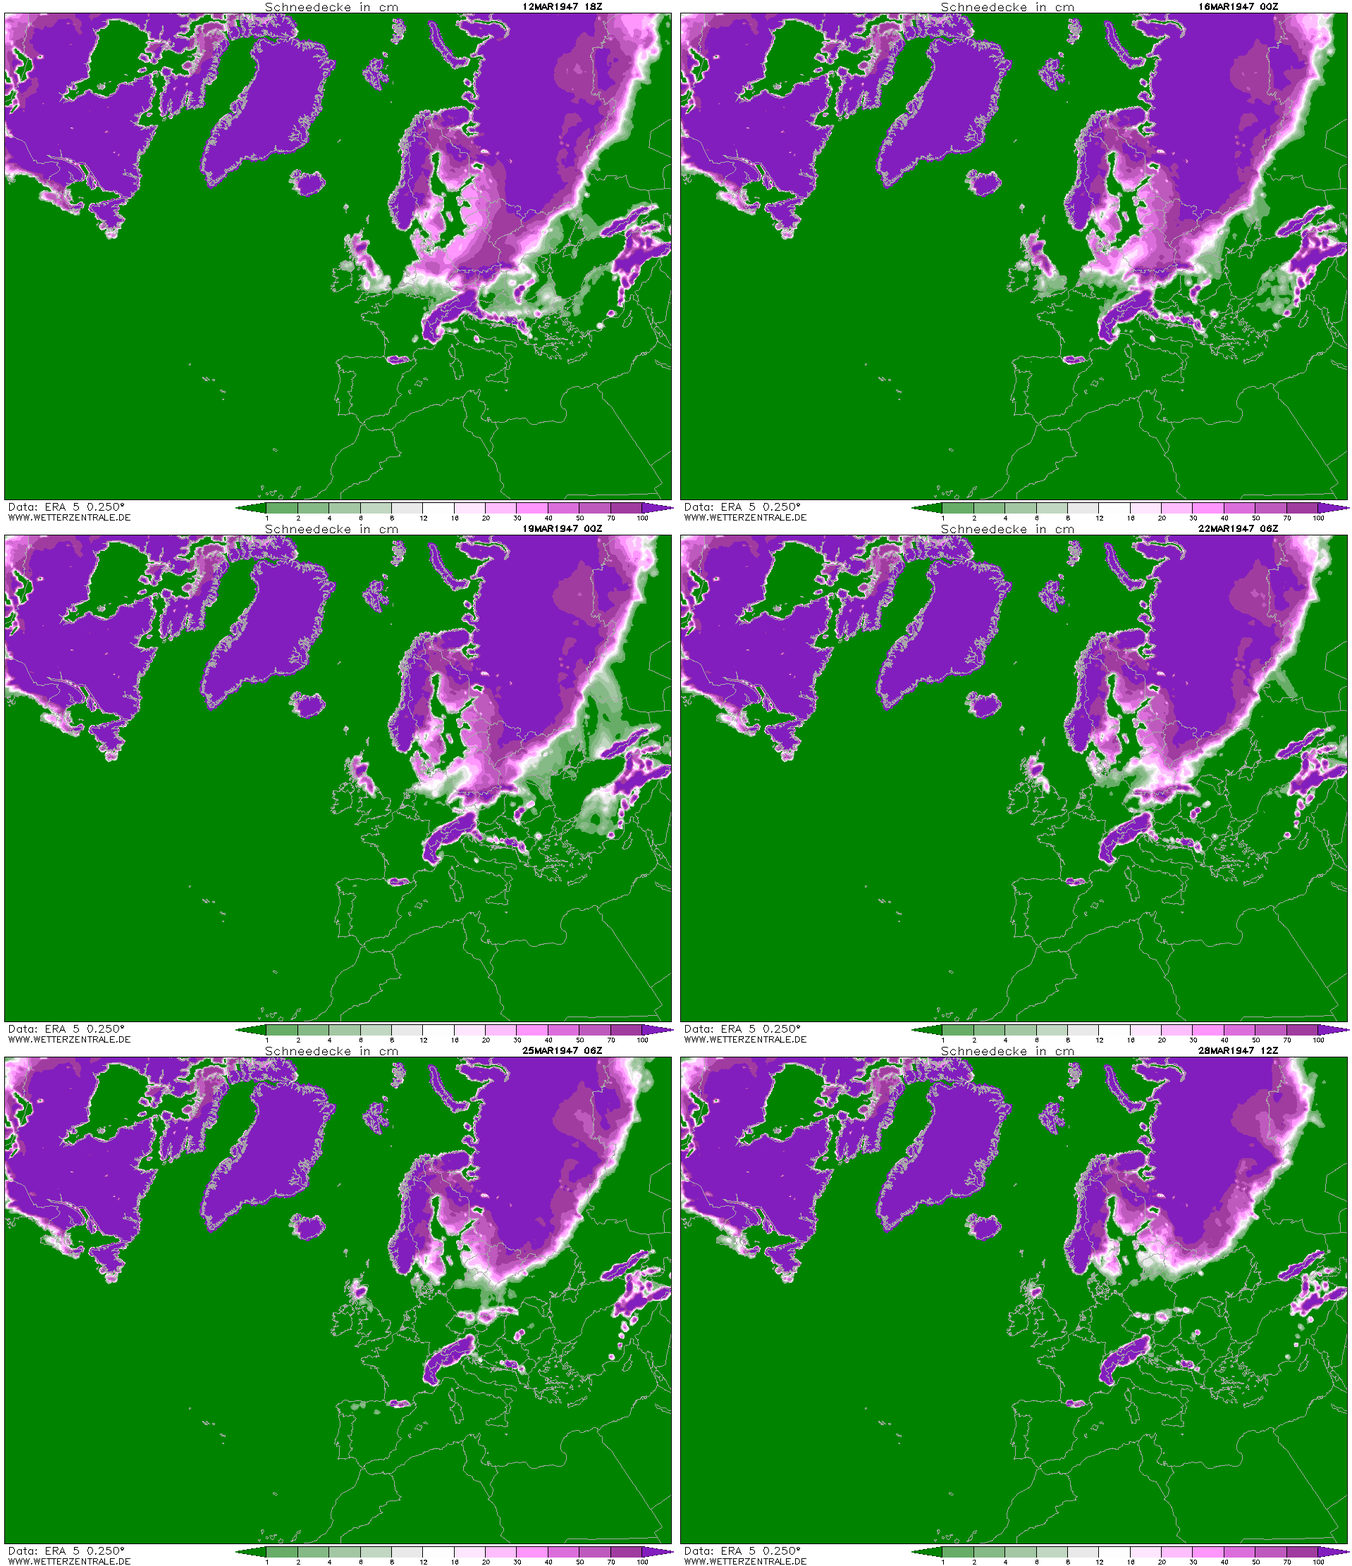
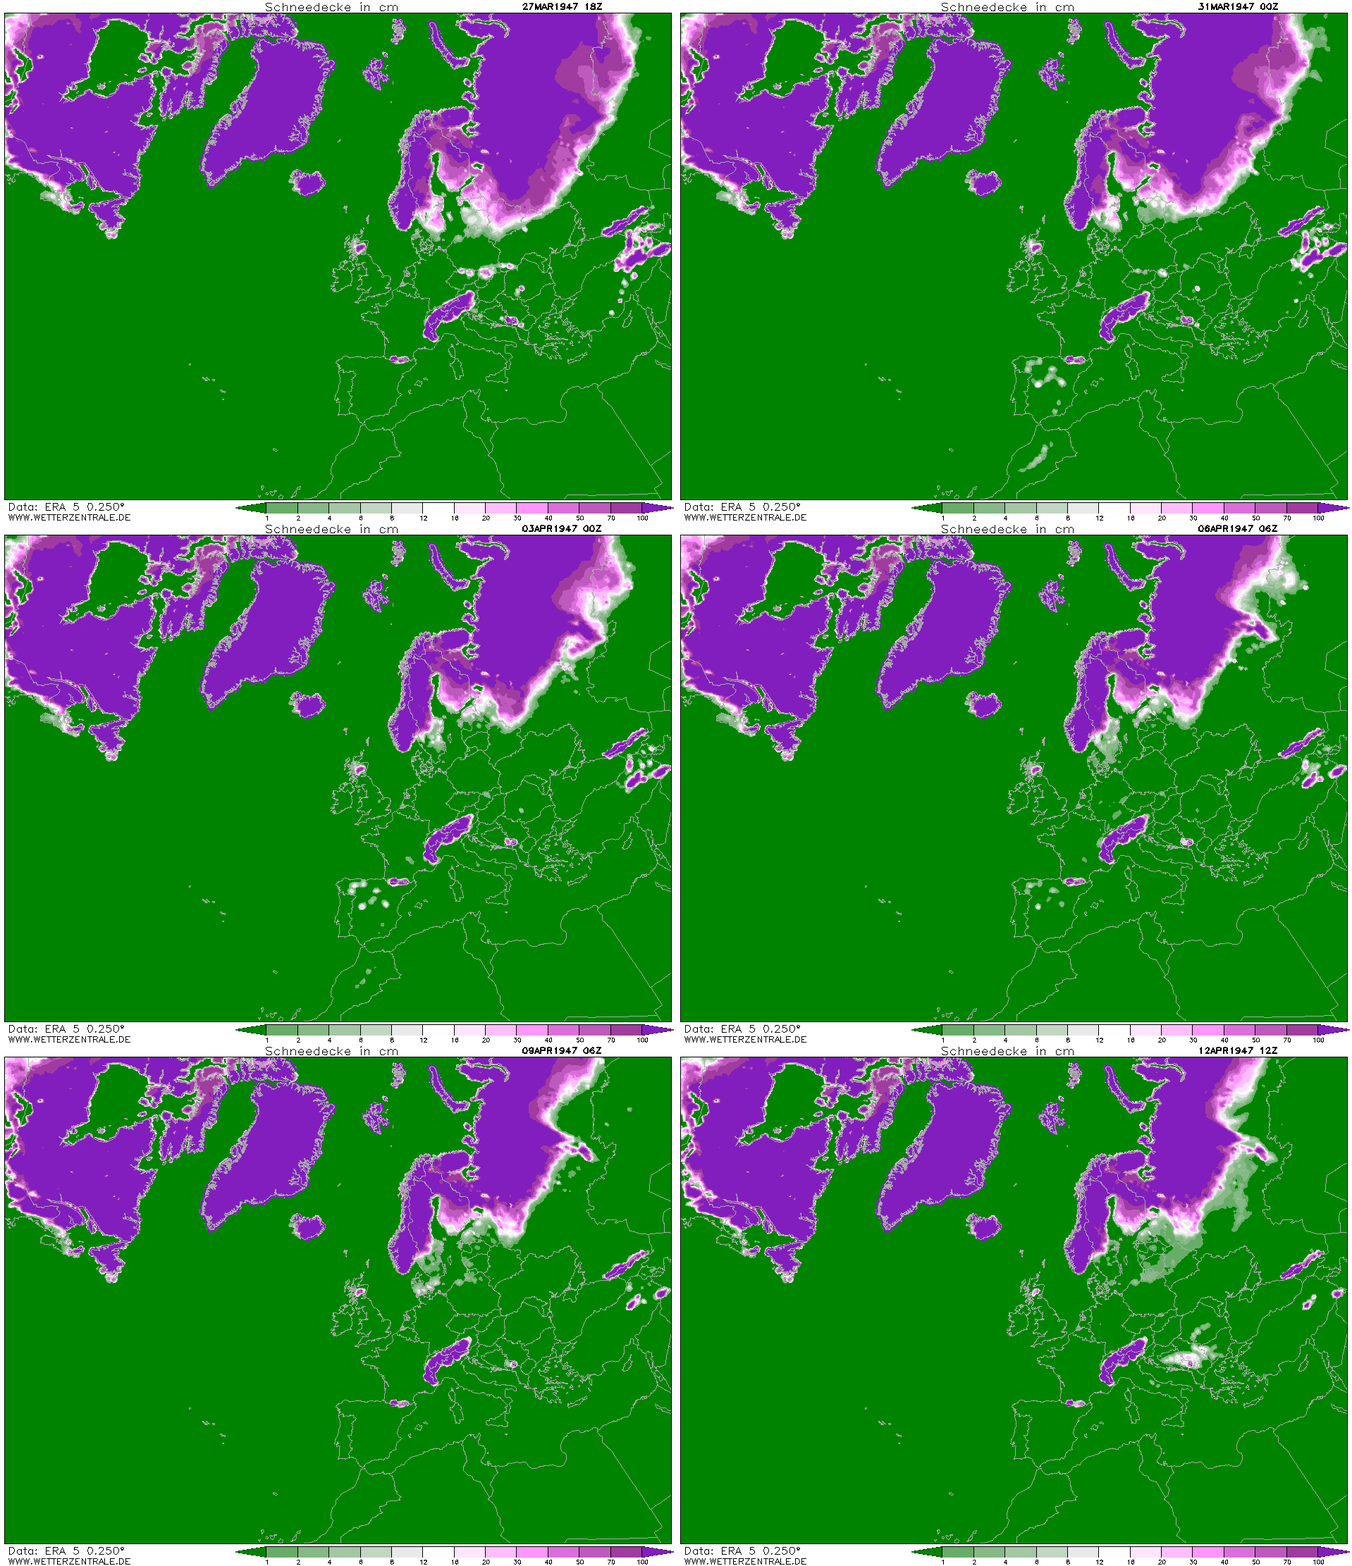
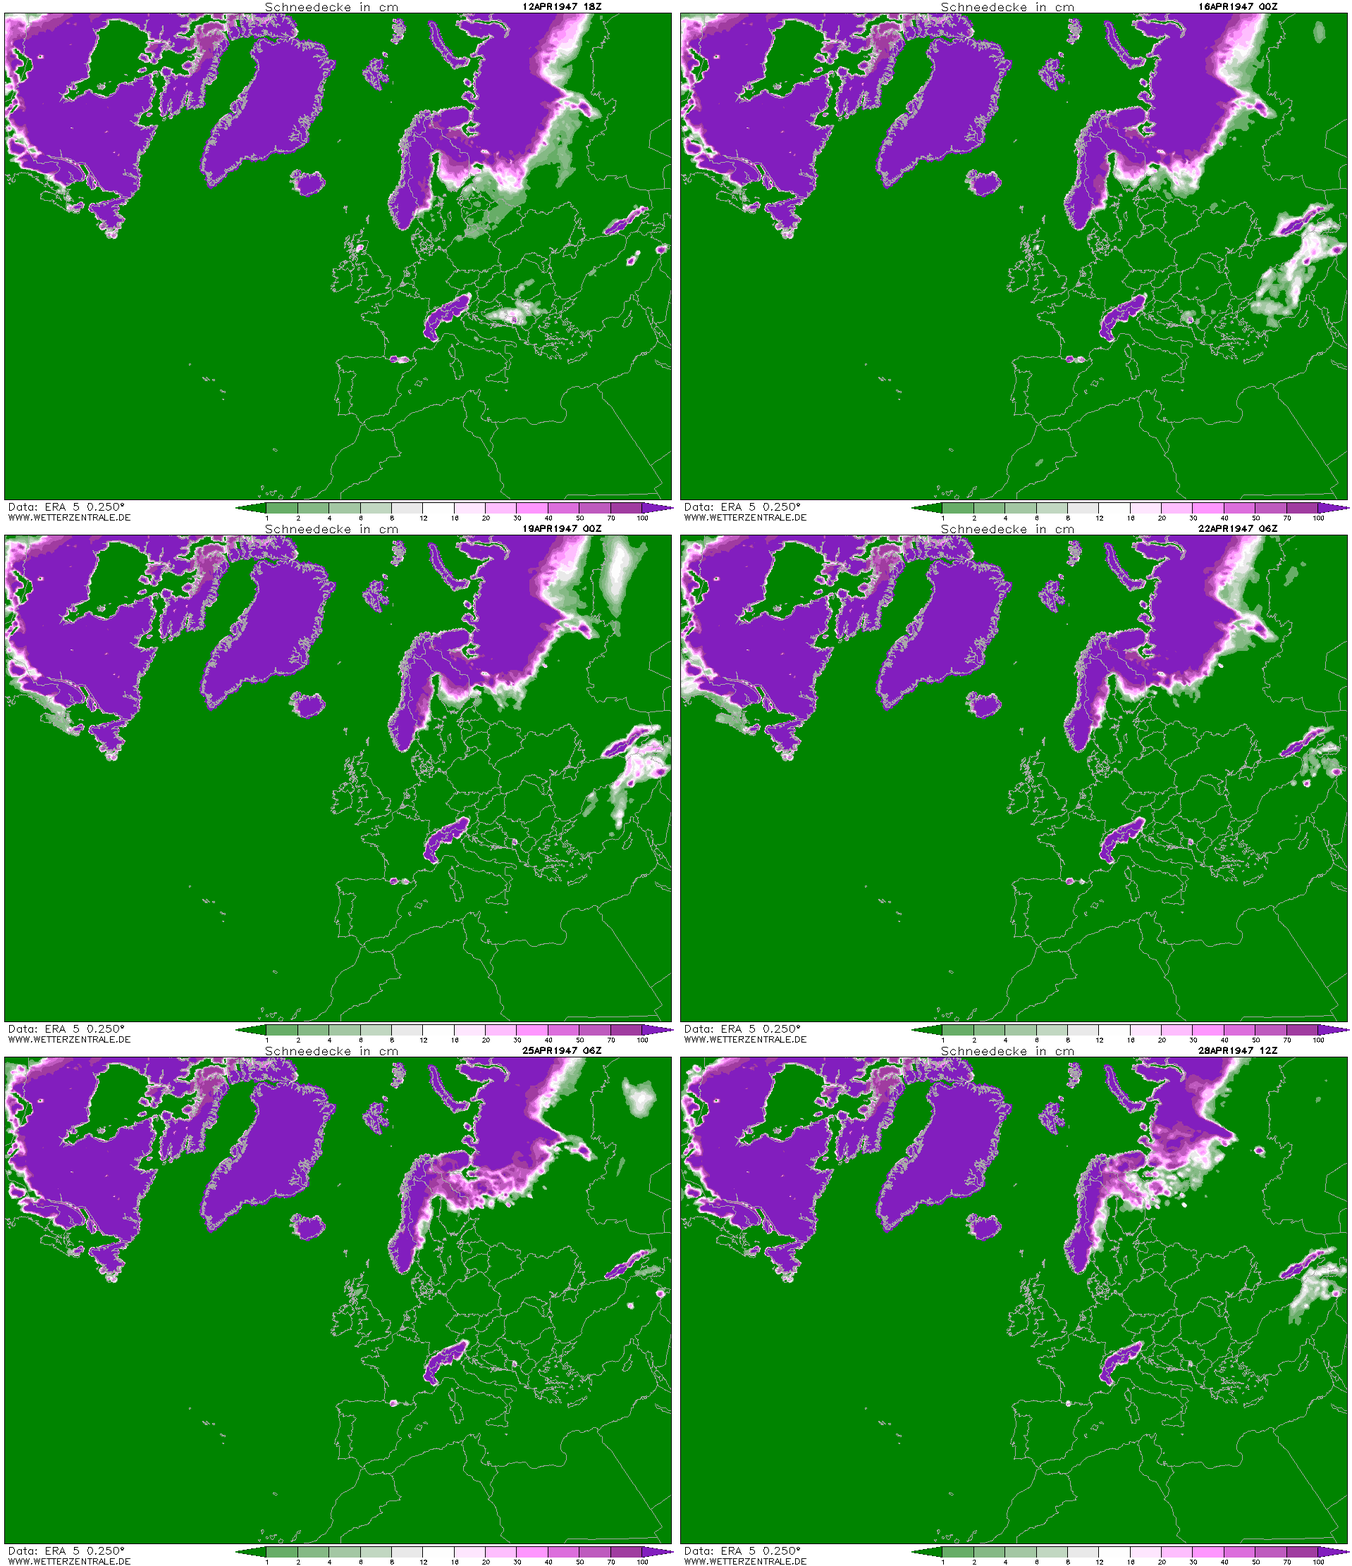
Winter 1947: 51 consecutive days of lying snow across London and SE

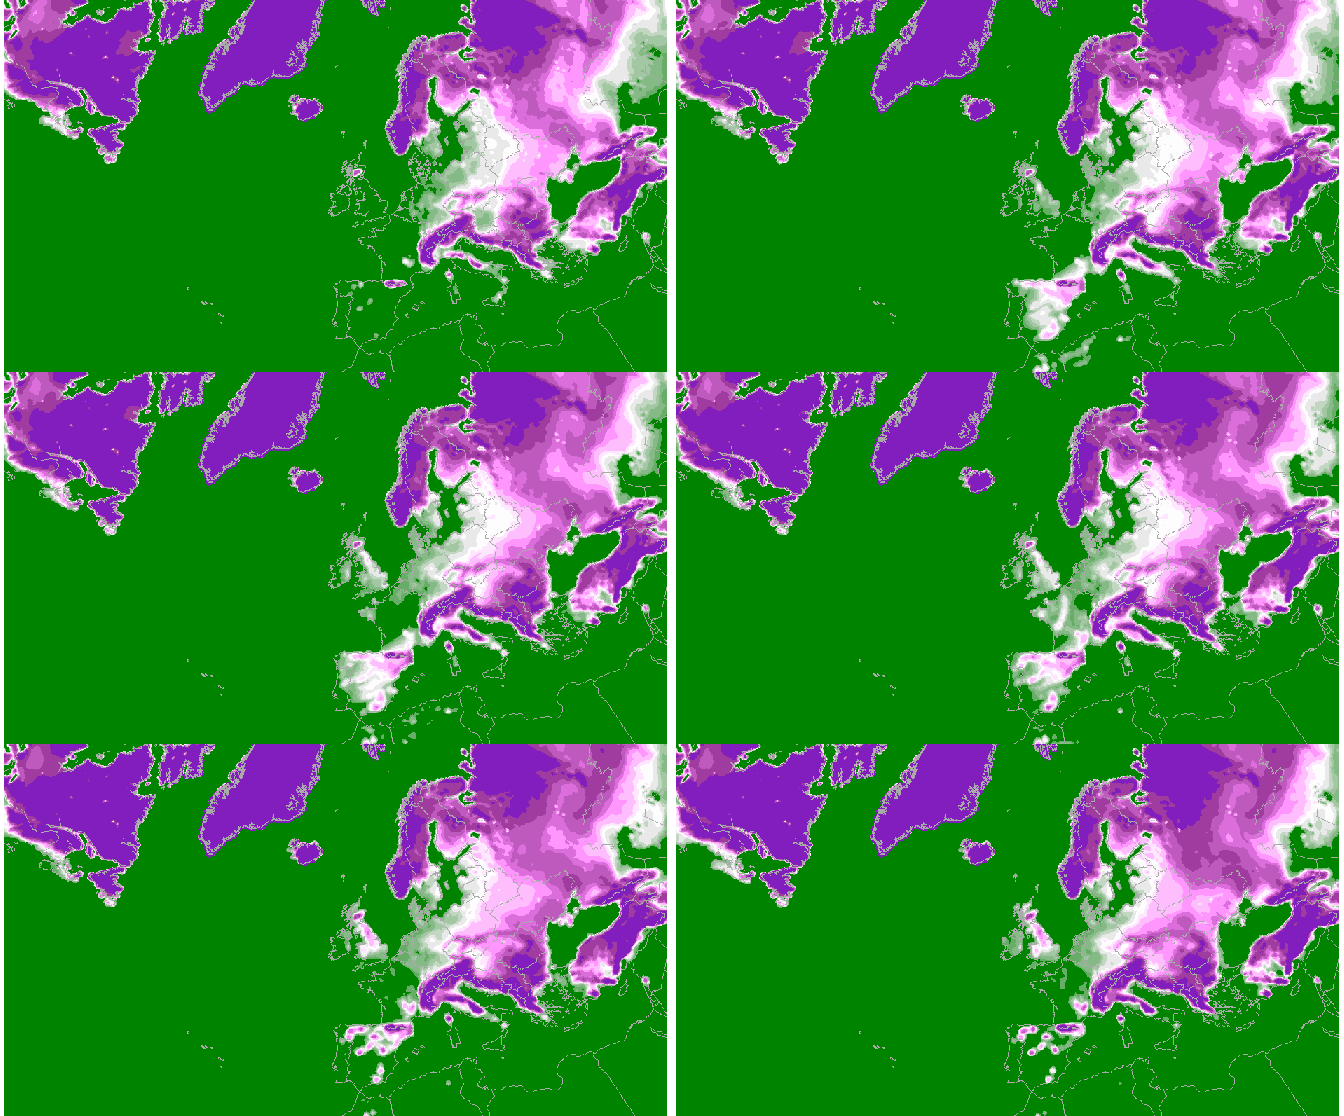
Below is a number of GIFs that illustrate snow cover across the Northern Hemisphere during the late winter of 1947.

This part of the British Isles saw snow cover from late January to mid March. The animation suggests there was snow cover in the London area for an astonishing 51 consecutive days.

A superb account of this fabled winter can be found here.

Hours of frost

The opening week or so of 2026 has already seen 30 per cent of frost hours recorded locally in an average year.

The temperature at the site in Wanstead has been -0.1C or lower for nearly 64 hours, already more than half of what was recorded here in the whole of 2020.

The mean for January is currently 1.1C, 4.1C below average. It’s also been a wet start with 28mm of rain, 53 per cent of the whole month average.

While there’s been colder starts to a year continuous data that allows this kind of analysis only stretches back to 2014 on this site.

Meteorology-based musings about east London and beyond