Category Archives: UK rainfall

UK rainfall: Seathwaite / Honister v London

It’s been a wet winter so far. Some 177mm has fallen in Wanstead – already 122 per cent more what falls in an average winter.

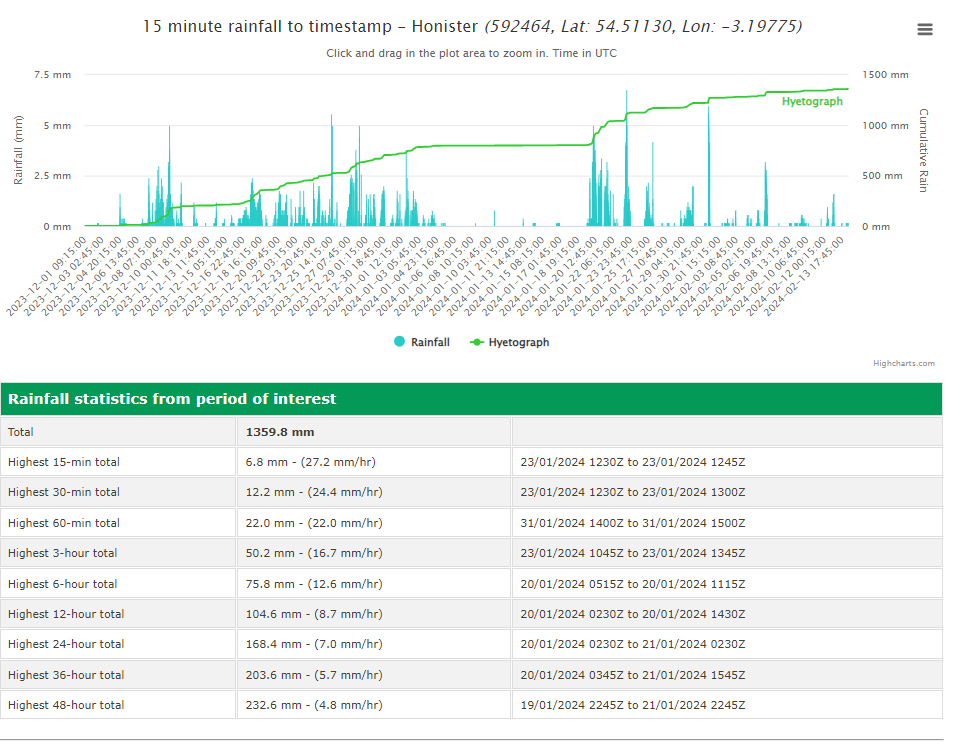
But the amount pales into comparison with the Lake District. Since December 1st 1360mm has fallen at Honister, a station close to Seathwaite which proudly proclaims itself as ‘England’s wettest place’.

Over a calendar year the area usually sees 5.6 times the amount of rainfall of London. However, this winter the total of 1360mm makes it 7.7 times wetter! A testament to just how persistent the SW’ly airstreams have been this season. And a reminder that the Lake District is the called the Lake District for a reason.

Data from the excellent Starlings Roost Weather.

Cloudburst at Brettenham, Suffolk

I hadn’t heard of Brettenham before this Suffolk village recorded over 100mm of rain from the convergence line event on the afternoon of Sunday, July 26th.

A former Environment Agency observer recorded 181.3mm in 1hr 40mins (1640-1820).

Notable on its own but even more so given that Wattisham, an official station 7.3km to the south-east, recorded just 2.4mm at the same time.

Whilst intensely isolated events happen, and often go unnoticed if they occur in uninhabited areas, this one seems more severe than what has previously been recorded.

The greatest 24hr rainfall recorded, according to Robin Stirling’s Weather of Britain, was 279mm on July 18th 1955 in Dorset. The rainfall far more widespread than the event on Sunday.

The event in Suffolk was covered by the East Anglian Daily Times. A report that mentions ‘rain falling in sheets and roads turned into rivers’ can be found here.

England’s gloriously rainy omen

What’s the most ridiculous omen for an England win in the European Championship final against Italy on Sunday? After hearing this on the radio this week I decided to try to find one.

Readers of this blog will know my theories of how the weather and big events seem to be tied together. So it is no surprise that I’ve indeed found one.

Last month, I wrote about summer washouts. The one last month that began on the 17th saw 28mm fall, possibly contributing to what was a dull spectacle; England’s 0-0 draw with Scotland at a rain-soaked Wembley.

While putting together the July list of washouts one of only six events since 1959 began on July 19th 1966. Over 20mm of rain fell, coinciding with England’s group game with France. The Three Lions won the tie thanks to a brace from Liverpool’s Roger Hunt. Days earlier they had been panned after a dull 0-0 draw with Uruguay. No-one, apart from Alf Ramsey, fancied our chances. Yet by the end of the month they were world champions.

So, in terms of football singularities, England’s is one title every 55 years? We’ll know by 11pm on Sunday.

Euro 2020, weather and Wimbledon

Four June washouts in london

Compiling a list of sunless, rainy days revealed some interesting spells of wet weather – the most miserable runs of June days in the capital since 1959.

First up was a three-day spell starting on June 25, 1974. Some 34.3mm of rain was recorded.

Next was a three-day spell starting on June 23, 1991. Some 26.3mm of rain was recorded.

Another three-day spell started on June 25, 1997. Some 36.2mm of rain was recorded.

Finally, and most recently, a two-day spell this month that began on June 17th. Some 28mm of rain was recorded.

The above spells all happened around the date of the ‘June monsoon’ singularity which has a probability of 77 per cent. Though the fact that these occurred 47 years, 30 years and 24 years ago shows that these extreme cases happen a lot less than three years in every four the singularity would suggest.

Comparing the current Northern Hemisphere pattern with 1974 suggests that while there’s just as much heat around at 850mb as there was 47 years ago, including an extreme heatwave over some Nordic countries, the air above Greenland appears colder.

Sunless days and washouts

The weather of late has been in stark contrast to the mostly dry, sunny (if a bit chilly) spring many enjoyed. Indeed the first half of June saw more of the same and, locally, was the warmest start to the first meteorological summer month since at least 1959.

My memory of summers years ago was that it was often hot and sunny but I also remember countless days of staring out the window for hours waiting for relentless rain to let up.

Looking back at sunshine stats to 1959 there has been over 4,400 days where no sun was recorded, roughly a one in five chance of a totally cloudy day.

Considering the months where the absence of sun is most noticed, May to October inclusive, the probability decreases to just under one in ten.

To decant these to ‘washout days’ I’ve only included those sunless days that were also ‘wet days’ where 1mm or more of rain was recorded. The probability further decreases to just under one in twenty.

All very interesting but were there more washout days decades ago or is the memory playing tricks?

Looking overall shows an increase since 2013. Out of all the months the most notable change has been August.

The early March storms singularity

Storms in late February / early March occur in 88 per cent of years, according to Philip Eden’s study on singularities.

This year looks no different although the drop in air pressure looks like it will happen just in the nick of time.

The GFS op for the March 9th compared with the situation on the 2nd

A look at the past eight years shows the effects of the pattern are quite pronounced.

And a look nationwide reveals the following named storms occurred around this period.

Storm Jake, March 2, 2016

Storm Ewan, February 28, 2017

Storm Emma, March 1, 2018

Storm Karine, March 2, 2020

And going back further reveals a notable storm in the 19th century.

2019 Wanstead annual weather review

This year finished as the 17th warmest on record – some 0.4C warmer than the 1981-2010 average. Although mild it was the coolest for six years.

After a dry start a wet autumn saw annual rainfall finish above average, the wettest for five years, 105 97 per cent of average.

Sunshine was down on 2018 though the total was just above average.

2019

2019 temp

2019 rain

2019 sun

For a review of each month, click January, February, March, April, May, June, July, August, September, October, November, December

You can read the national review of weather events at the Met Office blog here.


Summary for 2019

Temperature (°C):
Mean (1 minute)  11.7
Mean (min+max)   11.7
Mean Minimum     7.3
Mean Maximum     16.1
Minimum          -6.5 day 30/01
Maximum          36.8 day 25/07
Highest Minimum  19.6 day 23/07
Lowest Maximum   1.3 day 23/01
Air frosts       43
Rainfall (mm):
Total for year  667.4
Wettest day      20.6 day 19/07
High rain rate   65.8 day 09/08
Rain days        158
Dry days         207
Wind (mph):
Highest Gust     36.5 day 10/03
Average Speed    2.5
Wind Run         22211.5 miles
Gale days        0
Pressure (mb):
Maximum          1053.4 day 09/08
Minimum          969.8 day 12/12
Days with snow falling         5
Days with snow lying at 0900   2
Total hours of sunshine        1451

December 2019: wettest for 17 years

The December monthly mean finished 6.3C, that’s 0.7C above average, making it the ninth month of 2019 where the monthly mean temperature finished above average.

The wet theme of October and November carried on into December; the 111.1mm collected was 209 per cent of the 1981-2010 average, the wettest since 2002.

Some 51hrs of sunshine were recorded, 126 per cent of average, the sunniest for three years.

There were seven air frosts.

To view full stats follow this link:http://1drv.ms/1kiTuzv

december t max

October 2019: wettest since 2004

The wet theme of the final week of September carried on into October; the 100.3mm collected was 150 per cent of the 1981-2010 average, the wettest 10th month for 15 years.

The monthly mean finished 11C, that’s 0.8C below average, the coldest October since 2012. It is only the second month of 2019 where the monthly mean temperature finishes below average.

Only 72hrs of sunshine were recorded, 68 per cent of average, the dullest October since 2002.

The area’s first frost arrived 10 days before the median date back to 1959. And 3 days earlier than last year. A shower with >5mm hail was observed on the 9th.

To view full stats follow this link:http://1drv.ms/1kiTuzv

oct max

Summary for October 2019

Temperature (°C):
Mean (1 minute)  11.5
Mean (min+max)   11.3
Mean Minimum     7.6
Mean Maximum     15.0
Minimum          -0.8 day 27
Maximum          20.4 day 14
Highest Minimum  11.9 day 05
Lowest Maximum   10.3 day 28
Air frosts       1
Rainfall (mm):
Total for month  100.3
Wettest day      16.6 day 05
High rain rate   20.1 day 01
Rain days        20
Dry days         11
Wind (mph):
Highest Gust     21.3 day 25
Average Speed    2.0
Wind Run         1492.7 miles
Gale days        0
Pressure (mb):
Maximum          1026.6 day 29
Minimum          996.6 day 01
Days with snow falling         0
Days with snow lying at 0900   0
Total hours of sunshine        72

September 2019: wettest since 2006

Most of the rain of September 2019 fell in the last week making what was a fairly unremarkable month weatherwise the wettest September for 13 years.

Some 63.9mm of rain fell which is 123 per cent of average.

The monthly mean finished 15.8C, that’s 0.4C above average, the warmest September for 3 years, 0.6C warmer than last year.

Sunshine, at 150.5hrs, 107 per cent of average but over 30 hours fewer than last year.

To view full stats follow this link:http://1drv.ms/1kiTuzv

sept

Summary for September 2019

Temperature (°C):
Mean (1 minute)  15.5
Mean (min+max)   15.8
Mean Minimum     11.1
Mean Maximum     20.5
Minimum          5.2 day 17
Maximum          26.0 day 15
Highest Minimum  15.7 day 23
Lowest Maximum   16.1 day 09
Air frosts       0
Rainfall (mm):
Total for month  63.9
Wettest day      14.9 day 24
High rain rate   28.2 day 27
Rain days        14
Dry days         16
Wind (mph):
Highest Gust     23.5 day 27
Average Speed    2.5
Wind Run         1809.2 miles
Gale days        0
Pressure (mb):
Maximum          1036.8 day 13
Minimum          992.3 day 29
Days with snow falling         0
Days with snow lying at 0900   0
Total hours of sunshine        0.0