
It’s been a while since this region has seen a sustained colder than average period. Though the past few weeks have seen colder than normal weather we have to go back to the beginning of 2015 where at least three consecutive months were colder than the 1981-2010 average.
The spell, which coincided with winter, was unremarkable with just one day of lying snow. The season finished 55th out of 73 of the most recent winters, the anomaly for the 90-day period was -0.3C. For deep, lasting snowfall events a monthly mean temperature must be at least 2C colder than average.
For anything ‘snow-worthy’ you have to go back seven years to a 10-month long colder than average spell that began in September 2012 and coincided with probably the last winter I can remember that had more than one cold spell with snow that lasted longer than a few days. The average mean for this spell was -1.3C.
The most potent cold period occurred during the winter of 1984/85, a winter where snow lay nearly a foot deep by the end of January and where seven ice days were recorded – these days we’re lucky to record just one ice day per winter! Only just behind was the 3-month period January to March 1987.
As with previous blogs I have devised a way of ranking these cold periods, by dividing the mean with the length in months. The first nine months of 1986 achieved the highest ranking, a period that included the 5th coldest February in this area since 1797.
![]()
And in chronological order…


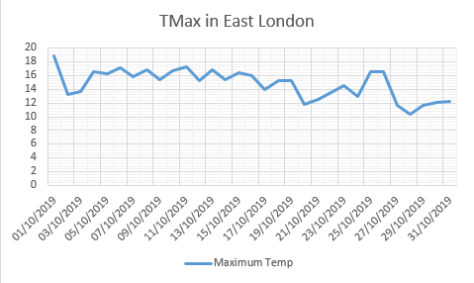
It is looking like the mean this November will finish below average, making it the second month in a row, something that hasn’t happened since March last year. Will December make it three in a row and a new addition to the list?


You must be logged in to post a comment.