Sunshine of late seems to have been endless with the past 10 days being virtually cloudless from dawn to dusk.
After a very sunny March which saw over 170% of average sunshine recorded at Heathrow April has already seen over 56% of average sun hours in the first eight days.
In terms of the total percentage possible of sun hours the past 11 days are second only to a period in 1990 that stretched from April 27th until May 7th.
The pattern has seen an anticyclone near stationary to our north, generating a dry NE’ly feed. Some 12.2 hours of sunshine were recorded at Heathrow on the 6th.
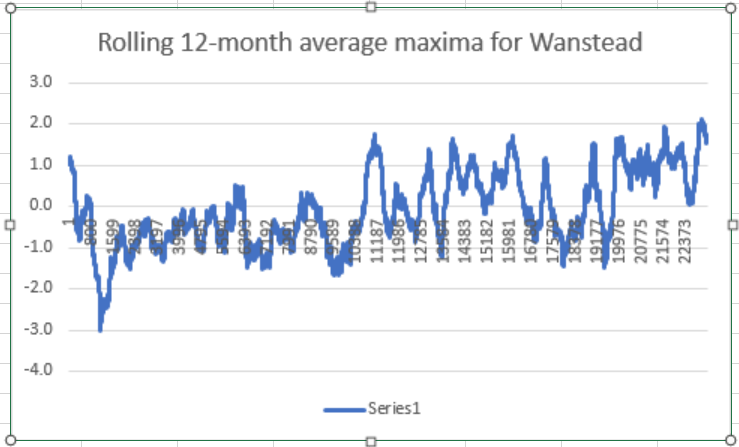
The rolling 12-month average maxima anomaly in Wanstead on June 10th is sitting at 1.6C.
Considering local statistics back to 1959 the figure reached an all-time high of 2.1C last November, a level it stayed until December 11th, when a very remarkable week of snow and frost arrived.
With unremarkable maxima for most of this year the figure has been falling. But with a building El Nino it remains to be seen if the highest anomaly ever of 2.1C will be breached.
Anomalies of the past two months throw up some interesting singularities as we head into late summer and autumn – with a hint that we could be heading for a much colder than normal December.
Using stats from the past 60 days revealed the following years. Those most similar to the current ENSO situation are highlighted in bold.
The most negative month on average will be December.
In terms of rainfall those hoping for a deluge look likely to be disappointed, at least in the south-east, with a continuation of synoptic conditions that favour drier than average weather.
The best chance for a wetter than average month appears to be September though, given recent synoptics, this is likely more a result of trough disruption than any sustained period of Atlantic-driven fronts.
Such was the force of the wind that the masses of masonry were carried 30 feet beyond the base of the tower penetrating not only the roof of the church but also the floor and breaking through the vaults to the foundation.
The account of a windstorm that severely damaged St John’s Church in Edinburgh in January 1818 was carried in the second volume of Luke Howard’s Climate of London.
Thursday morning 15th the barometer had fallen eight tenths of an inch it then blew very hard and during the whole course of the day slates and chimney pots were flying about in all directions. In the evening the gale increased and about five o’clock it blew a perfect hurricane.
The ‘perfect hurricane’ was referring to the Beaufort Scale which had been written just over a decade before in 1805. Obviously anemometers were not around at the time – the scale was merely to describe sea conditions to help sailors. A modern interpretation of hurricane force 12 estimates mean speeds 72 – 83mph.
The church in Howard’s account had only just been built, it’s dedication being completed on March 19th the same year. Howard continues:
In houses fronting the west a good deal of mischief was done in breaking the panes of glass, stripping the lead from the roof, dashing the cupola windows from their frames and shivering them to atoms. In the course of the fore-noon two of the small minarets on the top of St John’s Chapel at the west end of Princes Street gave way and fell without doing any material damage to that beautiful building . Not so, however, the effects of the evening the violence of the wind carried off the whole of the minarets, large and small, leaving the summit of the tower a perfect ruin.
Later the same year storms struck the south coast of England.
Ryde, March 5 One of the severest gales of wind that has been felt here for the last 37 years was experienced last night. It commenced about 4.30pm and continued with increased violence until 11pm during which time the greater part of the pier and several houses were demolished. The supposed damage is estimated at between four and five thousand pounds (£500,000 in today’s money) No lives were lost nor any damage done to the shipping.
Dartmouth We experienced a perfect hurricane last night at SSE.
Some four years later the storms were back.
On December 5 Howard reported that the barometer had been low for an unusually long period of 23 days, a mean of 29.4 inches with southerly and westerly winds.
Norwich The Mercury reported that the city experienced one of the most tremendous gales and heavy rain in living memory.
The gusts which followed each other were most terrific and threatened the safety both of the houses which actually rocked to and fro from the violence and their inmates. By the tremendous gale of wind on the night of Thursday last a brick wall of between seventy and eighty feet in length at Ipswich was completely blown down.
Brighton At 7 o’clock on the 5th a small squall came on from the WSW and raged until 9.30am during which the rain descended in one incessant torrent and the roar and fury of the wind is not to be described.
Considerable alarm was excited by it in many parts of the town several houses were nearly unroofed and one not quite finished five stories high in Russell Square was levelled with the ground. The chain pier works sustained further injury but not to the extent which had been anticipated. Fortunately there were no shipping in this part of the Channel last night or we might have had many wrecks at this time to have particularized. Several vessels were wrecked during the storm on Thursday night. At Dover many houses were injured by the tempest and some tenements were blown down.
Manchester The Guardian reported on “one of the most terrific gales of wind with which this town has been visited for many years”
It commenced about night fall from the south west afterwards veering round to the west and gradually increased in violence until about 12am when it blew a perfect hurricane accompanied by heavy rain. By 10pm the town was left in almost utter darkness the greater part of the gas lights being blown out and those which escaped extinction were so violently agitated by the wind as to afford but little light. Many families passed the greater part of the night by the fire side not daring to retire to rest until the gale had abated.
Warrington The cupola of the church near the George Inn was blown down and part of the roof destroyed. A windmill in the neighbourhood was also blown entirely down.
Liverpool The Mercury reported that a “remarkably strong gale of wind was experienced here accompanied with rain, sleet and hail which continued with little intermission until after 9pm when it increased in force and destruction bursting against the higher buildings of the town in sudden and stunning gusts.
The alarm was general and accounts are now pouring in upon us from all quarters of the melancholy effects of the storm both on shore and on the river
Falmouth A “tremendous gale from SW and WSW” was reported.
We scarcely recollect seeing a more heavy sea running between the castles of Pendennis and Mawes.
Monmouth Among the casualties in Wales was a huge elm tree situated in the grounds of Raglan Castle.
The venerable tree which formed a happy termination at the east end of the terrace measured 26ft in girth and from whose trunks the two limbs which grew from the head of it spread their protecting shade 22ft fell a sacrifice to the fury of the elements, being blown from its commanding situation into the mead below. During the violence of the late storm twelve fine elm trees of large dimensions were torn up by the roots in front of and in the grounds of Trevallyn Hall, the seat of George Boscawen Esq. One of the trees that grew in the centre of the lawn is much to be regretted. It was a very handsome ornamental tree whose branches spread over a large extent of ground and which was the admiration of those who noticed it. The circumference of the butt is 12ft and contains in measurement 322ft of solid timber it was planted about the year 1760 by the late Mr Boydell of Trevallyn.
Halifax A large chimney was blown on to the roof of a house next to the Sportsman Inn at Greetland. It burst through three floors taking along with it two children out of the middle room and depositing them in the cellar. Amongst the ruins were the father and mother and three children who all survived.
Bristol reported a “most tremendous gale of wind from the SW”. The Birmingham and Oxford mail coaches reported that roads were strewn with trees and branches while in the north of Staffordshire the wind gradually rose accompanied with showers and blew with terrific violence during the night.
The Salopian Journal reported on a “hurricane of ten hours continuance”. In Shrewsbury the driver of the Holyhead mail coach spoke of 90 trees blown down in Powys Castle.
During the winter of 1988/89 the persistence of the Bartlett / Azores / Eurotrash high was painful to watch for anyone desperate to see some snow.
Week after week of high pressure brought a lot of mild, damp weather driven by Atlantic south-westerlies.
‘Balmy Britain’ the tabloids screamed but the savings on home energy costs were little noticed as the age of extortionate gas bills were still a generation away.
I didn’t think the winter would ever be surpassed in terms of its sheer mildness. And, as I write this on February 11th, it hasn’t. And there’s still time for cold weather in the last few days of the month to stop this season being in the same league as 1988 / 89 or the one the year after.
The stats to date reveal that this winter, according to statistics from Aviemore, is 1.8C colder than 33 years ago.
It has also been much drier though more snow days have been recorded.
Mean
Max
Min
Pressure (mb)
Precip (mm)
Average snow depth (cm)
Snow days
1988/89
5.0
7.7
2.0
1010.5
435.7
7.2
10
2021/22
3.2
6.1
0.2
1011.7
238.8
3.8
15
Above stats refer to December 1st to February 10th
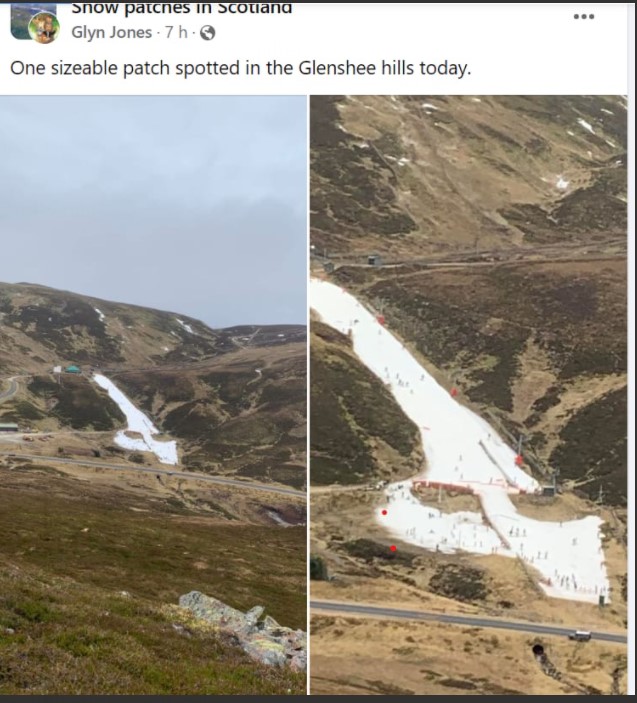
There have been numerous images on various social media of bare mountainsides. One of the most stark images I’ve seen were on Glenshee.
Were the hills this bare during the winter of 1988 / 89?
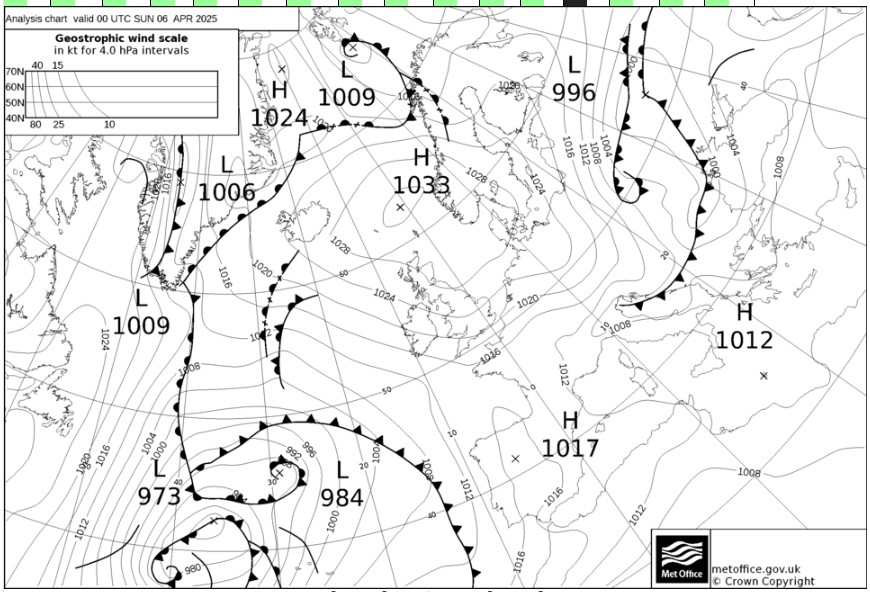
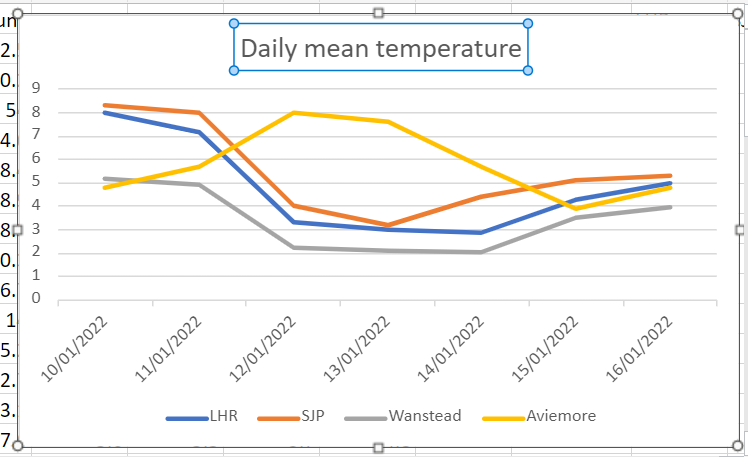
That’s not a statement that applies much, least of all the second week of January. But the current weather pattern has seen this town in the Highlands subject to the warming influence of the Atlantic, to a higher degree than London.
The above 850mb chart, typical of the past week, shows the warmer air aloft and the south of the UK seemingly cut off from outside influence.
Indeed, lack of solar heating at this time of year ensures that any thermal activity is minimal – with very little mixing of the boundary layers by day.
Wanstead Park, being a frost hollow, has seen this phenomena most days during the past week with this part of London markedly colder than elsewhere in the capital.
By the 16th the 7-day running mean at Aviemore was 2.4C higher than Wanstead!
The crux of the article is that certain weather types can repeat at the same time of year with one having a 100 per cent probability!
The Christmas storm singularity occurs in 84 per cent of years.
While 84 per cent certainly doesn’t mean ‘nailed on’, in the current set up of models being evenly spread between settled and stormy it can be safely guessed at this range that there will be unsettled weather around on the 25th. Whether it will affect the whole country remains uncertain.
The last big snorter of a Christmas storm I can remember in London was 2013. The entry for the 23rd into the 24th reads.
“Cloudy and breezy start grew steadily duller with rain just before noon. Rain grew heavier with some really strong gusts into evening culminating at 2am. Cloud at one point was 10kms thick. Three deaths related to weather.”
There was chaos nationwide with flooding and power cuts.
This winter is most likely to be on the colder side of average with near normal rainfall.
While the modelled prognosis for the first half of December looks unsettled with an Atlantic influence evolving from the current chilly NW’ly to a mild SW’ly, local analogues of the climate of London suggest the season could be a bit of a rollercoaster with spells of wet, windy and mild weather alternating with dry, calm and cold.
A large factor to consider this winter is the presence of a slight La Nina that is forecast to evolve cooler.
Given the uncertainties involved with the influence of ENSO I’ve decided to stick with analogues found in local data that stretches back to 1797.
Overall then the probabilities for the next 90 days are.
Mean
Probability
Rainfall
Probability
Mild (>5.9C)
14%
Wet (>178mm)
19%
Average (5.1C – 5.9C)
38%
Average (107-177mm)
62%
Cold (<5.1C)
48%
Dry (>107mm)
19%
The above table doesn’t reveal a great deal in that extremes can be hidden in a month or season that finishes broadly average. So I decided to look closer at the winters that were revealed in the analogues.
December
The first month, as already mentioned, looks like it will be on the mild side with possibly a notable storm off the Atlantic before things calm down over Christmas – the period between Boxing Day and New Year’s Eve possibly presenting the best chance of any lying snow in this region.
The below graphs are a smoothed representation of the years revealed in the analogues most similar to this autumn.
What is probably most interesting is that the analogues that shared a similar ENSO / La Nina index to this autumn tended to ‘turbo charge’ any yo-yoing in the weather type, be that super-mild or abnormal cold.
December probabilties for maxima: Mild: 48% Average: 19% Cold: 33%
And precipitation. Wet: 33% Average: 29% Dry: 38%
So, the month overall will be mild and slightly dry
January
The first month of 2022 probably represents this region’s best chance of lying snow this winter. A mild start perhaps with a falling off of temperatures in the final third of the month and a cold spell of a week or so. As with December the influence of La Nina could tend to boost the swings in the pattern.
January probabilties for maxima: Mild: 33% Average: 10% Cold: 57%
And precipitation. Wet: 19% Average: 43% Dry: 38%
Greatest chances for January, then, are cold with average precipitation.
February
The second month may see a slight return of the cold spell in January before temperatures recover for a mild and wet spell in the second half.
February probabilities for maxima. Mild: 33% Average: 15% Cold: 52%
And precipitation. Wet: 38% Average: 38% Dry: 24%
The stats suggest on the cold side overall with average to above average rainfall. Perhaps the depth of the cold skewing any very mild second half of the month?
The extremes that no-one can forecast
As well as the very mild winter of 1989/90 the analogues also revealed the very cold winter of 1978/79. There were others but their occurence makes the probability of a repeat at either extreme at less than 10 per cent.
The weather of late has been in stark contrast to the mostly dry, sunny (if a bit chilly) spring many enjoyed. Indeed the first half of June saw more of the same and, locally, was the warmest start to the first meteorological summer month since at least 1959.
My memory of summers years ago was that it was often hot and sunny but I also remember countless days of staring out the window for hours waiting for relentless rain to let up.
Looking back at sunshine stats to 1959 there has been over 4,400 days where no sun was recorded, roughly a one in five chance of a totally cloudy day.
Considering the months where the absence of sun is most noticed, May to October inclusive, the probability decreases to just under one in ten.
To decant these to ‘washout days’ I’ve only included those sunless days that were also ‘wet days’ where 1mm or more of rain was recorded. The probability further decreases to just under one in twenty.
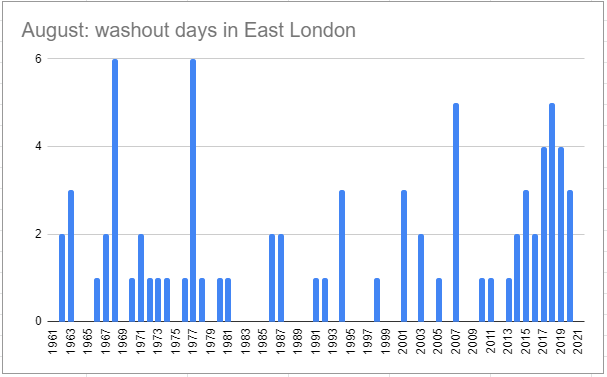
All very interesting but were there more washout days decades ago or is the memory playing tricks?
Looking overall shows an increase since 2013. Out of all the months the most notable change has been August.


You must be logged in to post a comment.