While heavy low cloud obscured the partial eclipse in this area there were a couple of interesting factors that I observed.
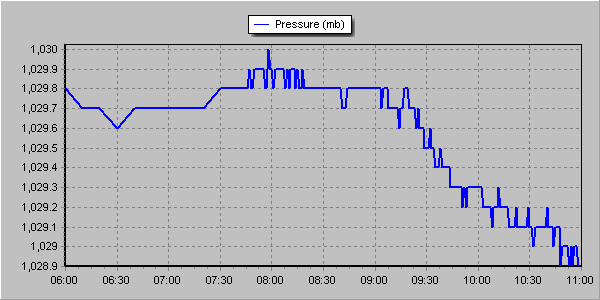
At 9.45am, shortly after the maximum obscuration of the solar disc the air pressure suddenly dropped. This coincided with sudden relief to my blocked nasal passages, symptoms of which appeared last night. Eighteen minutes later the fall in air pressure became less steep and the nasal symptoms returned.
The pressure dropped from 1029.8mb at 9.15am to 1029mb at 10.15am. I’m not sure if it was an effect of the eclipse or just a change in the synoptic situation that would have happened anyway
As the light began to fade it seemed to turn colder though, on looking at the actual figures, the effect of the partial eclipse through heavy cloud was a depression in temperature of 0.3C. I worked this out by comparing today with yesterday which had almost identical weather conditions. People remarked that it turned noticeably colder though perhaps this was more caused by standing out in temperatures of 4.9C for a long period.
Like the eclipse in 1999 I noticed that the birdsong quietened somewhat though there was not the same crescendo of noise that you normally get at dusk when birds roost.
Here is the temperature trace from the 19th. Even with the heavy cloud yesterday there was more warming from the sun, albeit by a very small 0.3CThis graph shows the temperature from 6am until 11am. Though the depression during the eclipse was just 0.1C comparison with the previous day, which saw near identical weather conditions, shows just how much solar heating was depressed
This winter was the second sunniest on record in this region. Sunshine hours totalled 238 hours during December, January and February – that’s 142% of average and second only to 2007/08.
Winter 2014/15 was the second sunniest on record with 238 hours of sunshine
The first lying snow for two years is also a notable observation of winter 2014/15. That it lasted just a few hours emphasises how little snow there was at sea-level for the second winter in succession.
The mean temperature of 5.2C was just 0.3C below the 1981-2010 average. Some 152mm of rain fell – that’s just 7mm over the winter average.
Winter began with the sunniest December on record in my series going back to 1877. Over 90 hours of sunshine was recorded in this area which is 224% of what we can expect to see during an average December.
January saw the first falling snow in nearly two years with the last three days of the month seeing the first flakes of winter – nothing much to write home about by average winter standards.
February produced the first lying snow in nearly two years. The 1cm depth at 9am on 3rd, however, is nothing much to write home about by average winter standards.
The wettest day during the three months was January 12th when 13.1mm fell.
Snow fell on 6 days. Air frosts: 27 Ground frosts: 48
Full stats for winter can be found here: http://1drv.ms/1rSfT7Y
At the end of November I published my annual winter forecast. I said the season would *probably* be colder with a better chance of snow than last winter. If I’m honest I thought we’d see more incidents of snowfall though, with my predicted mean temperature of 4.2C being exceeded by 1C, the air around the UK just wasn’t cold enough for snow at sea level. My predicted rainfall was more impressive – I forecast 156mm and was out by just 4mm!
Obviously when the season is average long-range forecasts like this have a much higher chance of being correct. One could argue that basic climatology has made my forecast look a reasonable one. But I stick to what the stats suggest and try to steer clear of the endless hyperbole published almost daily by certain tabloids.


You must be logged in to post a comment.