The GFS Scottish Christmas Day blizzard of 2020

With the midnight run of this model bringing the start of the 25th into range the prognosis for the big day is a rare white one – for those north of the border.

The rest of the country is messy mix of sleet and, in London’s case, cold rain with a high of 7C. It looks fairly average for this locality!

The GFS operational chart for 0000 on the 25th

But followers of this blog and elsewhere will know that any model output beyond 72 hours should be taken with a very large pinch of salt.

But while conditions out to 15 days are often very different they can give a general guide to how the atmosphere is evolving in the medium range. The last few winters I’ve been doing this Christmas day model blog have revealed that conditions are sometimes not wildly different from what was hinted at 372 hours before.

Over the last few days the GFS, and other models, has been flip-flopping between cold and mild, a symptom of the current atmospheric situation which suggests that the polar vortex may undergo displacement as we progress further into winter. This could signal colder weather for NW Europe – but exactly where this colder weather will be as we progress to the end of the month is very uncertain – any colder than average weather could remain closer toward Central Europe, as happened in 2008.

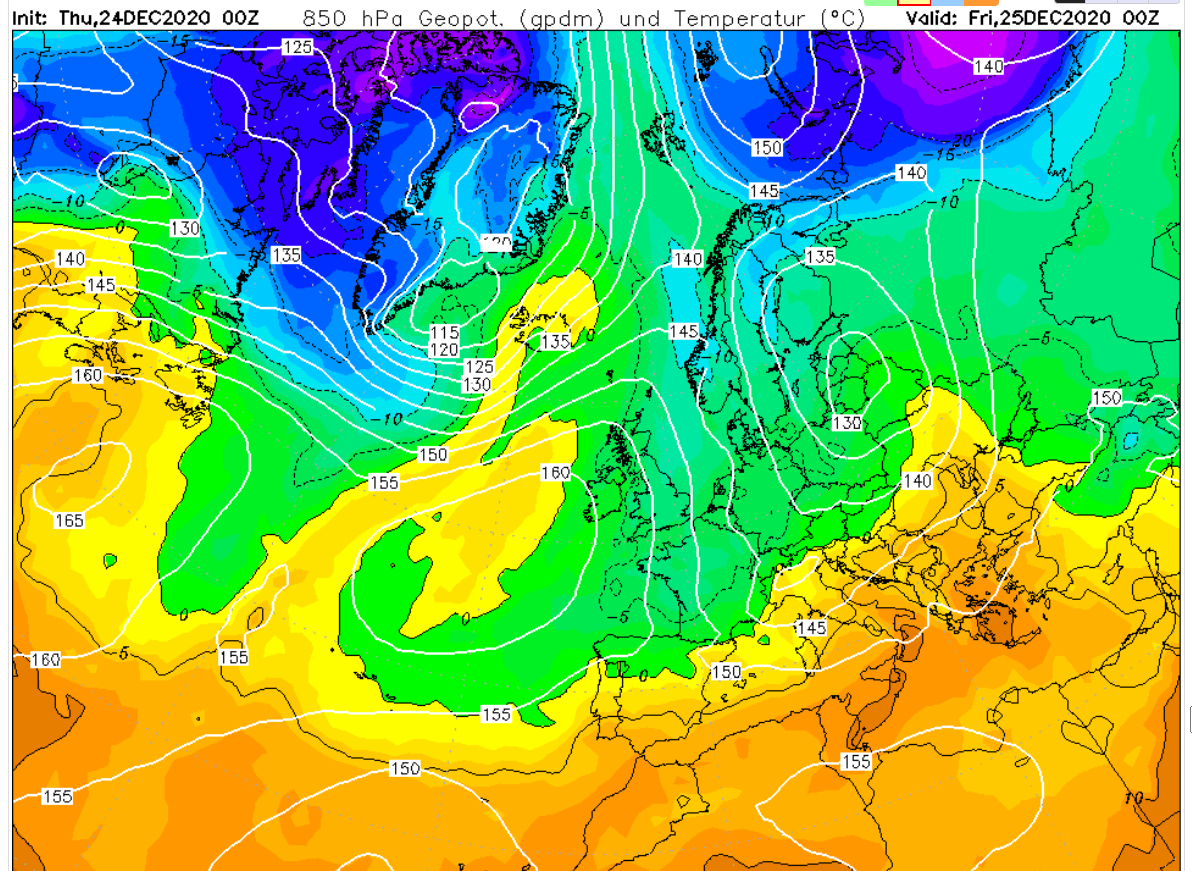
Below are charts for each day from the midnight operational run of the GFS model.

London winter forecast 2020/21

The best chance for lying snow this winter looks like being at the end of the second week of January.

A combination of local analogues and global atmospheric factors including the El Niño-Southern Oscillation suggest that the coming season will be colder than recent years. Though that’s not saying much considering just how mild winters of the past decade have been.

Meteorological autumn was the warmest for 5 years and slightly drier than last year’s wet autumn. Though it shares some similarities with 2015 the external influences are thankfully different to that season which produced the warmest December on record. Considering data back to 1797 I was able to make the following suggestions on how the next 90 days may unfold.

December is most likely to be around average temperature-wise with rainfall also about average. Possibly stormy at the end of the first week. Any snowfall events are likely to be marginal – bad news for anywhere below 70m above sea level. In terms of Christmas a white one in London looks unlikely. There may be interest in the week running up to the big day but I wouldn’t be surprised to see that inexplicable warm up that often happens just as the 25th arrives.
Mean: 5.8°C (5.6°C 1981-2010 average)
Rainfall: 57.1mm (53.2mm 1981-2010 average)

January is the month most likely to see any lying snowfall, particularly during the first half of the month, with the mean temperature about 1C colder than average. Rainfall is likely to be above average.
Mean: 4.1°C (5.2°C 1981-2010 average)
Rainfall: 63.8mm (53.2mm 1981-2010 average)

February looks wet and mild overall.
Mean: 6°C (5.3°C 1981-2010 average)
Rainfall: 55.6mm (39.2mm 1981-2010 average)

Overall the mean for winter: 5.3°C, a little below average.
And rainfall about 120 per cent higher than average.

Looking in closer detail reveals that the coldest period is most likely to be between 13th and 19th January, with anomalies sufficiently low enough for lasting lying snow.

The extremes that no-one can forecast

As well as the extreme December 2015 the analogues also revealed the severe season of 1822-23 which saw ice on the Thames by late December. February 8th saw a great snowstorm in northern England where people had to tunnel through the snow.

Another was 1950-51 which was very snowy at high levels. There were 102 days of lying snow at Dalwhinnie (1000ft), exceeding the 83 days set in 1946-47. December 15th saw 15in of snow in Shanklin, Isle of Wight in 3.5 hours.