Since the Met Office introduced its system of naming storms at the beginning of the autumn season in 2015 the effects felt in the capital have been fairly limited.
Introduced partly in response to the devastation caused by the St Jude Storm in October 2013 every wind storm since has failed to live up to the hype, at least at a local scale.
This tree at the side of the road in Woodford Green was a victim of the St Jude Storm in 2013
Of course many storms have caused major disruption elsewhere, not least Storm Desmond, floods from which devastated Glenridding in the Lake District.
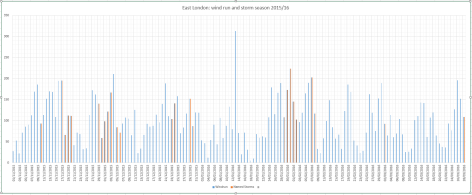
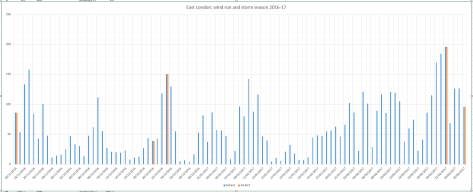
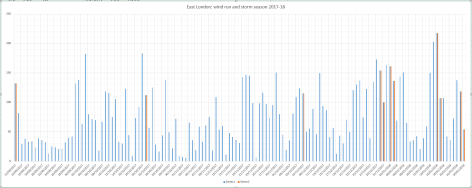
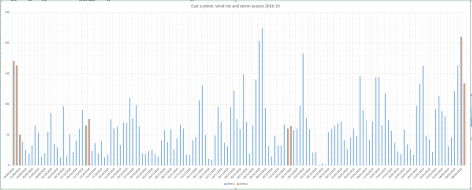
But closer to home many of these storms have been marked simply by a higher than average ‘wind run’, the number of revolutions of this weather station’s anemometer.
The windiest days in this locality coincided with Storms Gertrude, Fionn and Erik but these were minnows compared with St Jude and the most recent devastating storm in living memory, the Great Storm of 1987.
The graphs below also highlight the ongoing problem of naming storms in that some of the windiest days in this area occurred when there was no named storm.
The windiest day in the dataset was June 6th 2017 when a low pressure system saw Force 9 winds recorded in the Channel. Locally the day was very blustery and trees that were in full leaf were blown down.
With the mean temperature of both October and September finishing 0.2C below average it is probably safe to say that the weather is in an average kind of mood.
Conditions during the first part of November look changeable, according to the Met Office’s 30-day forecast . After mid month, however, the agency says the forecast is uncertain.
Now that much of the UK has had its first frost any warm spell in November will, correctly, be called an Indian summer. A singularity called the St Martin’s Summer occurs in 66 per cent of years, occurring between 15th and 21st and peaking on the 18th.
And, as if by magic, the GFS model today has this chart for the 16th, an Atlantic ridge of high pressure with daytime temperatures about 6C to 8C above average. Though warm during the day I would imagine there being a risk of fog forming at night
Beyond that there could be a tendency for much more unsettled weather at the end of the month. The early December storms singularity occurs in 98 per cent of years, starting between November 24th and December 14th, often peaking on December 9th.
November, the last autumn month, can often surprise with its extremes, though it can also often be characterised by days of anticyclonic gloom. The warmest, coldest and wettest November conditions in London back to 1959 can be found here.
The cold spell of February 1991 saw unusually deep snowfall in central London. The 20cm recorded at St James’s Park on the 8th was the greatest cover recorded at the site since the severe winter of 1962/63.
Courtesy of the Met Office
My own memory of the event was that the synoptics evolved fairly quickly. I was away at university at the time and had to be back for a family event that weekend. After seeing a forecast predicting that a foot of snow was on the way I jumped on a train a day earlier than planned and returned to London. The following morning all hell had broken loose as deep snow paralysed public transport.
Snow fell on the following 6 days with no thawing as the temperature remained below zero until the 10th. The maximum of the 7th was -3C. By the 9th there was widely 20cm of level powdery snow lying. Getting around was difficult – I remember some drifts during walks into town were thigh high.
By the end of the 19th all of the British Isles were snow free.
February 1991 in suburban east London
The nine charts below show how a strong ridge of high pressure from an anticyclone over northern Sweden on the 5th brought very cold air and heavy snowfall over the following days.
05021991
06021991
07021991
08021991
09021991
10021991
11021991
12021991
13021991
These significant weather charts show the snow depths at noon from 6th to the 13th.
06021991
07021991
08021991
09021991
10021991
11021991
12021991
13021991
Courtesy of the Met Office
Ian McCaskill’s late evening BBC forecast on February 6th.
Francis Wilson’s breakfast telly forecast on February 7th 1991: “Temperatures rising from -11 to -5C. Depths in excess of a foot. It’s all downhill from now.”
The outlook for possible snow over the weekend reminds me of a similar synoptic set-up in December 1990 that left large parts of the Midlands northwards covered in deep snow, but that delivered only cold rain to the London area.
2017
1990
The situation in 1990 is explained on the excellent Booty Weather site.
“A low formed dramatically over central England on the 7th, large quantities of rain, turning in many places to snow, fell on its western and northern flanks. On the 7th and 8th very heavy snow fell over northern England, Wales, the Midlands and south west England, with heavy drifting in gale force winds, causing considerable disruption to traffic and cutting power lines.
“The snow did not freeze, however, but melted very rapidly during the next few days, as the temperature rose a little. By late on the 8th, many parts of the Midlands had 20cm or more of lying snow. Acocks Green, Birmingham, reported 42.5cm on the 8th. The Peak District had 38cm at Middleton and 25cm at Winksworth. Newcastle under Lyme reported 28cm, and many other places had more than 20cm. Drifts up to 60cm on motorways in the Derby area, and at Carlton in Coverdale, near Leyburn, a report of 240cm. Snowfall on the 9th in the Dorchester area in 1990 was the heaviest pre-Christmas fall in that area since 9 December 9th, 1967.”
My stats in London suggest that the system was a bit of a non-event here. Another account of December 1990 is covered here.
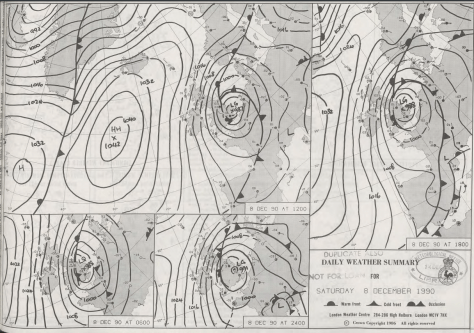
Met Office synoptic charts, general situation and surface obs for December 8th 1990
Signals for winter have always been well reported by the media. Back in the 1980s weather anoraks across Britain would wait with bated breath to read Bill Foggitt‘s latest prognostications for the coming winter. Though Foggitt had some success his observations, among other weather ‘gurus’, often amounted to weatherlore that has only a slightly greater than evens chance of being right.
One popular myth is that very large blackberries mean a harsh winter. The fact that this has more to do with plentiful rainfall plumping up the fruit at harvest time is ignored.
Colin Finch’s 38F minus rule is altogether different and provides a very good guide to the kind of weather we can expect in January and February. For the rule to work the maximum temperature must be 38F (3.3C) or less for four consecutive days before Christmas Day.
Colin, an amateur meteorologist who passed away in 1991, spent much time researching his rule in the 1970s. He found that most of the coldest winters since the end of the second world war gave a hint of things to come in the weeks leading up to Christmas: the Decembers of 1946, 1955, 1962, 1968, 1969, 1978 were all followed by cold late winters. In 1984 and 1985 the cold spell arrived at Christmas. Other years to loosely follow the rule, 1986, and 1990.
A few weeks ago I was reminded about Colin’s findings and decided to have another look, using daily record data for this area stretching back to 1806.
The results were surprising. If there is a run of cold days (3.3C or less) around mid-month the chance of an average to colder than average January and February is 94% and 74% respectively. The chance of an average to colder than average March is 96%. Also notable is that the chance of a severe spell in January (4C colder than normal) is 30%.
So much for the figures. What are the chances of a run of cold days between now and Christmas Day?
Sunset Southwark Bridge
Up until this week the weather has been fairly quiet with little rain and cold, often frosty nights. But westerlies are now roaring back in from the Atlantic and could be a hint of what is likely to prevail later in the winter. However, the ‘crunch’ time for the 38F minus rule comes soon after the middle of the month. If a spell of Arctic weather develops at that time, even if it lasts only a few days, then the chances of a major cold spell after Christmas are much higher.
As I write this blog the models suggest that a run of cold days may just be possible. It is also notable that the likelihood of a sudden stratospheric warming event, argued by many to be a precursor for conditions that would favour the development of a cold spell, is increasing with a peak set for mid January.
We’ll see but Colin Finch’s findings all those years ago are fascinating and are still relevant today.
* The following obituary appeared in an edition of Weather magazine, a publication of the Royal Meteorological Society, in 1991.
“Colin Finch – The news of the sudden death of Colin Finch on Friday, 23 August 1991 at the tragically early age of 55 will be received with sadness by Members of the society and readers of Weather.
There is no doubt that Colin was one of the most enthusiastic amateur meteorologists that the Society has ever had and, without seeking publicity for himself, he was responsible for making many other amateur enthusiasts aware of the Society and encouraging them to join.
Colin’s interest in the weather began when he was a small boy and received a considerable boost during the snowy and very cold winter of 1946/47 when he was 10 years old. In 1949, at the age of 13, he began to take regular temperature and rainfall readings and gradually added more sophisticated equipment. His record of daily weather data was unbroken until July 1991 when he became too ill to continue.
When he left school in 1953 he joined the Meteorological Office as a Scientific Assistant at Kingsway and was trained under the keen eye of Dick Ogden. Later, after a spell at Heathrow Airport, he left the Office frustrated by his inability to develop a career because he didn’t have sufficiently good educational qualifications. Instead, he turned to a successful business career but his enthusiasm for weather observing and forecasting increased.
Each day he plotted and analysed synoptic charts compiled from short-wave Morse code transmissions which he took down by hand. In the 1960s and 1970s it was quite normal for him to spend Saturdays plotting a chart for the whole of the Northern Hemisphere from Morse broadcasts. Later he had facsimile and satellite-receiving equipment installed at home.
By the late 1960s he was liaising with local authorities and the police in Surrey, warning them of the likelihood of severe weather events. In 1970 he joined the then newly introduced BBC Radio London and every Friday morning he would discuss current weather events and give climatological background data about the week ahead. For these broadcasts he would get up in the early hours to plot a synoptic chart before he went to the studio.
After the broadcasts he would go to the City for a normal day’s work. He kept up this punishing schedule for several years. When the Society introduced the highly successful one-day Saturday discussion meetings in September 1972 Colin was one of the first amateur meteorologists to give a presentation and he was a regular contributor to these occasions. He was an imposing figure, 6ft 4in tall, and was easy to seek out at meetings.”
There is a higher chance of snow this year. The average for lying snow in Wanstead at 9am in winter is 6 days
Probabilities for winter for the London area would be a more apt title for this post but that’s not very exciting compared with the hyperbole published almost daily by the likes of the Daily Express.
Much has been written about the sources of their forecasts over the past couple of years. Splash headlines that promise Armageddon Arctic conditions or Biblical blizzards never seem to materialise. So without boring you further I’ll move on to my own views on how I think the next 90-odd days will unfold.
Taking into account more sophisticated methods than my own there seems to be a signal for something colder than last year – though that’s not saying much given that 2013/14 was the 11th warmest winter on record with NO snow falling observed in this area.
Jack Frost could also be around more this winter than last
Though it was abandoned by the Met Office years ago I have decided to base my predictions more on analogues this year. I have a lot more data at my disposal – the series I use now extends past 1881 back to 1797.
The figure I arrived at, taken as an average of the closest matching autumn periods, is a mean temperature of 4.2C with rainfall totalling 156mm over the months of December, January and February – that’s about a degree colder than average and about average rainfall – though I think it could be less given that December is looking relatively dry on the current model output.
The probability of a winter with a mean temperature of between 3C and 4C is 33% – the most likely outcome – though this low figure emphasizes the mixed signals this autumn. With this in mind a winter similar to 1984/85 is possible which saw a brief cold snap at the end of December together with a two-week cold spell that began during the first week of January. There was also a 10-day cold spell during February of that winter.
To try to add value to the above outcome I also had a look at the likelihood of this winter being as mild as last winter.
It has been noted in the past that mild winters often come in twos. I had a look back through the series to see if this was true.
The occurrence of two very mild winters in succession is 27/217 (12.4%). The occurrence of a very mild winter being followed by a very cold or severe winter is 16/217 (7.4%). So while, from these simple stats, another mild winter is more likely, it is not really high enough to consider over the average I found in the first calculation made from straight autumn statistics.
A final fact to consider is just how mild and wet this year has been. Every month this year, apart from August, has been warmer than average by an average factor of 1.2. If December continues warm this year could possibly end as the warmest on record. However, it is also possible that nature is about to redress the balance.
* Forecasting models use probability on any given outcome. Millions of observations are fed into the Met Office database (and other countries’ weather agencies) every day. Supercomputers then crunch through this data to give probable outcomes. With the volatility of the atmosphere it is not surprising that certainty of any outcome often falls away rapidly. Forecasting has improved greatly in the last 20 years – though anything the models churn out beyond three to five days should be handled with caution. Long range models can give *some* idea of general trends for the months ahead – but changing just one variable can vastly alter an outcome at the end of the run.
* *Over the past few months I have been collating data for the area around Wanstead. This data is freely available from the excellent Met Office library and is emailed via Excel spreadsheet. Rainfall stats include a near-complete daily archive, stretching from 1961 to 2003, from City of London Cemetery . Sadly the rainfall station, along with many others, ceased to supply the Met Office after cuts were made shortly after the turn of century. Prior to 1961 I have used monthly figures taken at the Greenwich Royal Observatory stretching back to 1881. Though this is 6 miles away the difference in temperature between the two areas would be miniscule compared with rainfall data and so can be used. I use my own stats for the period after 2003.
The Met Office, earlier this week, warned us that extreme summer rainfall may become more frequent in the UK because of climate change. The research, produced in collaboration with Newcastle University, says that while summers are expected to become drier overall intense rainfall producing serious flash flooding could become several times more frequent.
I hadn’t thought much about the story until, as part of my attempt to find out what this summer is going to turn out like, I discovered some fascinating details of several events during the summers of 1811 and 1828. Many have remarkably similar characteristics to the Boscastle flood in 2004 – the kind of episode the Met Office tells us could become far more common by 2100.
The entries for 1811 in Luke Howard’s book The Climate of London once again shows that extreme weather is nothing new and serious flash flooding was actually more common all those years ago.
May 20 1811 A severe thunder storm came on at Ingatestone, Essex, accompanied with a deluge of rain. In ten minutes the water ran about three feet deep in the streets. The same night at Potter street on the road to Newmarket hailstones nearly as large as pigeons eggs fell accompanied with the most terrific thunder and lightning.
May 27, 1811 Hereford: We were visited by a dreadful storm of thunder and lightning accompanied by torrents of rain very destructive eastward of this city. It commenced about three o’clock in the afternoon and continued with little intermission till past eight. This storm and the consequent inundation of several thousand acres of land destroyed a number of lives and much property.
June 8, 1811 A severe storm of rain hail and lightning took place in Birmingham and the neighbourhood. The hail or rather pieces of ice which fell are described as of prodigious size and considerable damage has been done to the windows. Worcester this day another most tremendous storm of thunder lightning and rain took place about 11am equal to that of the 27th except the hail.
A storm was also experienced June 28 at Bury and its neighbourhood. The lower part of the houses were filled with water which lay in the street 5 feet deep. The hail stones 5 8ths of an inch in diameter broke near five thousand panes of glass. About twenty six head of cattle were killed last week by the lightning at Bisby and Walsham in Norfolk.
July 2, 1811 In the neighbourhood of Wonersh near Guildford after one of the most sudden strokes of thunder a deluge of rain took place so instantaneously as to carry away or destroy every thing which impeded its progress. The damage is estimated at not less than 1,500.
July 21, 1811 A heavy fall of rain did much damage at Stamford. In the meadows about Barrowden, Wakerly, Harringworth, Thorpe, Caldecot and Bringhurst immense quantities of hay were carried away. Several thousand loads it is supposed have been destroyed in addition to which the injury sustained by the land has been very great. The water rose thirteen feet in less than four hours in Wood Newton parish.
View from Greenwich Observatory toward the Royal Naval College
In 1828, a spring that was also similar in terms of temperature and rainfall to this year, more entries in Climate describe flash flooding events.
July 8, 1828 Extensive rains on Tuesday afternoon the 8th instant about four o’clock a storm of wind rain and hail accompanied with thunder and lightning broke over the town and neighbourhood of Taunton with a degree of violence never before remembered by the oldest inhabitant. The thunder in heavy peals was heard simultaneously from the east and west and the wind at one period of the storm blew a perfect hurricane. At Kingston the banks were thrown down for several miles and three rams the property of Mr Welch valued at thirty pounds were killed by the lightning. The corn is sadly levelled by the storm. The hailstones were of uncommon thickness and in their descent destroyed much glass in the windows of private dwellings and outhouses. Various statements of mischief have reached us from our correspondents for many miles round all representing the storm to have been of unqualified violence. Taunton Courier
The inundations occasioned by the constant heavy rains in Flintshire and Denbighshire have proved most injurious and in some instances destructive to the iron works in those counties. The Coed Talon works belonging to the Welsh Iron Company have sustained very considerable injury, the bridges, dams and culverts belonging to those works were all carried away by the tremendous torrents and bursting of the springs. On Thursday night week the waters in the immediate vicinity of the works rose to the extraordinary height of 22ft above their ordinary level and in a few hours extinguished the furnaces such was the impetuosity of the flood and the influence of opposing elements of fire and water that the most serious apprehensions were entertained that the furnaces would have been blown into the air.
The Met Office says summer deluges and intense rainfall will become more common
Happily the buildings sustained the shock and no lives have been lost. It is stated by the oldest inhabitants in the neighbourhood that such awful effects from impetuous torrents were never before witnessed by them. Throughout a great part of Oxfordshire and Worcestershire the wheat and barley have suffered considerably by the late heavy rains Friday afternoon, a solitary dark cloud passed over the north end of Winchester towards the valley of Itchen Abbas the sun shining from the opposite part of the horizon. The spot whereon the cloud appeared to rest seemed to be enveloped in total darkness whence shot a stream of electric fluid accompanied by a short but tremendous crash of thunder and hailstones of considerable magnitude. So violent was its force that it killed two fine horses belonging to Mr Twitchen of Itchen Abbas and struck the carter to the ground where he lay in a state of insensibility for some time, his frock was singed by the lightning. About the same time a cottage occupied by the shepherd of Mr Twitchen s brother at Mitcheldever experienced its violence by being greatly shattered and the shepherd’s wife struck instantly dead. During the same day three horses belonging to Mr Budd of Hatch Warren Farm, near Basingstoke, were struck dead by the electric fluid and a man who had charge of them was so dreadfully injured as to render recovery hopeless. Bath Chronicle
The list goes on… I’ve had a look at all summer rainfall since 1797 to see if 1811 and 1828 were particularly wet years but the records I have, taken by Luke Howard at Stratford, are nothing out of the ordinary.
The summer of 1811 in London saw a mean temperature of 16.1C (1.5C cooler than the current 1981-2010 average) while rainfall was 211mm (just under 150% of the current average). The summer of 1828, however, was warm for the period – at 17.5C. Rainfall was high at 317mm (218% of today’s summer average). Of course totals in the areas affected in the articles would have been much higher.
So when the Met Office says climate change is going to bring more flash flooding in summer I wonder if it is the climate cycling back to a period where we’ve seen it all before.
This graph of summer statisitics shows a regular series of peaks and troughs for rainfall. The mean temperature is generally 1C warmer than it was 100 years ago
*For those interested below is a continuation of summer flooding events that plagued the country in 1811, 1828 and possibly many other events of records we have probably sadly lost.
Sussex The accounts from the western part of this county both on the coast and in the weald concur in stating that the effects of the thunder storm of the 3rd instant were most severely felt. So severe a storm has not been experienced since 1821. The storm on the evening of Thursday night was most violent in the neighbourhood of Chichester and lasted from eight in the evening till nearly four in the morning, the electric fluid entered a cottage at Birdham and shivered a bedstead rolling its occupier with the bed on the floor lut who escaped without injury. Brighton Herald
The almost constant rain which has been experienced in Penzance and its neighbourhood has been very detrimental to the hay harvest West Briton PL
July 10, 1828 We regret to state that the floods in this neighbourhood still continue and the waters indicate by their colour how great the mischief is amongst the hay. The Welland and the Nene are of the hue of strong tea proceeding from the essence of the hay which is entirely washed out of whatever was not stacked before the 10th instant. – Stamford Mercury
Cambridge The late heavy rains in this part of the county have laid and much injured the corn crops and likewise considerably impeded the hay harvest Bury Herald
July 17, 1828 Sheffield In our last publication we alluded to the long continuance of hot weather which had been experienced in this neighbourhood. On Tuesday, however, a change took place and on Wednesday the rain fell more heavily and incessantly than it is remembered to have done at the same season for several summers past. Indeed not only were our two rivers remarkably high but the springs of many wells which had failed at the usual time experienced a temporary refluviation. Sheffield Iris, July 17
Malton, July 17 Every hour brings fresh accounts of the extensive losses sustained by the occupiers of land bordering on the Rye and Derwent. Hay has been floating in swarth and in cock of all sizes and the loss in various kinds of grain and potatoes is incalculable. Such a weight of rain and such a flood were never known at this season of the year. On Sunday morning last Sunderland was visited by a thunder storm. The lightning was remarkably vivid the peals of thunder were tremendous and the rain fell in torrents. The Wear was also much swollen. Great quantities of hay came down the river. From our correspondent at Durham dated Sunday afternoon: Since early on Saturday morning Durham and the neighbourhood have been visited with a succession of heavy rains insomuch that the river Wear is swollen to a dreadful height and has done and is still doing frightful damage to the adjacent fields which are overflown to the extent of many hundreds of acres many of which are meadow some just mown some in pike and some standing uncut – Tyne Mercury PL, July 17
Doncaster, July 19 I have within a few days been over a considerable tract of land in this and the adjoining county for the purpose of ascertaining the effects of the late floods on the crops. A great portion of the country through which the Derwent runs as well as the other rivers which empty themselves into the Humber has been overflowed to a very considerable depth and the consequence has been the complete destruction of the greater part of the grass which was cut and those crops which were not cut will not be worth the trouble. We regret to state that in this town and neighbourhood the weather has continued extremely unfavourable throughout the week. Scarcely a day has passed in which we have not been visited by heavy falls of rain accompanied in some instances with thunder and lightning. We have not heard of any further injury being done in the vicinity by floods but we fear that the wheat and other crops as well as fruit and vegetables will suffer greatly from the long continuance of wet weather. – Manchester Mercury PL, July 20
Although within the last few days several thunder storms have fallen in this immediate neighbourhood we have not heard of any serious injury to life or property. On Wednesday week 9th at Great Houghton during a thunderstorm the lightning descended through the sky light which it destroyed in the roof of Mr Brook’s house and through the ceiling into an upper apartment and shook down the tester of the bed on which Mrs Brook was reposing without, however, inflicting any injury further than the alarm into which she would naturally be thrown. Its course was then along a passage in which there was a cupboard whose contents of glass and earthenware were partly demolished and the door of the cupboard dashed along the passage at the extremity of which was a young female who happily escaped unhurt. – Doncaster Gazette PL, July 21
Newark July 21, 1828 You cannot possibly have an idea of the effects of the late stormy weather and the consequent inundation of the large tract of country unless you were to see it. All the country from this place situated on the banks of the Trent down to the Humber has been completely overflown and has borne the appearance of one expansive sea.
Bedford July 22 In consequence of the dreadful and continued rains every thing in the neighbourhood of this town is in the most frightful state. The Ouse has overflowed its banks in every direction as well below as above the bridge and for miles nothing is to be seen but a weary waste of waters with islands of hay or haycocks. The early season for hay gathering in the northern counties was favourable in the extreme and a great quantity of hay out of the abundant crop was secured in capital condition. About the middle of the last week the barometer sunk rapidly and torrents of rain fell day after day till the rivers became swollen and on Sunday and Monday last vast tracts of land particularly in the southeast part of this county extending from Doncaster to Hull were inundated. Even in the neighbourhood of Wakefield the hay was seen floating in the fields and near Barnsley a great deal was either washed away or rendered useless except for litter. The corn crops have also been much beaten down by the heavy rains and potatoes in low situations have suffered from the floods. – Leeds Mercury
Whitby From the 8th to the 13th instant a succession of heavy rains has been experienced at Whitby and its neighbourhood which did considerable damage to the bridges on the Esk. On Sunday morning the platform of the elegant suspension bridge at Ruswarp belonging to James Wilson Esq MP was wrenched from its abutments and together with the cast iron pillars was thrown into the stream. The small stone bridge recently erected by Edmund Turton Esq on the new line of road was also carried away likewise a bridge at Cock mill and another in the neighbourhood of Egton. The neat bridge at East Row has been so far injured as to be passable only by foot passengers. Great quantities of timber, hay were washed away and the fields and gardens completely flooded. From all parts of the country accounts pour in of the disastrous effects produced by the late uncommonly heavy rains. From Ganstead and Withernwick in Holderness to beyond Driffield a distance of from twenty five to thirty miles the country presents an almost unbroken sheet of water. The quantity of hay corn and potatoes destroyed and likely to be so is beyond all calculation thousands of acres of the latter are literally rotting in the ground. From Doncaster down to Gainsborough and the low grounds at the junction of the Ouse and Trent the inundation is stated to have been still more destructive than in this immediate neighbourhood. – Hull Advertiser
The south western districts of Scotland appear to have been visited by the same excessive quantity of rain that has been experienced so generally over England. It would appear, too, that the crops there are in general good and that the wheat in particular promises to turn out better than in the south July 30.
August 1828
Deal Aug 9 The wind has blown very hard the whole of this afternoon at intervals almost a hurricane. Wind WSW
Brixham (Torbay) Aug 9 At three o’clock this morning it came on to blow quite a hurricane from the SSW and continued unabated until four this afternoon since when it has been more moderate.
Falmouth Aug 9 It blew a heavy gale here last night and continued until noon this day from the SSE to WSW
Penzance Aug 9 The wind has blown a perfect hurricane from SW all this morning. Accounts of damage.
Noon. PL The storm still continues with unabated fury. Great numbers of trees have been blown up by the roots and many mows of corn in the fields are quite upset and the sheaves blowing about in all directions PL
The Thames was higher on Wednesday last than has been known at this season for twenty seven years. All the low land about Goring Pangbourn Mapledurham, Caversham, Sonning &c was under water. – Berkshire Chronicle
Winter 2024/25, considering the DJF mean, sits 68th out of 79 winters back to 1946/47.
It was the 13th snowless winter in the series . The only ‘top 10’ winter for snowfall of the past 30 years was 2009/10!
Snow is a very rare commodity in lowland Great Britain – even rarer in the Home Counties, and in our part of east London. Pulling back the curtains on a cold winter’s morning to be greeted by a fresh fall of deep, crisp and even snow is something most children experience and hold dear for life. The slush, ice and chaos that inevitably follows all too quickly is forgotten.
My memories of winters in the 1970s and 1980s is that they were far snowier and colder than they are today. But were they *always* cold and snowy? I decided to have a look back through the archives to find out. My first stop was the Met Office’s now defunct Snow Survey of Great Britain. This excellent compilation of reports logged by observers nationwide was printed annually as part of British Rainfall. But through lack of interest and cuts printing ceased after the 1991-92 season. Data continued to be collected though the modern version of the survey uses satellite technology to estimate daily UK snow depths – the Met Office website says that this is far less subjective than an individual nipping out at 9am every morning to ‘stick in a ruler’ and, those within sight of high ground, to observe where the snow line is. This does a disservice to the hundreds of observers who down the years diligently logged all their information as objectively as possible. But on to the data…
Regional data was not included in the survey until the 1965-66 season. Though Wanstead isn’t listed I have taken an estimate from data supplied from stations at Eastcote (53m), East Barnet (70m), Charlton Park (46m), Twickenham (13m), Teddington (9m). Because this area is influenced by Thames streamer snowfall that blows in off the North Sea and is funnelled upriver I have also considered readings from Epping (107m), Rayleigh (73m) and Southend (27m). Indeed, in some years Wanstead’s snowfall is much more similar to Rayleigh and Southend than it is to Greenwich and Teddington. Though my site is only 18m it seems to catch the snow much better than surrounding areas – probably to do with the fact that Aldersbrook is surrounded by greenery. People walking down from Wanstead village often remark that Wanstead Park is far snowier than the village a couple of dozen metres or so higher. Before 1965 I have used data from Woburn, Bedfordshire, which at 89m and 40 miles away as the crow flies, is the closest station in that long running series.
The mean temperature of a winter can look cold but it doesn’t always tell the full story. You can have a winter dominated by high pressure over the near continent making things very dry. But the anticyclones that ridge from Central Europe to the Azores can leave us in the ‘warm’ part of the high – and often lead to days of anticyclonic gloom; cold grey, dank and boring weather with little sunshine. On paper a season can look cold but in reality totally unremarkable; it is the number of days with ‘snow lying’ that people remember. For snow to settle it needs to be cold! For this reason I haven’t bothered with ‘snow falling’ data as it can snow at 4C in very dry air – yet nothing settles. Most weather geeks find ‘snow falling’ the most frustrating when it doesn’t stick. So on to the results.
The Top 20 winters in Wanstead, using ‘snow lying’ and ‘mean temperature’ in stats. Click here to view all 79 winters back to 1946/47
Once I worked out the ‘snow lying’ days I decided to devise a winter index by dividing ‘snow lying’ by seasonal mean temperature. Because the results using Celsius were problematic in that 1962/63 becomes very skewed upwards I decided to use Kelvin.
The results are quite surprising. Coming out top, not surprisingly, is 1962-63 with an index of 25.2 and 69 days of snow lying. Second is 1946-47 with an index of 21.1. Third is 1981-82 with an index of 10.5 – surprisingly ahead of 1978/79, the first winter in the series that I can recall; I remember returning home from school one night in December 1978 and the snow being as deep as the twelve-inch step to our house.
The index of 25.2 for the 1962/63 winter and 21.1 for 1946/47 – over double the amount of 1981/82 – shows how ‘off the scale’ those two winters really were. My father, who doesn’t share my enthusiasm for the weather, can distinctly recall the severe conditions of 1962/63. He said the roads were so thick with snow that when the thaw finally arrived in March he’d become so used to driving on snow that he crashed through somebody’s front garden wall, after losing control of his Mini on surface water sat on the ice.
More recent winters, which pale by comparison, rank surprisingly highly. The 2009/10 winter comes in at Number 10, higher than the legendary 1986/87, where the coldest day in recent times was recorded in London, which came in at Number 12. It should be noted that January 1987, when on the 12th the temperature did not rise above -5.5C all day, was sandwiched by a mild December and February.
Just by looking at winters with a mean of, say, 5C doesn’t tell you much about snowfall. When you look at 1985-86 (mean 4.1C) there were 22 days of snow lying at 9am – yet 2005/06 was colder (3.9C) and only 3 mornings saw snow lying – though that winter was particularly dry – the 13th driest in the series.
The median for ‘snow lying’ days in this series is six. The rolling median of the past 30 years, however, is only 2 so, with this in mind, if it does snow you should get out there and make the most of it.
You can view over 70 years of winters in this area, all ranked using my winter index here.
*It should be noted that a day of ‘snow lying’ only qualifies if there is more than 50% cover at the observation time of 9am. This means that it could snow 1cm at 10am – if that snow thaws by 9am the next day it won’t count. Though 8 winters appear snowless it is possible that these winters did see temporary coverings
Much comparison has been made of Monday morning’s storm which claimed the lives of four people and 1987. The origin of both storms was down to a combination of a jet streak interacting with a pool of warm air low down. Both storms followed a similar development but clearly 1987 was more optimum. The 1987 storm was slower and further to the west when it developed. This morning’s storm was too much in the jet stream and raced on with less development.
Both the 2013 storm, left, and the 1987 storm followed a similar track as shown on these satellite pictures
From the forecasts made at the end of last week into the weekend it was about what I expected in terms of intensity – though I thought the peak of the max gusts (47.2mph at 0653) would have been shorter. Rainfall from the event was unremarkable – just 17.5mm which started falling around 9pm on Sunday and stopped around 5am. Totals north of Watford were far greater. This rainfall radar image at 0645 was taken within 10 minutes of the highest gust in Wanstead.
Rainfall radar image at 0645 – less than 10 minutes before the highest gust in Wanstead. Notice the curl of the cloud – this is where the sting jet gets its name as it looks like a scorpion’s tail. Thanks to MeteoX
Stations similar to here in Woodford Wells and Laindon all reported maximum gusts of 47-53mph, though with these being sheltered gardens the reality was probably higher – perhaps severe gale force 9 was reached at the storm’s peak here. Andrewsfield, near Braintree, North Essex, recorded 79mph. An animation of the storm’s track clearly shows the path of the sting jet. The Met Office have also released a satellite sequence of events. Of course the storm is no comparison with the Great Storm of October 1987, where a gust of 122 mph was recorded in Gorleston, Norfolk, but this morning’s storm was probably in the top 5 of storms since – and the most potent since the Burns’ Day storm of January 1990.
The tree damage in Wanstead has been worse than I would have expected with a few down on Christchurch Green. My own back yard in Aldersbrook seems to have got off lightly though a small flowering cherry on the corner of Dover Road succumbed. On closure inspection the inside of the trunk was spongy – testament to the fungus that I’d noted had been growing on it recently. Elsewhere, in Wanstead Park, some trees were sadly lost. Friends of Wanstead Park give a brief account of the damage here.
After it left Suffolk the storm raced across the North Sea, still deepening all the while, and caused havoc in Belgium and the Netherlands. Much has been said about the UK media’s obsession with the storm which chiefly affected the south east but Belgian and Dutch news outlets also focussed on the weather. In Brussels people were virtually blown along the street. Falling trees blocked canals in Amsterdam where a cyclist narrowly escaped being hit by a falling tree. There were no reports of deaths across the Channel and some watersports fanatics took full advantage of the wild conditions. The storm, which at one point developed an ‘eye‘, continued its destruction across Germany where this home was almost totally destroyed.
This car had a lucky escapeThe synoptic situation at 0600z on October 28, 2013Top 30 windiest places for 0600 UTC, on Friday, October 16, 1987top 30 windiest places at 0600 UTC on Monday, October 28, 2013


 “The snow did not freeze, however, but melted very rapidly during the next few days, as the temperature rose a little. By late on the 8th, many parts of the Midlands had 20cm or more of lying snow. Acocks Green, Birmingham, reported 42.5cm on the 8th. The Peak District had 38cm at Middleton and 25cm at Winksworth. Newcastle under Lyme reported 28cm, and many other places had more than 20cm. Drifts up to 60cm on motorways in the Derby area, and at Carlton in Coverdale, near Leyburn, a report of 240cm. Snowfall on the 9th in the Dorchester area in 1990 was the heaviest pre-Christmas fall in that area since 9 December 9th, 1967.”


You must be logged in to post a comment.