Wanstead has a new automatic weather station to complement the one set up in November 2012.
The new AWS, situated in the grounds of Wanstead Golf Club, comes thanks to Friends of Wanstead Parklands. Data from the unit, which is sited very close to where Wanstead House once stood, will be used to help monitor the levels of the park’s lakes.
The sensor unit, 750m NNE of the weather station wansteadweather.co.uk on the Aldersbrook estate, is much better exposed and will hopefully offer more accurate wind and sunshine readings. It will also provide a chance to further investigate the area’s microclimate.
The station has already shown that the golf course is warmer on a radiative cooling night than the Aldersbrook Estate.
There’s been much anticipation regarding the forthcoming sudden stratospheric warming (SSW) event with many hoping that a resultant split vortex will result in unseasonably cold weather in the UK and… copious snow in the low-lying south-east.
An SSW event, which reverses winds high up in the atmosphere from a westerly to easterly, can downwell into the troposphere, bringing weather from a (usually) cold continent instead of the warm Atlantic.
While a split PV event is usually more conducive for cold weather in the UK, as opposed to a ‘displaced vortex’, which usually favours only the eastern US, it is by no means a guarantee of a cold pattern subsequently evolving.
Using results published in the paper Tropospheric Precursors and Stratospheric Warmings (Judah Cohen and Justin Jones), along with meteorological data for east London, I set out to find what influence past warmings had on the weather in the capital.
Looking 45 days either side of the central date for vortex splits gave the following, chaotic graph.
But every year is different. And there appears to be more likelihood of an SSW making a difference, in terms of prompting a colder pattern, the earlier in the winter it occurs.
The SSW in 1985 was followed by a 45-day mean temperature anomaly of -3.8C! If you look at a shorter timescale, 15 days after a split PV and the anomaly is -10C on January 16th: -4.9C is the second coldest January day in Wanstead of the past 60 years.
At the other end of the scale the SSW event on March 23rd 1965 was followed by a POSITIVE anomaly of 3.4C. Perhaps solar influence this late in the year can override any SSW? Elsewhere, however, according to the website london-weather.eu: “3rd March – A combination of deep snow cover and clear skies allowed minimum temperatures to fall below -21C in northern Scotland.”
During another SSW in 2001 results in London were fairly unremarkable though heavy snow fell in Ireland.
This graph shows a general downward trend in the 15 days following an SSW event
The other result to consider is the influence from ENSO. It seems that when La Nina is ‘too negative’ this can ‘overcook’ proceedings and actually leave our part of the UK with a positive anomaly, as this table shows. It should be noted, however, that thicker Arctic ice in the 1960s would also possibly have had more influence than now.
There hasn’t been a full SSW event for years. The impact this one will have on our weather in London, a tiny part of the globe, is impossible to quantify. Though the latest model output is encouraging for anyone looking for a chilly end to winter.
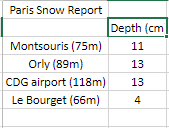
It’s all been happening in the French capital recently with deep snow replacing floods and rats as the main problem hampering residents.
Some great footage is doing the rounds on social media of people of varying abilities partaking in various wintersports; Montmartre hill turning into an impromptu playground.
The cold spell of February 1991 saw unusually deep snowfall in central London. The 20cm recorded at St James’s Park on the 8th was the greatest cover recorded at the site since the severe winter of 1962/63.
Courtesy of the Met Office
My own memory of the event was that the synoptics evolved fairly quickly. I was away at university at the time and had to be back for a family event that weekend. After seeing a forecast predicting that a foot of snow was on the way I jumped on a train a day earlier than planned and returned to London. The following morning all hell had broken loose as deep snow paralysed public transport.
Snow fell on the following 6 days with no thawing as the temperature remained below zero until the 10th. The maximum of the 7th was -3C. By the 9th there was widely 20cm of level powdery snow lying. Getting around was difficult – I remember some drifts during walks into town were thigh high.
By the end of the 19th all of the British Isles were snow free.
February 1991 in suburban east London
The nine charts below show how a strong ridge of high pressure from an anticyclone over northern Sweden on the 5th brought very cold air and heavy snowfall over the following days.
05021991
06021991
07021991
08021991
09021991
10021991
11021991
12021991
13021991
These significant weather charts show the snow depths at noon from 6th to the 13th.
06021991
07021991
08021991
09021991
10021991
11021991
12021991
13021991
Courtesy of the Met Office
Ian McCaskill’s late evening BBC forecast on February 6th.
Francis Wilson’s breakfast telly forecast on February 7th 1991: “Temperatures rising from -11 to -5C. Depths in excess of a foot. It’s all downhill from now.”
January 2017 was a wet month. Just over 64mm of rain was recorded, 121 per cent of average, slightly less than last January.
The monthly mean finished 6.4C, 1.2C above average and the mildest January for four years.
Some 44 hours of sunshine were recorded, 88 per cent of average, the dullest January for six years.
The most notable event was during the early hours of the 18th when the ‘storm with no name’ felled many mature trees across a swathe of England, including a large beech on Blake Hall Road that led to the closure of the road during morning rush hour.
I’ve put together a few top 10s of stats for Wanstead, St James’s Park and Heathrow for the month of February.
Probably most notable is the cold February of 1991 which saw the deepest snowfall I can remember – days of snow saw the level depth past my knee in suburban London. February 1986 was also very cold but also very dry with little snow.
Februaries in the 1990s were also often warm with 19.7C being reached in Wanstead on 13th in 1998.
It is a shame that the Met Office only publishes easy to access daily data in Excel format back to 1959 as this obviously omits the classic snowy February of 1947 which is worth a blog on its own.
My winter forecast for the London area can be found here.
Some national UK February values according to TORRO
Recent model output that has many bullishly predicting a cold spell in February reminds me of the winter of 2008 when the likes of the GFS and ECMWF models kept teasing us that a Scandinavian high pressure was imminent.
This rare pattern brings the south-east its coldest weather in winter, in the past bringing the January 1987 and February 1991 cold spells.
Midnight on February 16th 2008 just before the high moved south, taking its cold weather into the Balkans
A look back at the pressure patterns in 2008 show that high pressure was in the ‘right place’ between the 11th and 16th but, just as -10C uppers looked poised to flood across from eastern Europe, the high pressure collapsed south, leaving the UK in a SE’ly flow off a mild France.
There was snow in 2008 but it didn’t arrive until the spring, in late March and, the best fall, in early April when I remember waking up on the 6th to a 5cm covering that mostly melted by lunchtime.
I suppose the one silver lining for any coldies reading this is that February 2008 was the sunniest on record.
The mean temperature for December 1st – January 30th is 6C for both 2007/08 and 2017/18
The maps below show the sea surface temperature anomalies. A slight La Nina on both. ENSO, considering my winter forecast, has been the best guide for how this winter has so-far panned out – front loaded.
Philip Eden’s column in the journal Weather showed that there was some wintry weather in February 2008 but it was restricted to the north of England northwards
* The focus of these blogs is usually on what the weather was, or may be, like in my backyard – though they usually broadly apply to anywhere in the south-east that is close to sea level.
“Worst floods ever!” Hyperbolic reporting of weather events is nothing new; whenever the UK is hit by the latest named storm breathless news anchors often try to portray atrocious conditions as ‘unprecedented’. This may soon change thanks to a project that uses citizen science.
Operation Weather Rescue, the citizen science project which last year processed Ben Nevis and Fort William data from between 1883 and 1904, has now recovered thousands of European observations from past Daily Weather Reports compiled from 1900-1903.
Though reanalysis data of the northern hemisphere back to 1851 have been available for some years the maps don’t give enough detail to be able to compare if an old storm has the same pressure characteristics as a modern storm. Evidence of impacts is restricted to fixed observations such as temperature, rainfall and archive press reports.
Weather Rescue: “We want to learn about the frequency of intense storms in the past to compare with now and these rescued observations will significantly improve our understanding.”
The latest release of data features pressure plots from June 1903 that tie in with the record-breaking 59-hour deluge that left much of the London Borough of Redbridge underwater. The following October, nationally, was the wettest month ever recorded in the UK.
Further recovery of these archived data, with the help of thousands of volunteers, will prove invaluable to our understanding of high-impact weather, and if storms are getting worse.
This latest example of Big Data could also offer huge benefits to the insurance and reinsurance industries, as well as planning engineers, as the resolution of climate models steadily improve.
But on a purely weather reporting scale it should also be possible to one day provide the media with a quickly accessible database of weather events going back over a century, enabling them to judge whether the latest storm really is the worst in 100 years.
In this age of clickbait journalism, however, I’m not holding my breath!
There’s been countless reports about amazing amounts of snow falling across the French, Swiss and Italian Alps to the point where some agencies have been proclaiming that it has been the best season for the white stuff in 30 years.
Extraordinary totals have fallen in some areas. Bourg-St-Maurice, the jumping off point for Savoie resorts including Les Arcs and Val d’Isere, has recorded over 400mm of precipitation over the past 30 days, equating to around 4m of snow at the resort summits.
In Switzerland, large amounts of snow in a short period caused chaos in Zermatt, stranding tourists after the area’s rail services suffered disruption.
Away from the north and west side of the Alps, however, snowfall, while good, has been less impressive the further south and east you look.
30-day precipitation totals reveal that Bourg St Maurice recorded 422mm while Obertauern in the east recorded 99mm.
It is a far cry from last year where some resorts on the southern side of the range were particularly dry. San Bernardino, during the last 30-days, has recorded 179mm of precipitation. During the same period last year just 14.6mm fell!
The outlook for the Alps continues to look unsettled with snow forecast to fall at resorts that are in deficit to the Valais and Savoie areas.
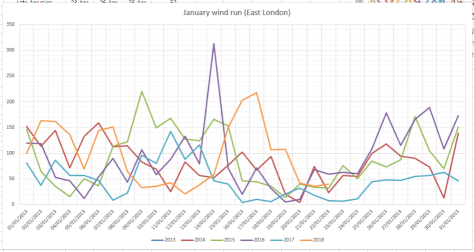
An article by the late meteorologist and broadcaster Philip Eden a number of years ago considered many of these patterns and found that, to varying degrees of reliability, they provided a guide to what the weather would be like at any given time of the year.
Considering climate change I wondered how much these patterns could still be relied on. Using my own pressure, rainfall and ‘wind run’ data (the total amount of daily wind) going back to the start of 2013 I had a look at the singularities for January and February
January patterns at the beginning, middle and end of the month appear to be the most reliable. However, it is only the ‘mid-Jan settled’ period that is most reliable.
The pressure trace most notably shows a general rise from the 17th, the date of last week’s windstorm, consistent with the mid-January settled singularity.Though this year’s ‘settled’ January spell saw rain the past 5 years have seen mostly dry weather.Very little wind has been recorded around January 20th for the past 5 years
The early Feb settled spell occurs with very low probability: just 56 per cent. And this year the pressure, according to the GFS model, plotted below by WXCharts.eu, is predicted to be around 1040mb by February 2!
This animation of the GFS model shows the idea of the Iceland low, which drives our SW’ly type weather, ‘taking a holiday’ to southern Iberia, possibly advecting any cold weather in the east to flood the UK
Looking at the results of the past 5 years it could be concluded that the patterns do still occur but because of the nature of the jet stream, which seems to meander far more readily than in the past, these stormy / quiet episodes are becoming shorter than they were in previous studies.


 Using results published in the paper


 The other result to consider is the influence from ENSO. It seems that when La Nina is ‘too negative’ this can ‘overcook’ proceedings and actually leave our part of the UK with a positive anomaly, as this table shows. It should be noted, however, that thicker Arctic ice in the 1960s would also possibly have had more influence than now.


You must be logged in to post a comment.