Tag Archives: probability

The same old weather every year?

Recurring weather patterns at certain times of the year are well known. The ‘Buchan Cold Spell’, ‘European Monsoon’ and Indian / St Martin’s Summer are all phenomena that have been studied extensively.

An article by the late meteorologist and broadcaster Philip Eden a number of years ago considered many of these patterns and found that, to varying degrees of reliability, they provided a guide to what the weather would be like at any given time of the year.

Considering climate change I wondered how much these patterns could still be relied on. Using my own pressure, rainfall and ‘wind run’ data (the total amount of daily wind) going back to the start of 2013 I had a look at the singularities for January and February

January patterns at the beginning, middle and end of the month appear to be the most reliable. However, it is only the ‘mid-Jan settled’ period that is most reliable.

singulariuty

pressure
The pressure trace most notably shows a general rise from the 17th, the date of last week’s windstorm, consistent with the mid-January settled singularity.
rain
Though this year’s ‘settled’ January spell saw rain the past 5 years have seen mostly dry weather.
windrun
Very little wind has been recorded around January 20th for the past 5 years

The early Feb settled spell occurs with very low probability: just 56 per cent. And this year the pressure, according to the GFS model, plotted below by WXCharts.eu, is predicted to be around 1040mb by February 2!

out to feb 1

new gif
This animation of the GFS model shows the idea of the Iceland low, which drives our SW’ly type weather, ‘taking a holiday’ to southern Iberia, possibly advecting any cold weather in the east to flood the UK

Looking at the results of the past 5 years it could be concluded that the patterns do still occur but because of the nature of the jet stream, which seems to meander far more readily than in the past, these stormy / quiet episodes are becoming shorter than they were in previous studies.


Advertisement

Poor start to June? That’ll be the Euro monsoon

Widespread heavy rain and gales across the UK have made the start of summer feel very unseasonal. But the conditions, which follow an extended period of mostly dry weather, are very typical for early June.

june rainfall with record
The pattern for June over the past 10 years reveals the month often starts unsettled before drying up in the final week

The ‘NW European monsoon’ is one of the most reliable ‘singularities’ on the annual weather calendar. Though it sounds very unscientific that the atmosphere can remember how it behaved on a certain date in previous years much statistical work over the past 170 years highlight tendencies for unusual weather at particular times of the year. These tendencies were first identified by the German climatologist, A.Schmauss, in 1938.

While the pattern isn’t set in stone statistics show that the probability of the euro monsoon occurring between June 1st and 21st is 77 per cent.

GFS rain to 15th
The GFS operational run suggests an unsettled outlook

One of the most notable inclement spells of weather in June happened during the D-Day landings in 1944.

With the changes in ice at the North and South Poles, together with the massive positive temperature anomalies last winter,  it would be thought logical that this would have some bearing on the general pattern this year. But polar ice is only one variable to consider when trying to predict the world’s climate.


Summer forecast 2017: average

The dry nature of spring this year has scuppered a large part of my usual method of trying to predict the summer season.

burning sunset

With El Nino forecast to be neutral I decided to once again rely on pattern matching of meteorological data from this area for March, April and May stretching back to 1797.

The mean for the spring season, the second warmest on record, was 11.9C with 88.6mm of rain and 430.3 hours of sunshine.

If you take into account all years that were within +/- 10 per cent of these figures, for rainfall some 12 ‘best fit’ years emerge. I normally go on to reduce the list further by considering mean temperature but, this year, no figures would remain!
The list of 12 summers, ranging from 1807 through to 2005, saw all manner of summers, including 1808 when early July heat gave way to fierce thunderstorms with hail the size of tennis balls recorded. Only one was a real corker, 1906, but most were fairly nondescript.

As an average this summer could be expressed as: Mean: 17.2C (just below average) Rainfall: 141mm (about average).

Or, expressed in probabilities, I concluded the following:


summer 2017 prob

From the above you could deduce that the next three months will be around average, with average rainfall.

To try to give some idea of what month will have the best weather I’ve broken down the summer into June, July and August probabilities.

Looking at June, considering the unsettled outlook after the weekend, I would guess that a few very warm, thundery spells are possible– though much of any precipitation will stay to our west.June 2017

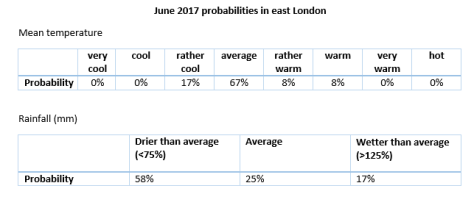
On to July. After an average June I wonder if the ‘return of the westerlies’ will happen just in time to affect this month?

July 2017


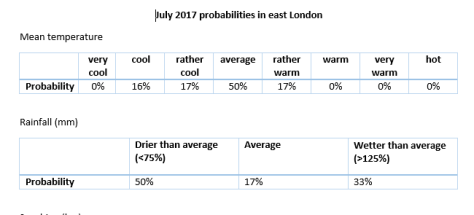
The above chart would suggest that July will be classically average overall. Fine, not too hot spells, with occasional depressions bringing cooler weather and showers.

On to August. Apart from last year this month has been a real disappointment the previous few years. Looking at the probabilities would suggest that August will be the most disappointing month.

august2017

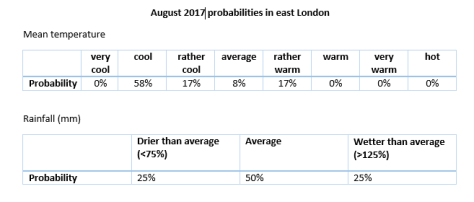
Looking at the above probabilities there seems a fair chance of something cooler than average.

There’s not really much to go on. I note the Met Office is going for ‘warmer than average’ but a look at their methodology and the coming season doesn’t look that exciting.

* Taking into account the fact that temperatures in London are up to 0.66C warmer than they were 100 years ago I have added 0.66C to mean temperatures before 1915.

** Obviously, in the event of a series of direct hits from thunderstorms, my rainfall estimate could be hopelessly short – a symptom of abundant solar energy at this time of year which creates a ‘noisy’ atmosphere compared with winter.

*** The 1981-2010 average mean for summer in this region is 17.6C, with 144.9mm of rain and 564 hours of sunshine

Late autumn to bring chilly shock

The Met Office’s latest outlook for a relatively high chance of cold weather in the early part of winter has set the internet abuzz with talk that the UK is about to experience its coldest winter in years.

The 3-month outlook, produced by the agency for contingency planners, states:

Lower-than-average temperatures are more probable than higher-than-average values. Overall, the probability that the UK-mean temperature for November-December-January will fall into the coldest of our five categories is 30% and the probability that it will fall into the warmest of our five categories is 10% (the 1981-2010 probability for each of these categories is 20%).

THe ‘30% chance’ for temperatures to be in the coldest of five categories is more significant than it would appear: in this three-year period of mild winters that figure usually hovers far lower.

meto7112016
The continent is not yet cold enough to get excited about this synoptic chart for Monday, November 7th

The forecast has drawn obvious comparisons with their 2009 ‘barbecue summer’ f0recast but the GloSea5 model has made infinite advances on the old one.

The Met Office’s method, which includes a combination of data such as QBO, ENSO and ground based observations also agrees with my own method of finding local October singularities back to 1797. This month I found that an average or cold November is most likely: average and cold are both 30 per cent probability. Rather cold and severe are both 20%! There appears no chance of anything mild.

So, we can look forward to ‘a reduction in the normal westerly flow across the UK from the Atlantic, with a greater frequency of northerly or easterly winds’.

But what does this mean for the London area? If the near continent is not cold enough northerly and easterly winds could just bring a succession of cold rain in the form of showers off the North Sea with a higher than average frequency of frosty nights: nothing out of the ordinary for a slightly cooler than average November.

To try and second guess proceedings into December I decided to plot all year singularities to find when the cold spells would most likely fall and how severe they could be.

The results for November look unexciting: the coldest day is likely to be around the 19th with a maximum of 6.9C. The best chance for something cold looks to be in December, around 6th to the 11th – but there again highs of 3C or 4C would mean that any snow would be short lived. There appears to be a warm up in time to scotch hopes of a white Christmas before another cool down toward new year.

So, in conclusion, late autumn / early winter is likely to be a lot colder than the past three years. It is perhaps this fact, together with frosty mornings being common, that will make the season feel colder than it actually is.

I will be publishing my usual winter forecast on December 1st.

maximum
The coldest day in November is likely to be around the 19th


Will England be poleaxed by probability again?

Two anniversaries will stick in the minds of England fans tonight. The first happened this same week, the second happened this same night. Both were national tragedies.

It is 40 years ago almost to the day that a decent England side failed to beat Poland and thus did not qualify for the 1974 World Cup. Jan Tomaszewski, the Polish keeper dismissed as a ‘clown’ before the game by Brian Clough, pulled off a string of outstanding saves during a cold, damp night at Wembley, effectively booking his team’s place in Germany at the expense of Alf Ramsey’s England.

Fourteen years later what was dismissed as an innocuous looking low in the English Channel turned into one of the worst storms in English history, with 100mph winds causing massive devastation across the country and killing 18 people. The Great Storm of 1987  also toppled about 15 million trees, including six of the famous old oaks in the town of Sevenoaks, Kent. A nation was left poleaxed again.

The weather tonight will bear little resemblance to 26 years ago though will not be too dissimilar to that fateful night at Wembley. The damp, cold conditions coming after a week that was dominated by low pressure – the similarities are striking.  october73

So before we write off Poland tonight and believe that England just have to turn up to qualify for Brazil next year bear in mind that football, just like the weather, is about probability. And sometimes those probabilities, no matter how remote, can work against our favour.