This winter is most likely to be on the colder side of average with near normal rainfall.
While the modelled prognosis for the first half of December looks unsettled with an Atlantic influence evolving from the current chilly NW’ly to a mild SW’ly, local analogues of the climate of London suggest the season could be a bit of a rollercoaster with spells of wet, windy and mild weather alternating with dry, calm and cold.
A large factor to consider this winter is the presence of a slight La Nina that is forecast to evolve cooler.
Given the uncertainties involved with the influence of ENSO I’ve decided to stick with analogues found in local data that stretches back to 1797.
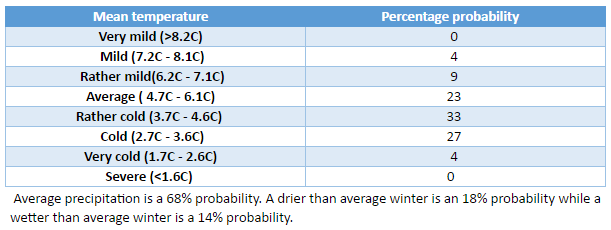
Overall then the probabilities for the next 90 days are.
Mean
Probability
Rainfall
Probability
Mild (>5.9C)
14%
Wet (>178mm)
19%
Average (5.1C – 5.9C)
38%
Average (107-177mm)
62%
Cold (<5.1C)
48%
Dry (>107mm)
19%
The above table doesn’t reveal a great deal in that extremes can be hidden in a month or season that finishes broadly average. So I decided to look closer at the winters that were revealed in the analogues.
December
The first month, as already mentioned, looks like it will be on the mild side with possibly a notable storm off the Atlantic before things calm down over Christmas – the period between Boxing Day and New Year’s Eve possibly presenting the best chance of any lying snow in this region.
The below graphs are a smoothed representation of the years revealed in the analogues most similar to this autumn.
What is probably most interesting is that the analogues that shared a similar ENSO / La Nina index to this autumn tended to ‘turbo charge’ any yo-yoing in the weather type, be that super-mild or abnormal cold.
December probabilties for maxima: Mild: 48% Average: 19% Cold: 33%
And precipitation. Wet: 33% Average: 29% Dry: 38%
So, the month overall will be mild and slightly dry
January
The first month of 2022 probably represents this region’s best chance of lying snow this winter. A mild start perhaps with a falling off of temperatures in the final third of the month and a cold spell of a week or so. As with December the influence of La Nina could tend to boost the swings in the pattern.
January probabilties for maxima: Mild: 33% Average: 10% Cold: 57%
And precipitation. Wet: 19% Average: 43% Dry: 38%
Greatest chances for January, then, are cold with average precipitation.
February
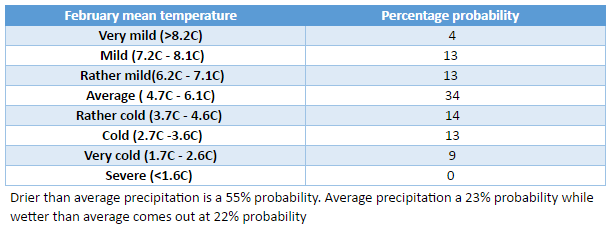
The second month may see a slight return of the cold spell in January before temperatures recover for a mild and wet spell in the second half.
February probabilities for maxima. Mild: 33% Average: 15% Cold: 52%
And precipitation. Wet: 38% Average: 38% Dry: 24%
The stats suggest on the cold side overall with average to above average rainfall. Perhaps the depth of the cold skewing any very mild second half of the month?
The extremes that no-one can forecast
As well as the very mild winter of 1989/90 the analogues also revealed the very cold winter of 1978/79. There were others but their occurence makes the probability of a repeat at either extreme at less than 10 per cent.
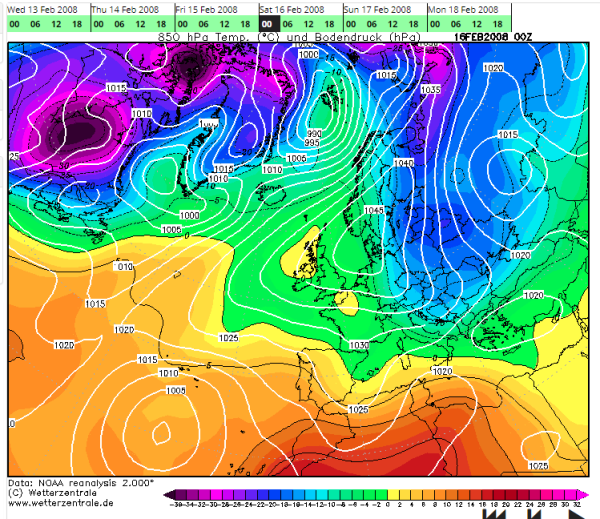
Recent model output that has many bullishly predicting a cold spell in February reminds me of the winter of 2008 when the likes of the GFS and ECMWF models kept teasing us that a Scandinavian high pressure was imminent.
This rare pattern brings the south-east its coldest weather in winter, in the past bringing the January 1987 and February 1991 cold spells.
Midnight on February 16th 2008 just before the high moved south, taking its cold weather into the Balkans
A look back at the pressure patterns in 2008 show that high pressure was in the ‘right place’ between the 11th and 16th but, just as -10C uppers looked poised to flood across from eastern Europe, the high pressure collapsed south, leaving the UK in a SE’ly flow off a mild France.
There was snow in 2008 but it didn’t arrive until the spring, in late March and, the best fall, in early April when I remember waking up on the 6th to a 5cm covering that mostly melted by lunchtime.
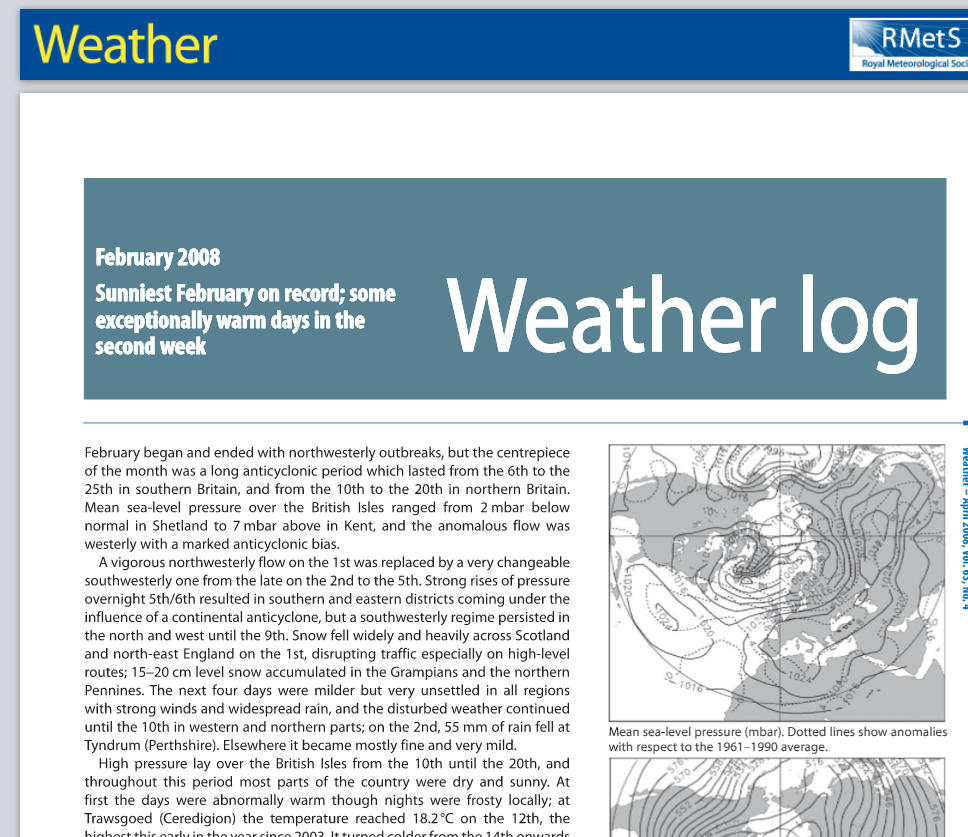
I suppose the one silver lining for any coldies reading this is that February 2008 was the sunniest on record.
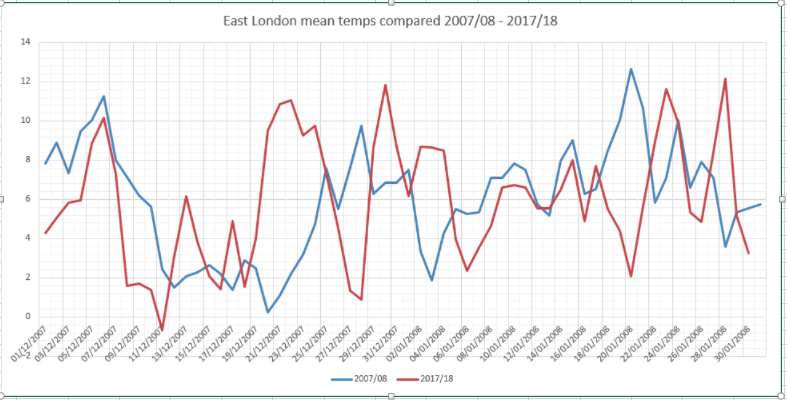
The mean temperature for December 1st – January 30th is 6C for both 2007/08 and 2017/18
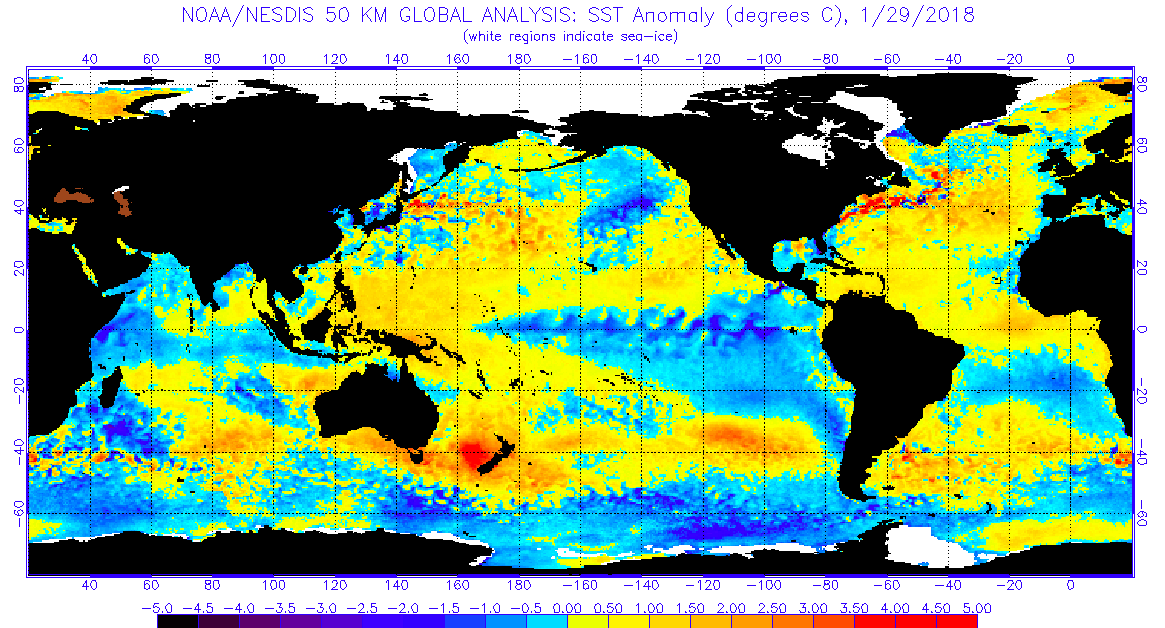
The maps below show the sea surface temperature anomalies. A slight La Nina on both. ENSO, considering my winter forecast, has been the best guide for how this winter has so-far panned out – front loaded.
Philip Eden’s column in the journal Weather showed that there was some wintry weather in February 2008 but it was restricted to the north of England northwards
* The focus of these blogs is usually on what the weather was, or may be, like in my backyard – though they usually broadly apply to anywhere in the south-east that is close to sea level.
This weekend marks the halfway point through winter. Though December brought some snow January has been broadly average – really cold air has been absent with only one air frost recorded this month.
The cloudy, anticyclonic type weather is about to be replaced, however, with cold, polar maritime air this week set to flood down from the north-west.
Since December 1st, Wanstead has recorded 12 air frosts – about average. The coldest night was just -3.7C. The current mean temperature this winter to January 14th is 5.7C with rainfall 111mm – statistics that are remarkably similar to the winters of 2012/13 and 1990/91. Both those seasons were followed by cold late winters, February 1991 saw some of the deepest snow that I’ve ever seen in the south-east; the mean temp for that February finished 1.6C, the 14th coldest in the local series going back to 1797.
Using my method for finding patterns stretching back over 50 years to forecast this winter I picked out years that were +/- 10% of the 2017/18 total rainfall. From these I then weeded out the seasons where the average temperature was +/- 10% of the 2017/18 mean.
This gave a list of just two other winters with similar temperature and rainfall. Both winters had above average ‘snow lying’ days, the long terms average for this area being six.
Before any readers accuse me of going all Daily Express with the title of this blog I would emphasise that this piece doesn’t echo the latest long-term output from the models, which are in a state of flux, caused mostly by the evolution of the explosive cyclogenesis expected midweek. It is simply a reflection of what the local data is telling me.
A 100% guarantee of snow isn’t such a fantastical claim as, during the past 10 years, there is only one winter when no snow fell or was lying at 9am!
In terms of the rest of the winter, outside of the models, I would expect a couple more snowfall episodes, similar to the ones we had in January and February 2013. A repeat of February 1991, while not impossible, looks unlikely – there seems to be far too much energy coming from the Atlantic to allow the all important Scandinavian / Russian high to form and exert its influence far enough west for long-lasting cold and snow.
The month, which had started mild, completely changed during the weekend of the 8th as a SE’ly wind set in. Hard frosts and snow became a daily feature with considerable falls across Scotland, disrupting mail and causing hardship for people and livestock.
By the 20th some of the lowest temperatures of the 19th century were recorded in London. At Greenwich -16C (-11C at midday) was reported at sunrise, while Blackheath saw -20C and Beckenham -26C. By the 27th the Thames at Greenwich was completely covered with ice at high water and elsewhere in the estuary ice floes were reported.
In some parts of northern Scotland, snow was noted to fall on most days between January 8th and May 3rd. Snow was also noted in upland areas of NE Scotland in June.
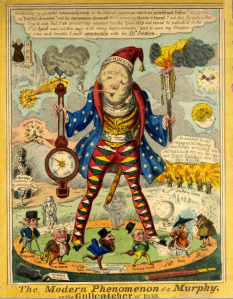
‘Murphy’s Winter’ as it became known made the astrologer from Cork a small fortune from the sale of an almanac, the contents of which also successfully listed the actual date when the frost would be at its most severe.
It was possibly the first long-range weather prediction that people through the ages seem to love, whether they are right or wrong.
Many characters have emerged over the years. Yorkshire’s Bill Foggitt, who used natural signals and animal behaviour during the previous autumn, was popular in the 1980s especially when he made a prediction of a harsh winter.
Others, including the Daily Express, who probably shouldn’t be mentioned in the same breath as Foggitt, are more about the clicks they hope to generate for their publishers than any earnest attempt at being right.
The mean temperature locally in January 1838 was -1.5C, the second coldest January in a series going back to 1797, and as cold as January 1963.
Sunshine was a dominant feature of January 2017 in east London thanks to a long-lasting anticyclone centred over the near continent that established a feed of stable, dry air.
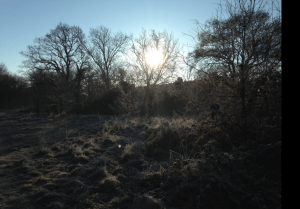
A frosty morning in Wanstead Park
It was a cold month, the mean temperature of 3.4C (1.8C below the 1981-2010 average) made it the coldest for seven years, marginally colder than the snowy January in 2013.
Though many days were dry it was also a wetter than average month with 71.5mm of precipitation recorded (134% of average) and the wettest for three years.
There were 73.8 hours of sunshine (147% of average) – the 10th equal sunniest January since 1797.
Cumulonimbus and hail were observed on 28th
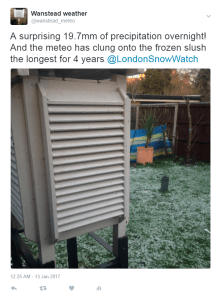
The wettest day was on the 11th /12th when rain and snow associated with a LP centre that dived south-east dumped 19.7mm. This turned to snow though by 9am only 0.5cm lay in my garden. The warmest day occurred on the 11th with 10.9C recorded. The coldest maxima occurred just before obs time on the 26th when 0.6C was reached, narrowly missing an ice day. The lowest temperature occurred in the early hours of the 21st when -6.7C was recorded, the coldest minimum since January 2013.
The sunniest days were on the 18th, 20th and 21st when eight hours of sunshine were recorded.
Snow fell on 4 days and lay on 1 day. Air frosts: 14, Ground frosts: 19
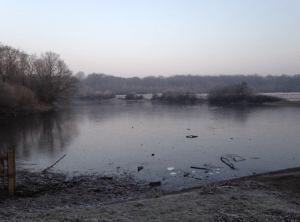
Ice on the Heronry pond was quite thick at one point
So what has February got in store. Models on the 1st suggest that after a stormy start the weather will settle down with high pressure re-establishing itself on the continent. Operational runs suggest the position of this high will again draw in very cold upper air, heralding another cold spell that this time could be more unstable with snow – thanks to the position of the anticyclone being further north than it was in January. There are also suggestions that a sudden stratospheric warming event currently underway may also disrupt the polar vortex which *could* lead to any cold around mid-month being prolonged. It is a big if, however, and it is impossible to know the final position of any anticyclone: resultant weather could be fairly cold and benign or severe and snowy.
Just one morning had ‘snow lying’ at 9am on 12th
My method of prediction for the month as a whole gives very little information because January was unusually wet for a cold month. After this weekend’s unsettled spell perhaps February will continue in the same vein as January: 1-2C colder than normal but predominantly dry.
So, to sum up, we’re looking at a mean of 4C, rainfall: 15mm, sunshine: 60hrs.
My forecast last month was poor: predicted mean 4.4C (result 3.4C). Rainfall: 55mm (result 71.5 mm). Sunshine: 39hrs (result 73.8hrs)
Here follows the full weather diary for January…Full stats for the month here:http://1drv.ms/1rSfT7Y
1st: Cloudy start with rain pushing in from 1.30pm. A precipitous fall in temp about 2.15pm.
2nd: Sunny all day with just a few cumulus. Cold and frosty overnight.
3rd: Sunny, hazy start – the cloud building to 10.30am. Afternoon and evening felt cold.
4th: Cloudy and mild start. Brightness increased through the day though colder air arrived around dusk.
5th: Sunny, frosty start with a few clouds from time to time. The frost persisted all day on the grass.
6th: Sunny and cold start, frost lifted at 11am to leave mild-feeling early afternoon. Cloud thickened with rain arriving just before 4pm and lasting a couple of hours. Temp increased through the night.
7th: Cloudy and mild start.
8th: Cloudy and very misty on road to High Beach. Some bright spells from 10.30am. Clouding in again in the afternoon but mild.
9th: Cloudy, damp start with rain spreading in at midday then sporadically into the afternoon. Clear spells overnight.
10th: Cloudy start with odd brightness near noon.
11th: Sunny sart with just a few cumulus, this cumulus increased from time to time.
12th: Cloudy and cooler start. Started spitting at 11am before main rain arrived at noon – then rained through the afternoon and temp dropped. Reports of snow in Hampshire at 1650z. Snow in Aldersbrook at 6pm which gave a covering of icy snow and slush which lasted through until 9am on grass and cars. Just over 50% of grass covered.
13th: Bright start, snow flurries spreading in at 9.30am with heavier burst at 10.10am – snow lasted till around noon then was just cloudy – no further accumulation. Cold overnight though too much breeze for air frost.
14th: Cloudy start with some drizzle at noon. Clearing afternoon with early ground frost before turning cloudy at 1am with rain in the early hours.
15th: Light rain to start and falling on and off until 3pm.
16th: Light rain to start which went on into the morning thanks to a conveyor belt of rain – the result of being on the boundary of two air masses.
17th: Bright start with cloud and light frost, the cloud clearing with cold front off the continent. Cold, crisp afternoon followed with frost soon after dark.
18th: Sunny, very cold start with jet contrails across the sky. Sunny all day thereafter with frost after dark – not as cold as previous night – minimum was at 9am previous day.
19th: Sunny start with a few cirrus around that made for a spectacular dawn. Temp warmed up quicker than previous day with frost lifting. Cold again overnight though agitation of the lower layers prevented temp falling further than 4.1C.
20th: Sunny, very cold start with frost.
21st: Sunny, very cold start with sunshine all day, Frost lingering all day in the shade – the ground now rock hard. Coldest night since January 2013.
22nd: Sunny, very cold start with heavy frost. The frost lingered all day in the shade. Turning misty at dusk with dense patches of freezing fog developing. Another moderate frost with a 18-06 low of -4.8C.
23rd: Foggy start with dense, freezing patches on Wanstead Flats. Thinner in the village though still noticeable. The fog was present into Rush Green.
24th: Misty start with remnants of thick fog patches seen on the Flats. Thereafter sunny and pleasant in the sunshine.
25th: Foggy start though some lifted but still left misty morning. Feeling cold as wind increased. Some flurries of snow at 8.30am.
26th: Cloudy and cold, feeling raw in the wind with flurries of snow that settled on pavements in Wanstead. Cold and raw through the day with odd clear interval – temp rose to 0.2C just before dusk so no ice day. Sky cleared overnight with frost before cloud rolled in with odd flake of snow.
27th: Bright but with cloud thickening at 9.30am with moderate shower, then brighter. Sharp shower at 1510 with <5mm hail and fell at 20mm/hr. Some spectacular cumulonimbus.
28th: Cloudy start though with some brightness until 11am.
29th: Cloudy, quiet weather all day.
30th: Cloudy, uninspiring day. Some light rain at 2am.
31st: Cloudy with rain looking likely. Rain arrived in evening and fell intermittently through the night and after dawn.
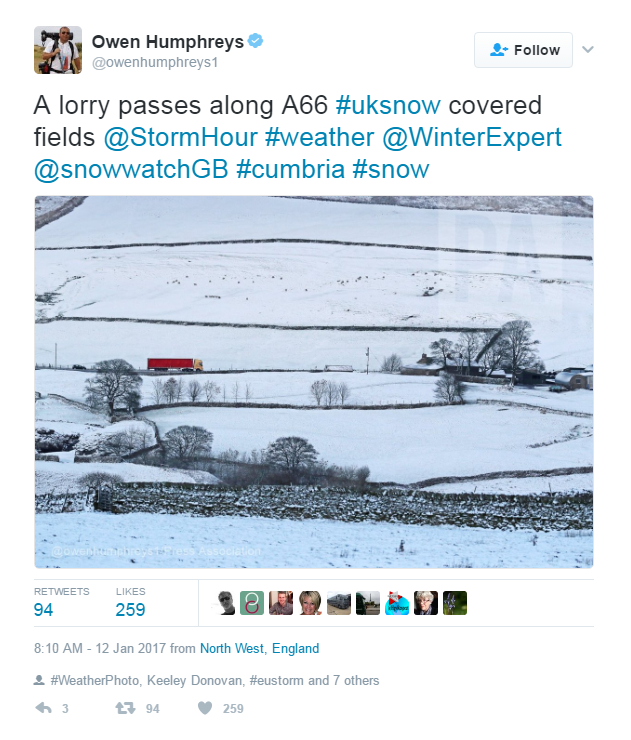
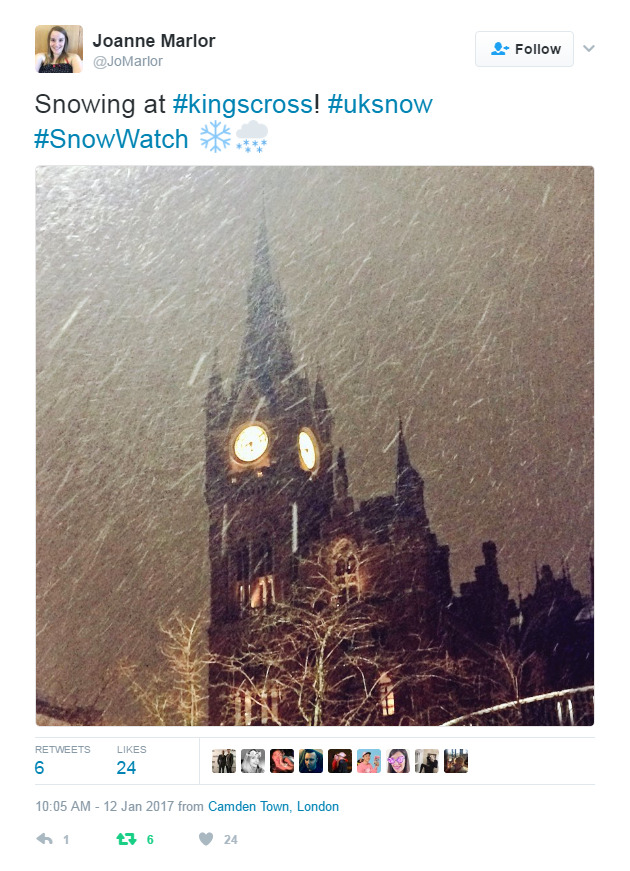
There were some notable weather tweets from around the UK.
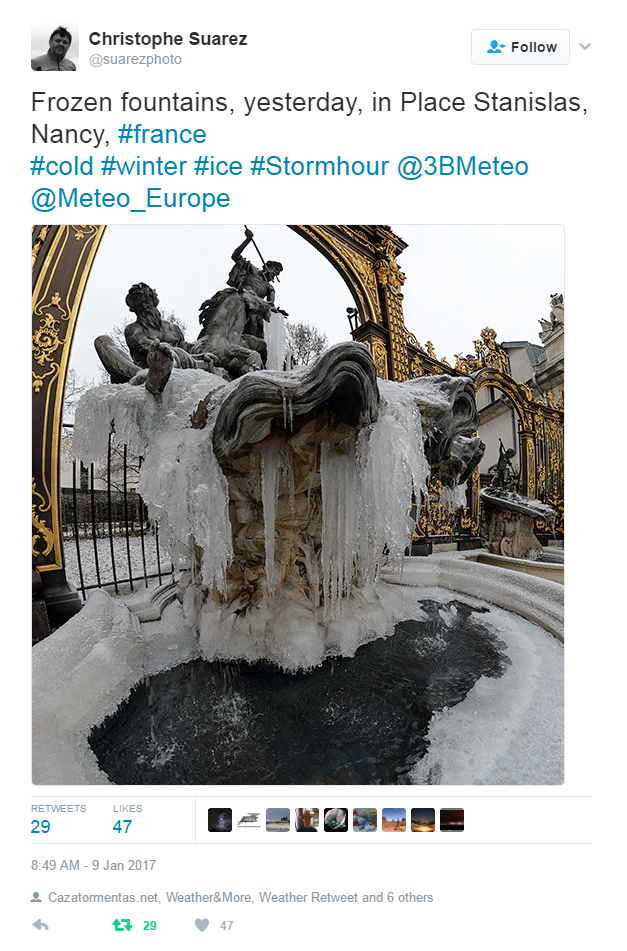
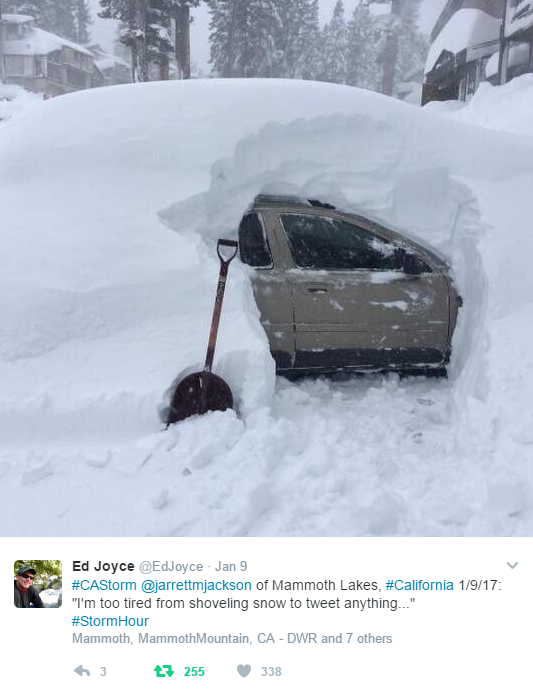
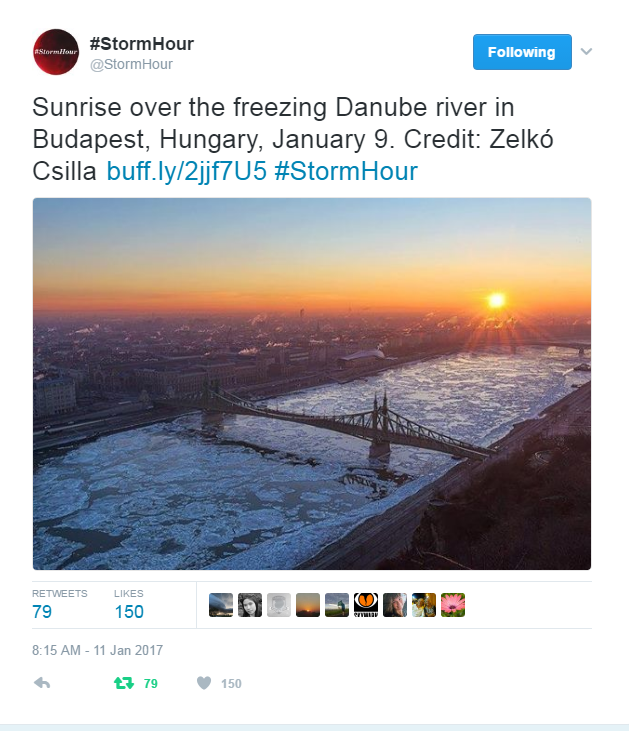
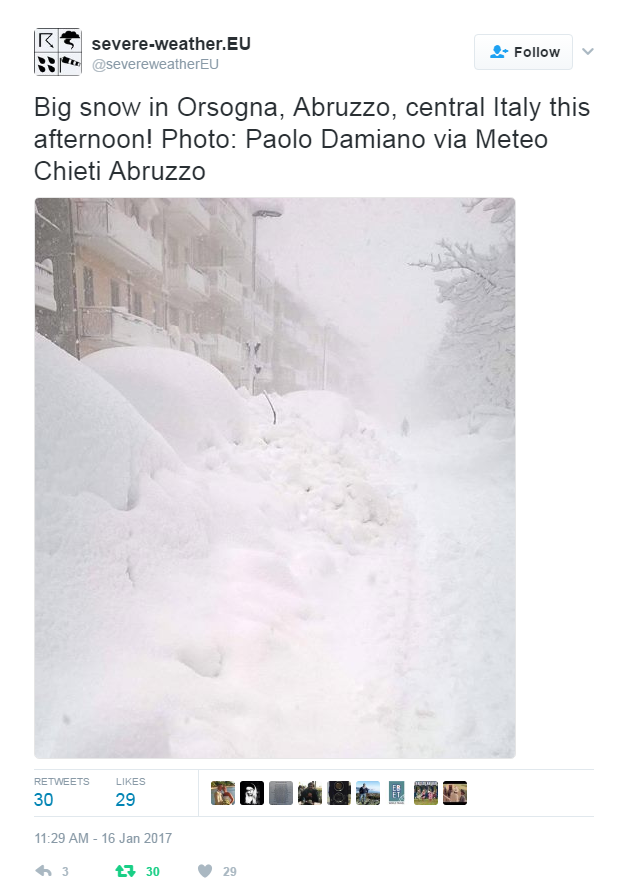
It was also a month of extremes in Europe and elsewhere. Here are a few examples I tweeted throughout January.
Mammoth has recorded over 20ft of snow during January
Frost still lingers on my lawn as I write this winter forecast on the last day of the meteorological autumn. Last night’s minimum was -6.1C, the coldest night this year and, indeed, colder than any night last winter.
It would be very easy to get caught up in the hysteria that happens every November of what the winter will bring. Most of the hysteria comes from ‘coldies’, those folk that hope every winter will be the coldest and snowiest on record. I count myself among them.
The north-west of England looks around 10C above average on December 9
But, despite hints from BBC weather forecasters that something maybe afoot in terms of something colder than usual from mid-December, years of disappointment have taught me to just take winter as it comes. Meteorological models this morning look anomalously warm for the first half of December, the UK being on the warm side of an anticyclone centred over France – the theme of so many winters I can remember.
The current phases of ENSO and QBO suggest that their influence on our winter this year will be far less marked than last year. Looking at teleconnections with a slight La Nina and the current QBO cycle have revealed winters that were fairly uninspiring though by no means write-offs for snow, two examples in the case of QBO being 1985/86 and 1990/91 – both had very cold Februaries.
Before I got too bogged down with trying to find patterns here I decided to move on to my more traditional pattern-matching.
Before I trawled through the figures my initial gut reaction to this winter was that it would be the coldest for at least four years – a not-too-difficult feat giving the mildness of the last three winters which saw very little in the way of snow.
The overall mean temperature for December, January and February came out at as4.2C – 1.2C colder than the 1981-2010 average, with average precipitation.
A rather cold winter, over three months doesn’t tell you much. A very mild and stormy December could mask a dry and notably cold February. This makes it worth looking at the individual months of each winter.
There is a lot of spread in the above tables. Considering them altogether I would guess winter will unfold in the following way:
December to start mild, possibly becoming very mild, before beginning to turn very cold mid-month. This pattern will persist, with varying intensity through into January which could also be very cold. Milder conditions to follow in February though this will probably end a fairly average month and drier after a slightly wetter than average December and average January.
As well as my method of using rainfall and temperature I also considered other methods. One was Russian research that states that the weather pattern in the winter will be the opposite to the weather on September 17th and November 7th. This autumn September 17th was N’ly and November 7th was NNW’ly. So, this would suggest a continental flow from S and SSE.
You can read the method of how I reached my conclusion here.
The Met Office’s latest outlook for a relatively high chance of cold weather in the early part of winter has set the internet abuzz with talk that the UK is about to experience its coldest winter in years.
The 3-month outlook, produced by the agency for contingency planners, states:
Lower-than-average temperatures are more probable than higher-than-average values. Overall, the probability that the UK-mean temperature for November-December-January will fall into the coldest of our five categories is 30% and the probability that it will fall into the warmest of our five categories is 10% (the 1981-2010 probability for each of these categories is 20%).
THe ‘30% chance’ for temperatures to be in the coldest of five categories is more significant than it would appear: in this three-year period of mild winters that figure usually hovers far lower.
The continent is not yet cold enough to get excited about this synoptic chart for Monday, November 7th
The Met Office’s method, which includes a combination of data such as QBO, ENSO and ground based observations also agrees with my own method of finding local October singularities back to 1797. This month I found that an average or cold November is most likely: average and cold are both 30 per cent probability. Rather cold and severe are both 20%! There appears no chance of anything mild.
So, we can look forward to ‘a reduction in the normal westerly flow across the UK from the Atlantic, with a greater frequency of northerly or easterly winds’.
But what does this mean for the London area? If the near continent is not cold enough northerly and easterly winds could just bring a succession of cold rain in the form of showers off the North Sea with a higher than average frequency of frosty nights: nothing out of the ordinary for a slightly cooler than average November.
To try and second guess proceedings into December I decided to plot all year singularities to find when the cold spells would most likely fall and how severe they could be.
The results for November look unexciting: the coldest day is likely to be around the 19th with a maximum of 6.9C. The best chance for something cold looks to be in December, around 6th to the 11th – but there again highs of 3C or 4C would mean that any snow would be short lived. There appears to be a warm up in time to scotch hopes of a white Christmas before another cool down toward new year.
So, in conclusion, late autumn / early winter is likely to be a lot colder than the past three years. It is perhaps this fact, together with frosty mornings being common, that will make the season feel colder than it actually is.
I will be publishing my usual winter forecast on December 1st.
The coldest day in November is likely to be around the 19th
Sections of the tabloid media have been going into overdrive these past couple of weeks with tales that the UK will soon be in the grip of an Arctic freeze – one headline in the Daily Express boasted that parts of the UK were in for FOUR MONTHS OF SNOW.
The Daily Express ‘forecast’ was published at the end of September
These stories are nothing new though they seem to be published earlier and earlier in the autumn. By the time we reach November – once the traditional time when winter forecasts started appearing – the tabloids have already turned their attentions to spring. Much of it is just ‘clickbait’ – a means for publishers to prove their stories are being read to keep their advertisers happy, a symptom of an industry in financial dire straits.
There will be snow somewhere in the UK during the next five months but predicting heavy snowfall in a given area, such as London, is impossible. But given the outrageous claims at such a long way from the start of the season on December 1st I decided to have a look to see if there is anything wintry on the horizon.
I started by comparing a range of historic datasets, including quasi-biennial oscillation (QBO) and el niño–southern oscillation (ENSO), against monthly mean temperature and rainfall anomalies. Because ENSO data only goes back to 1950 the findings are obviously far more restricted than my winter forecast method which uses local data going back to 1797.
The results of my data trawl are underwhelming. The best fit years were as follows:
For anyone who likes snow the above is not encouraging, however, given the past year which has seen several daily and monthly records shattered, including a record warm December, who’s to say that recent warm temperatures will suddenly swing the other way.
The above table would also suggest that the coming winter will be colder and snowier than the previous three – but that gives little away given how mild the past three winters have been.
October 2016 has seen a strong blocking high become established over Scandinavia, the earliest this has happened since 1881.
A study of mean temperature anomalies in London since 1950 suggest that sudden swings, both positive and negative, are becoming more likely. Last month was the fifth month in a row that I recorded a positive anomaly – the longer this goes on the more likely it is the mean could turn negative – though bear in mind that I have recorded 12 months in a row of positive anomalies, from February 2011 until January 2012.
Current weather also suggests that something maybe afoot with the earliest establishment of a strong anticyclone over Norway (the fabled Scandinavian high) since 1881! This weather pattern gives the south-east its best chance of snow with the feed of cold air often coming all the way from Siberia. Time and again, however, I’ve seen these patterns break down in November just as everyone starts talking about an imminent severe winter. There is more than an element of truth to the saying:
Ice in November to bear a duck, rest of winter will be slush and muck
In conclusion, while the early figures look bleak for snow in the low-lying south-east, it is still far too early to tell if the coming winter will be mild or cold.
I don’t usually bother trying to forecast autumn or spring given that there is far less interest in them than winter and summer. However, given the heightened interest in this year’s hurricane season and emboldened, perhaps foolishly, by my reasonably correct summer forecast I decided to have a look at the stats and see if I can find any signs where autumn in east London may be headed.
Using the method for my seasonal forecasts resulted in a shortlist of 26 summers that were similar to 2016.
Because the NOAA ENSO index only goes back to the 1950 I decided to disregard all years prior to this date to try to make any results more reliable. This narrowed down the list to 11 years.
With these considered I then searched for years that had a similar ENSO index to June (0.1 – neutral) with a tendency to turn negative (La Nina). This narrowed the field further to three years: 1999, 1992 and 1964. However, the only year that is showing signs of being similar with regard to where the ENSO index is forecast to be heading is 1964.
Although, so far, there has been an uptick in hurricane activity similar to 1964 there is, of course, the added consideration that Saharan dust is playing a part in impeding the formation of these tropical storms in the Gulf of Mexico – something the weather models seem to struggle to get a grip on.
With this in mind perhaps there will also be lower than usual instances of these storms crossing the Atlantic to affect the UK: hence a quiet autumn though, on a national scale, interpersed with the odd interest from the Atlantic. In London, perhaps we can expect something very similar to what is listed on the excellent website: http://www.london-weather.eu/article.103.html
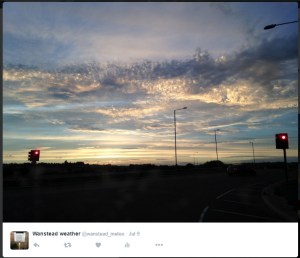
There was plenty of interest in the weather last month even though the overall stats suggest July 2016 wasn’t that remarkable.
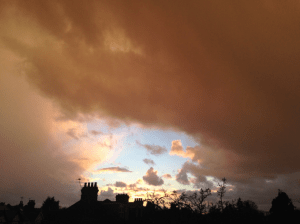
The sunset on July 9th was spectacular
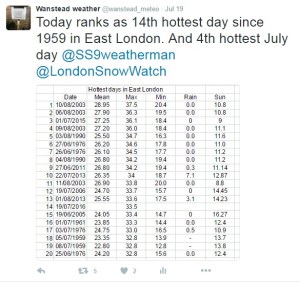
Most notable was temperature: the warmest minimum on record for this area (21.1C) was recorded during the early hours of the 20th – coming hours after the hottest day of the year: 33.5C – the 14th hottest day on record. The mean temperature of 19.5C was a degree warmer than average, the 18th warmest July since 1797.
Rainfall was very sparse. A total of 17.3mm fell during the month, that’s 40 per cent of average, the driest for six years and the 19th driest in the series going back to 1797.
After a very dull start to the month sunshine was always going to struggle: just under 172 hours were recorded – that’s 89 per cent of average and marginally down on last July.
Air frosts: 0, Ground frosts: 0
The temperature didn’t fall below 21.1C on the night of 19th July, making it the warmest minimum on record in this area back to 1959
So what has August in store weatherwise? The models on the 1st suggest the month will start with a mixture of sunshine and showers. At the end of this week there are indications of a change to warm and later very warm weather.
Beyond the grasp of the models my long range outlook method is hampered this month because of the very dry July. However, the data I do have suggests a rather warm month at 50 per cent probability. The ‘worst case’ scenario suggests something average, a contrast to the past couple of Augusts which have been poor. Perhaps we can look forward to another reasonable summer month, defined by plenty of fine, at times hot, weather – though anyone looking for unending days of 30C and higher will be disappointed.
A dryer than average month (possibly very dry) looks most likely at 50% probability. A very sunny month looks most probable.
So to sum up: mean 19C (0.8C above average), rainfall 30.3mm (60%), sunshine 239 hours (123%).
My July outlook for temperature was good. I predicted a mean of 18.8C (outcome: 19.5C). Rainfall was very poor: 50mm (outcome: 17.3mm). Sunshine not badr: 171.9 hours (outcome: 190 hours).
Here follows the full weather diary for July…Full stats for the month here:http://1drv.ms/1rSfT7Y
1st: Cloudy with sunny intervals. Some sharp showers.
2nd: Bright start though breezy. Very heavy shower at 1740.
3rd: Sunny though with lots of cumulus.
4th: Sunny, gin clear start though cumulus rolled in at 1.30pm.
5th: Cloudy start with very brief, very light drizzle though with sunny breaks developing.
6th: Hazy mix of cirrus and cumulus gradually decreased to a clear sky by 1pm. More cumulus bubbled up later but still mostly sunny and low humidity.
7th: Sunny start with lots of cumulus, cirrus and stratus around. Sunny spells through the day.
8th: Cloudy and breezy start.
9th: Bright start with sunny spells but also lots of cloud. Amazing sunset with fronts coming in.
1oth: Cloudy start with light rain spreading in but only lasting for 40 minutes. Some sunshine in the afternoon though was breezy.
11th: Cloudy start with heavy showers early afternoon.
12th: Sunny start though with plenty of cloud which bubbled up and gave heavy showers from 11.30am. More showers in the afternoon – miserable.
13th: Bright and sunny to start that cloud gradually built before heavy showers hit at 2pm, these lighter over Aldersbrook.
14th: Sunny, bright start with sunny spells, tending to turn cloudier.
15th: Bright start but cloud piled in and breeze picked up.
16th: Sunny start with lots of cirro-cumulus. Cloud tended to build at times and a front passed over at 4pm. Warm evening and night.
17th: Bright start though with lots of heavy cumulus around. This tended to break up at intervals during the day, making it feel hot in the sun because of the high humidity.
18th: Sunny start with patchy cirrus and cumulus. This decreased as day wore on leaving a hot day. Felt almost airless with variable cloud.
19th: Sunny with decreasing cirrus to start to leave a gin clear day. Breeze picked up at noon meaning it wasn’t as warm as it could have been.
20th: Sunny but hazy start but with more of a breeze than yesterday. Cloud tended to fill in but then burnt off to leave another hot day.
21st: Sunny but cooler start than yesterday with lots of milky cumulus around.
22nd: Cloudy start after overnight rain. Sun breaking through at 12.30pm.
23rd: Cloudy start with spots of drizzle at 11am then slowy getting brighter with evening sunshine.
24th: Cloudy start with early showers breaking to sunny spells.
25th: Sunny start with variable amounts of cloud through the day. Feeling cooler.
26th: Sunny start though with cloud bubbling up through the morning. Overcast by 2pm.
27th: Cloudy and damp with light rain before and after obs time.
28th: Sunny periods with variable cumulus
29th: Cloudy start with brief rain showers in Chigwell. Sky broke to allow long sunny spells before it clouded over again. Rain shower at 9pm.
30th: Cloudy and overcast start. Long sunny spells into the afternoon.
31st: Sunny start though more cloud tending to bubble up in the afternoon.


 The overall mean temperature for December, January and February came out at as


 od for my seasonal forecasts resulted in a shortlist of 26 summers that were similar to 2016.
 In London, perhaps we can expect something very similar to what is listed on the excellent website: http://www.london-weather.eu/article.103.html


 My July outlook for temperature was good. I predicted a mean of 18.8C (outcome: 19.5C). Rainfall was very poor: 50mm (outcome: 17.3mm). Sunshine not badr: 171.9 hours (outcome: 190 hours).

You must be logged in to post a comment.