I hadn’t heard of Brettenham before this Suffolk village recorded over 100mm of rain from the convergence line event on the afternoon of Sunday, July 26th.
A former Environment Agency observer recorded 181.3mm in 1hr 40mins (1640-1820).
Notable on its own but even more so given that Wattisham, an official station 7.3km to the south-east, recorded just 2.4mm at the same time.
Whilst intensely isolated events happen, and often go unnoticed if they occur in uninhabited areas, this one seems more severe than what has previously been recorded.
The greatest 24hr rainfall recorded, according to Robin Stirling’s Weather of Britain, was 279mm on July 18th 1955 in Dorset. The rainfall far more widespread than the event on Sunday.
The event in Suffolk was covered by the East Anglian Daily Times. A report that mentions ‘rain falling in sheets and roads turned into rivers’ can be found here.
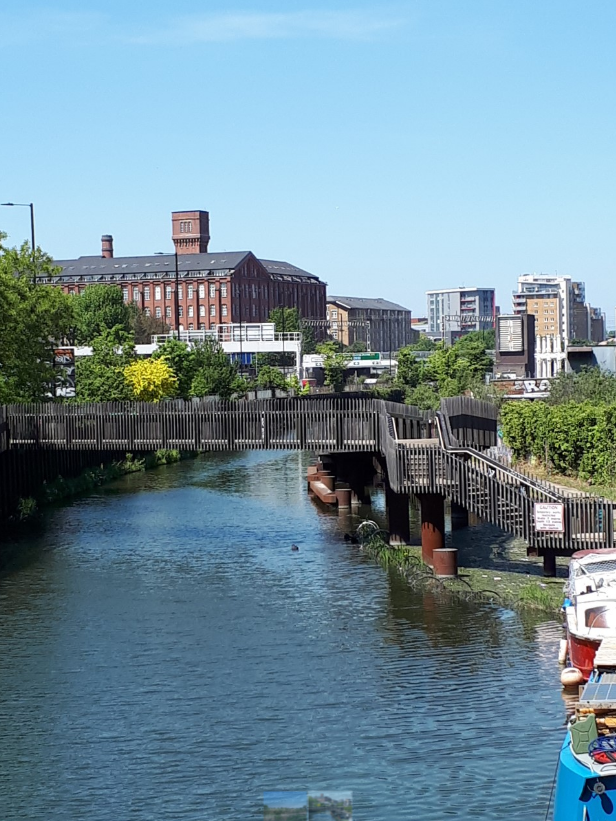
It is 194 years ago this week that the River Lea burst its banks in the Stratford area leading to an ‘inland sea’ forming on nearby marshland.
Days of heavy rain that started on the 12th sent the water rising to record levels, the height was 2.5 inches higher than the devastating flood of 1809.
Luke Howard, in an entry in The Climate of London, had measured nearly three inches (74mm) of rain by the 16th and was expecting a flood:
“Towards evening the waters rose suddenly in the Lea and passing over all the banks of the level soon filled the marshes and in the course of the night rose to an unprecedented height being two inches and a half higher than in the flood of 1809.
The houses in the marshes south of the road were filled nearly to the chamber floors and some of the inmates removed with great difficulty. The flood remained stationary for nearly 24 hours. On the 17th in the afternoon it began very gradually to subside and on the 18th in the morning was much abated; the marshes still presenting the appearance of a sea the tops of the trees appearing in places only.”
Though there are no reanalysis charts from the time Howard’s daily entries state that pressure was low with the wind in the north-east, a classic pattern where depressions can move along the Channel before getting ‘stuck’ in the North Sea. A similar pattern with an almost identical amount of rain caused severe flooding in June 1903.
There was some 96mm of rain recorded during May 1824, locally the 11th wettest back to 1797. There have been wetter Mays since but, thanks to massive investment in the River Lea Navigation , prompted by more devastating floods in 1947, widespread flooding is a thing of the past.
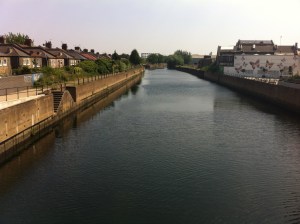
The area around where Luke Howard’s factory once stood
Walthamstow Marshes were flooded to a depth so great that many trees briefly disappeared
“Worst floods ever!” Hyperbolic reporting of weather events is nothing new; whenever the UK is hit by the latest named storm breathless news anchors often try to portray atrocious conditions as ‘unprecedented’. This may soon change thanks to a project that uses citizen science.
Operation Weather Rescue, the citizen science project which last year processed Ben Nevis and Fort William data from between 1883 and 1904, has now recovered thousands of European observations from past Daily Weather Reports compiled from 1900-1903.
Though reanalysis data of the northern hemisphere back to 1851 have been available for some years the maps don’t give enough detail to be able to compare if an old storm has the same pressure characteristics as a modern storm. Evidence of impacts is restricted to fixed observations such as temperature, rainfall and archive press reports.
Weather Rescue: “We want to learn about the frequency of intense storms in the past to compare with now and these rescued observations will significantly improve our understanding.”
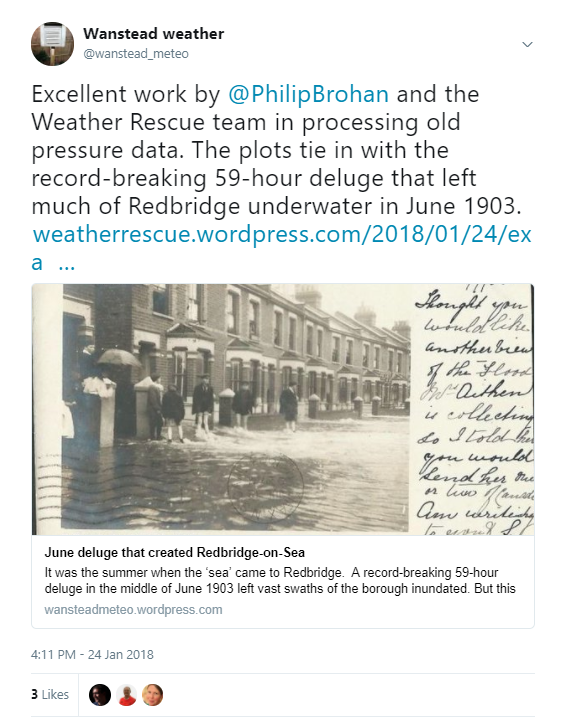
The latest release of data features pressure plots from June 1903 that tie in with the record-breaking 59-hour deluge that left much of the London Borough of Redbridge underwater. The following October, nationally, was the wettest month ever recorded in the UK.
Further recovery of these archived data, with the help of thousands of volunteers, will prove invaluable to our understanding of high-impact weather, and if storms are getting worse.
This latest example of Big Data could also offer huge benefits to the insurance and reinsurance industries, as well as planning engineers, as the resolution of climate models steadily improve.
But on a purely weather reporting scale it should also be possible to one day provide the media with a quickly accessible database of weather events going back over a century, enabling them to judge whether the latest storm really is the worst in 100 years.
In this age of clickbait journalism, however, I’m not holding my breath!
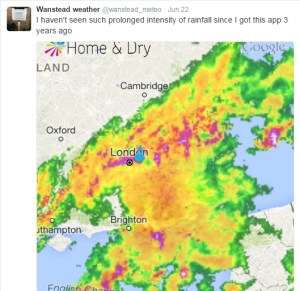
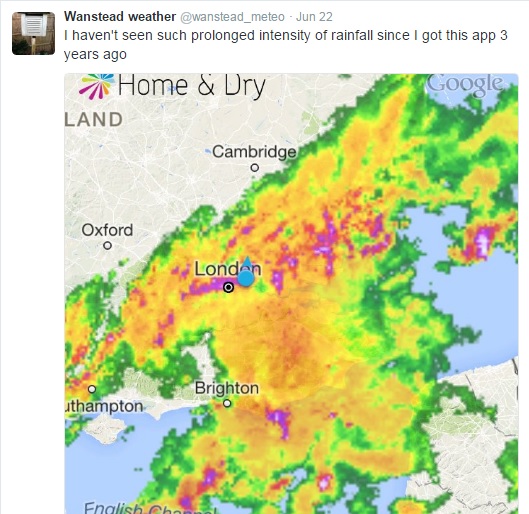
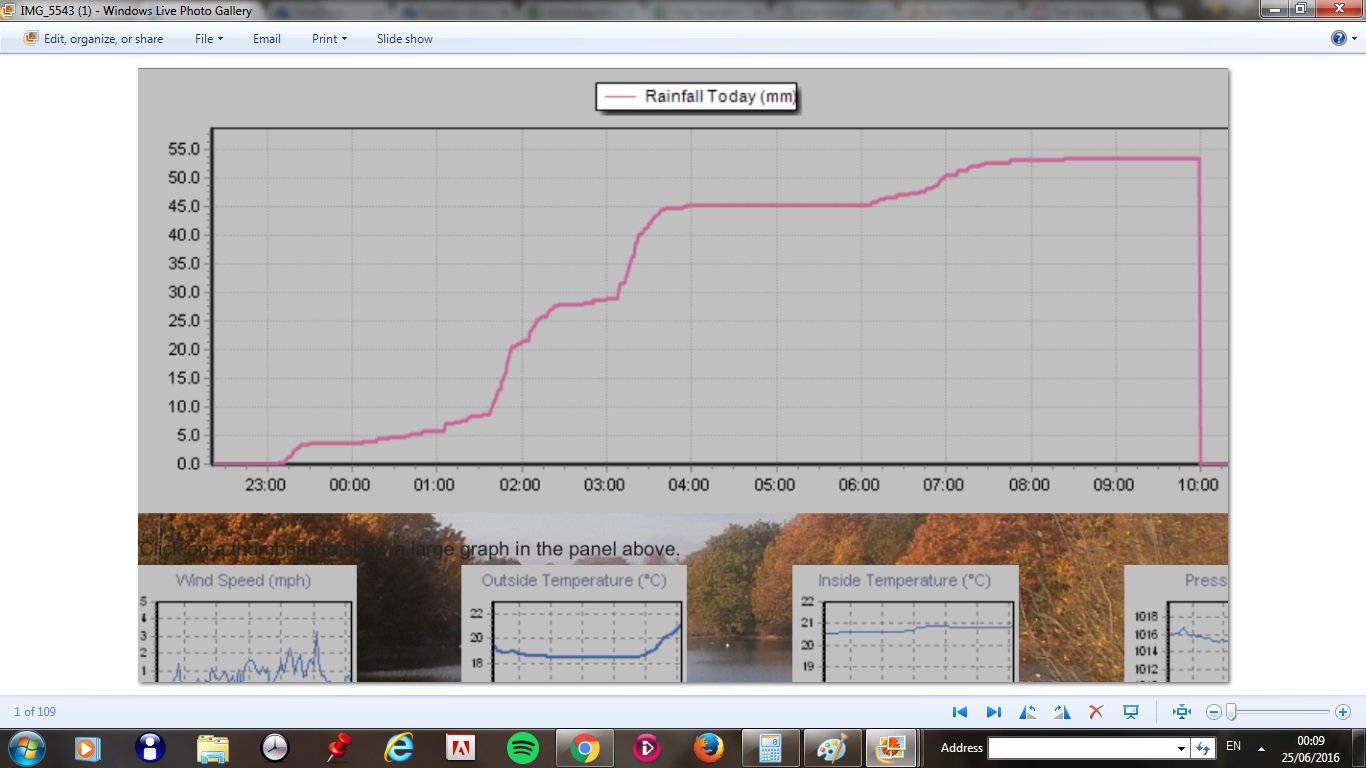
The past week has produced the highest 24-hour rainfall total recorded in Wanstead since at least 1960. The multi-cell thunderstorm on Wednesday night saw 60.8mm fall, most of it in two hours, bringing flash floods to the surrounding area. The spectacular lightning and thunder that accompanied it was almost a side show such was the intensity of the rainfall.
An image from the Home & Dry app revealed a succession of dark red echoes passing over our area. The heaviest rain seemed to run on a line from Battersea to Romford
I was unfortunate enough to be riding home right in the middle of the event: the entire length of the Mile End Road bore a resemblance to a shallow river, the heavy rainfall bouncing back off the Tarmac high enough to create what felt like a powerful drench shower.
The legacy of the downpours caused chaos in the morning and evening rush-hours. Many commuters were stranded at London terminals including Waterloo station because of flooded tracks, possibly robbing many of the chance of voting in the EU referendum. It will never be known if this would have had a bearing on the final result.
Many people think of June as a warm, summery month. The term Flaming June is regarded in most peoples’ subconscious as a reference to past weather. That it is a actually the name of a painting is often missed. Looking back through our local history there has been many notable events of thunderstorms and prolonged rainfall. In 1903 a record-breaking 59-hour deluge left vast swaths of the borough inundated.
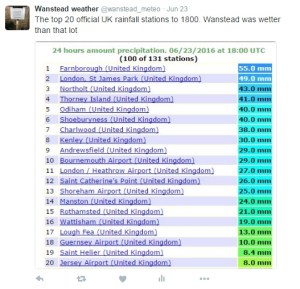
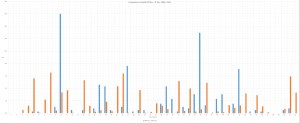
The offical UK weather station totals all recorded less than Wanstead
This weekend 200 years ago, during the Year Without a Summer, a powerful tornado, strong enough to carry away objects weighing 60lbs, tore through the Edgware Road area in west London. Luke Howard recorded the event in the Climate of London.
At two o’clock being a still sultry day a whirlwind passed over the nursery ground of Mr Henderson in the Edgware Road which lifted seven lights from the greenhouses and carried them to the height of the highest elm trees, each of the lights weighs 50 or 60lbs at least. At the same time two garden mats were carried to an immense height so that the eye could not distinguish them.
The following day “extremely heavy and prolonged rain from 9am (26th) to 9am on 27th gave 2.95 inches”. This total of over 52mm is notably high though not a record.
This weather was a continuation of what had been an awful May and June – cold with more than twice the average rainfall in June.
The weather then was not unlike what we have experienced this month. Indeed, a look at the weather throughout this year was similar as this graph shows.
Though the mean temperature at times bears a close resemblance this year is no comparison to 1816: The mean then was running at 6.2C, over 3 degrees colder than today.
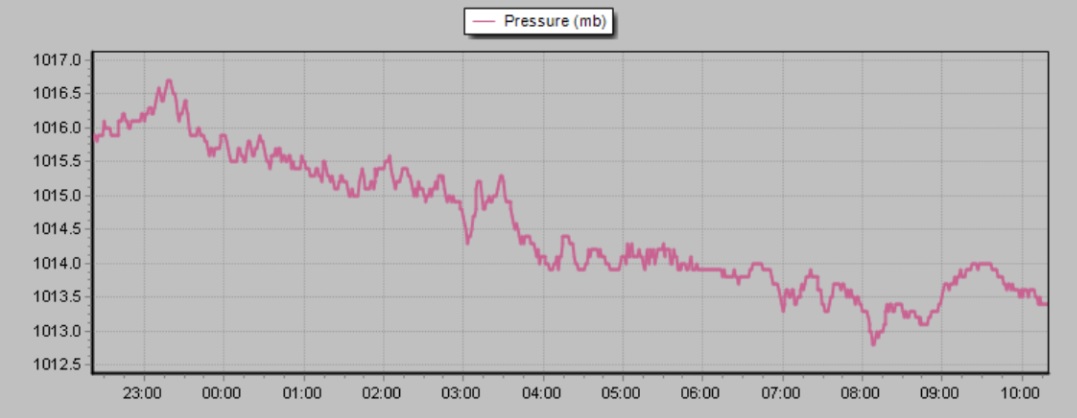
Mean pressure was also lower being 992.1mb; the 2016 mean 9am pressure is 1010.6mb.
Perhaps not surprisingly this year’s rainfall actually trumps 200 years ago; the running total for rainfall here is 390.1mm, higher than the 309.6mm recorded in 1816.
The dreary summer and frequent thunderstorms of 1816 inspired Mary Shelley to write Frankenstein. A summer vacation in Switzerland led her to spend much of the time indoors. She, along with Lord Byron and John William Polidori entertained each other with a contest to write the scariest story of all. The unseasonal conditions, along with this dare, led to the creation of Shelley’s Frankenstein: The Modern Prometheus— as well as Polidori’s novella The Vampyre and Byron’s long-form poem, The Darkness.
It will be interesting to see if this June’s weather, along with momentous political changes here and in Europe, produce more fine fiction from the this and the next generation of writers.
When I was writing up my winter forecast I came across an analogue that was very similar to what happened during the period November 10th to December 31st.
The period November 10th – December 31st in 1806 and 2015 show some striking similarities. It is also notable that mean during 2015 was 3C higher than 1806. Is this a question of synoptics or a warming world?
The results showed a close similarity between the two periods, November 10th – December 31st, though the mean in 2015 was some 3C warmer than 1806. Is this a question of synoptics or is this area now 3C warmer than it was just over 200 years ago?
Rainfall was also remarkably similar: 87.7mm fell from 10/10 – 31/12, just over 5mm more than 1806.
The period November 10th – December 31st in 1806 and 2015 show some striking similarities. It is also notable that mean during 2015 was 3C higher than 1806. Is this a question of synoptics or a warming world?
Luke Howard, in his first volume of The Climate of London, describes a very warm December that followed on from a warm November that fooled flora and fauna into thinking spring had begun early.
Howard’s statistics are very high: a November mean of 9.5C while December was 7.2C. CET that November was 2.3C above average while December was 3.3C above average. Considering the England Wales Precipitation series a slightly wetter than average November was followed by a very wet December – over 250% the monthly average.
“The catkins of the filberts expanded prematurely. On December 25th a hedge sparrow’s nest was taken at Doveridge, Derbyshire, with four eggs and near Warwick a green linnet’s with two eggs. It is worthy of remark that the heat was the same on December 24th as on June 24th last – on both those days the thermometer being nearly 60F.”
Howard goes on to describe how the south-west wind had “reigned for weeks” – for most of November and December before finally giving way at the turn of the year.
“The south west wind which had so long reigned yielded just at the close of the year to the north and west . Some frost ensued which, however, had not the characters of permanence being neither ushered in by driven snows nor accompanied with a dry and serene atmosphere.”
The period November 10th – December 31st in 1806 and 2015 show some striking similarities. It is also notable that mean during 2015 was 3C higher than 1806. Is this a question of synoptics or a warming world?
His description is not dissimilar from what is known as a “three-day toppler” cold spell where a dominant European high briefly gives way to cold air from the north-west or north, bringing often heavy snow to Scotland and the north but just a few cooler days in the south, before the cold feed is cut off as the high re-establishes itself.
Howard also describes how the warmth affected plants.
“The effects of the late high winter temperature on vegetation must have been obvious to everyone who has seen the country. To the very close of the year the grass continued to grow, the daisies to enamel the turf and many of the inmates of our gardens native and exotic to thrive and blossom. Even hyacinth bulbs left in the open beds shot up and flowered. Ten years ago winter came on six weeks earlier and with considerable severity.”
Words that echo what’s going on this month, particularly in the south-west where I’ve heard reports of roses still in bloom and affected by greenfly whiles daffodils look like they will be out in a couple of days.
January and February 1807 were, by the standards of that time, roughly average.
The race to build more riverside property on London’s floodplain has received another boost after a big development on the Greenwich Peninsula was given the green light.
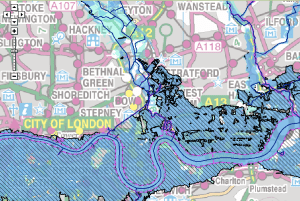
The Environment Agency’s Flood Plan map of the Thames
The Financial Times reported on Friday that Boris Johnson has given final approval to an £8.4bn, 12,700-home development that would transform this area of south-east London into a “high-rise urban village complete with film studio”.
Knight Dragon have already begun construction on the project, a 150-acre scheme approved 10 years ago in a more modest form but revived and expanded after the financial crisis.
The report mentions that local residents are concerned the scheme will place unbearable strain on the area’s transport links and that the size and density is out of keeping with Greenwich’s World Heritage Site of 17th to 19th-century buildings close by.
What is not mentioned is flood risk – a factor that, considering climate models, is deemed too minuscule to worry about. The proposed development satisfies this risk criteria – a report on the ‘Strategic Flood Risk Assessment’, drawn up in October 2011, mentions:
“Tidal flood risk is extensive, but at present Greenwich is fully defended against the 0.1% annual probability extreme tide level with climate change to 2107. A breach in the defences, although a low probability of occurrence, would have a high consequence, causing significant flooding of the Thamesmead, New Charlton and Greenwich Peninsula areas of the Borough.”
But is it wise to build on historic floodplain? Surely we should be looking elsewhere in London for safer sites for projects that will help ease the housing crisis.
The website floodlondon.com shares concern that developments such as these are at severe risk from a tidal surge when the Thames Flood Barrier nears the end of its working life in the middle of this century.
“Perched on the very tip of the Greenwich Peninsula, the O2 Arena finds itself ideally located on a nice sharp bend in the river where it is likely to take the full brunt of the surge as it careers into the bank, much like a racing car taking a corner too fast. The North Greenwich tube station just across the road will prove to be a great asset at this point as it funnels the water into the Jubilee Line.”
Before the Thames Barrier was built this part of the river has seen some catastrophic flooding.
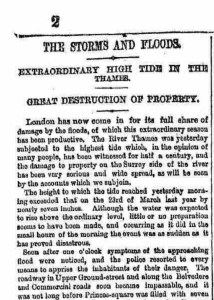
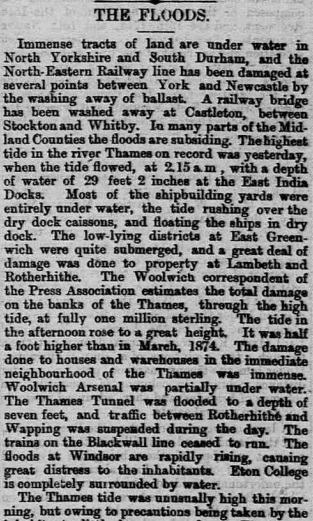
The 1875 flood as reported in the Morning Post
In November 1875, a year that was only slightly wetter than normal, a record high tide of 8.9m was recorded at Blackwall. The figure is 1.36m (4ft 6in) higher than the greatest high tide at North Woolwich (Silvertown) this year, according to tide tables drawn up by the Port of London Authority (7.54m on March 20th).
The flood brought chaos throughout London – with this part of the river particularly badly hit. Much of the Isle of Dogs was inundated, North Woolwich Gardens were under 3ft (1m) of water while the water caused explosions at the Royal Arsenal. Elsewhere in the capital Eton College was ‘completely surrounded by water’. A correspondent for the Press Association said the damage caused on the banks of the Thames was estimated to cost £1m sterling – just over £103m at today’s prices.
The Sunderland Daily Echo & Shipping Gazette on Tuesday, November 16, 1875 reported a depth of water at East India Docks of 29ft 2in. Damage was estimated to be £1m sterling – just over £103m at today’s prices.
Since the flood of 1953 measures, including the Thames Barrier, were put in place to stop this flooding. The Environment Agency has outlined a range of options for the future of the Thames Estuary flood defences. None are particularly cheap. As a minimum, the EA estimates that the cost of maintaining the defences until 2035 will be around £1.5 billion, with an additional £1.8 billion needed to repair and upgrade the defences until 2050. Particular bits of marshland could also be set aside to store tide waters.
The EA estimates a new barrier could cost as much as £7 billion, though that figure could go up if conditions change significantly as the climate changes.
Greenwich Peninsula and another project, City in the East, which was announced last month will need proper flood protection and planning. I wonder if planners are as willing to invest in these defences as they are at making a tidy buck developing these riverside schemes. And do our politicians have the appetite to drive the legislation through?
The problem is that if the climate change does bring greater rainfall and an unprecedented sea-level rise it is the people living in these properties that will be faced with the problem of ever-increasing costs to fight off the risk of inundation.
With the 10th anniversary of the Boxing Day Tsunami this year it has often occurred to me whether the British Isles has suffered from a similar catastrophe in centuries gone by.
The ‘Extraordinary Phenomenon’ reported in the Morning Post, Wednesday, June 5, 1811
With such a vast coastline it is certainly possible but written records of any events seem to be scarce. An entry in Luke Howard’s Climate of London, however, suggests that a phenomenon very similar to what happened in Asia in 2004 happened on our shores.
An entry on May 31, 1811, in Howard’s diary describes an “Agitation of the sea at Plymouth” that began at 3am – the sea fell instantly 4ft and immediately rose 8ft. “Universal consternation” pervaded the whole port, vessels in Catwater were thrown about in the greatest confusion with many dragging their anchor; some drifted and several lost their bowsprits and yards.
At 6.45am the sea rose to the height of 11ft and again receded. At 9.30am the tide suddenly stopped and suddenly ebbed 6 inches. At 10.30am it ebbed again in the same manner and then flowed to high water.
At the time it was noted that two gales from the SSW and E preceded this phenomenon but at the time it happened the wind was light from the SSW.
A few days later, on June 8th, the tide was again seen to flow and ebb several feet in as many minutes which continued at intervals over 4 or 5 hours. Immense swells were seen to flow into the harbours of Sutton Pool and Catwater at a rate of 4 knots an hour. During the time of the boar thunder and lightning was “excessive”.
These events coincided with a volcanic eruption near the shore of Ferraria, São Miguel, creating the short-lived Sabrina Island named after the British frigate HMS Sabrina, whose captain, Commander James Tillard, first identified the island and claimed it for the United Kingdom. The eruption caused destruction to many homes. The islet itself disappeared in the following years.
The event isn’t on record as being a tsunami but the symptoms seen in Plymouth all those years ago are similar, albeit on a much smaller scale, to those seen across Asia in 2004.
Could a tsunami affect the UK in the future? The British Geological Survey says not.
It was just before 3am that I was awoken by faint rumblings outside. I knew there was a risk of thunder before I’d retired to bed a few hours earlier but I’d discounted the risk along with any thoughts of staying up to watch the referendum results unfold in Scotland.
This radar shot shows the storm just beginning to hit Wanstead. The rain was far heavier to our east. 17.2mm was reported at Laindon, Essex. An observer at Woodford Wells recorded 19.9mm her in about 25 minutes 0310-0335 bst
Lightning then illuminated the room through the gaps in the curtains followed by more rumblings: it’ll pass, I thought. Crash – I grabbed my phone – was this an isolated event? The radar showed a line of slow moving storms moving up from the south. More lightning and loud thunder. My Twitter feed told me it wasn’t going too well for those wanting independence. At this point intensely bright lightning was rapidly followed by one of the loudest claps of thunder I’ve heard around 3.10am. Car alarms were set off – may as well get up I thought… The Inverclyde result was announced – ‘No’, by the narrowest of margins 50.1% to 49.9%. That’s it then, I thought. The lightning and thunder gradually began to fade away with hopes of an independent Scotland, on this night anyway. I glanced at my stats which seemed far less impressive than what was recorded elsewhere: 7.7mm, no big fall in temperature or pressure like previous storms during the summer.
Just a few hours later I walked my younger daughter into school, my bleary eyes struggling to focus – the humid and steamy atmosphere felt more like July than September. Indeed Thursday had been the warmest September 18th since 1997 which, strangely, was the same year that another momentous British event took place: the handover of Hong Kong to China. I remarked to a couple of parents that the only thing that had changed overnight was that Andy Murray will forever be the “Scottish” tennis player after his comment on Twitter.
The forecast advised that there was a continued threat of thunderstorms. It was humid but it didn’t ‘feel’ stormy – though around 2.30pm I could hear the beginning of faint rumblings in the distance.
Clouds above could be seen developing rapidly at 2.30pm
I left for work on my scooter at 3pm, carefully watching the sky for any developments all of which seemed to be in the distance. After stopping for petrol in Leytonstone High Road huge drops of rain began splattering the pavement. They were few and far between, however, and the sun defiantly continued to shine. After riding past Stratford I suddenly became aware that the buildings in the distance, past Bow flyover, were gradually beginning to disappear. I pulled in to a turning where Gala Bingo is situated. An electronic noticeboard enquired: “Do you feel lucky?” Not today I thought and retrieved my overtrousers that live under the seat, hastily pulling them on as I watched the impending storm begin to close in.
I continued on and was soon enveloped in the full force of another thunderstorm. Marble-sized hail clattered off my crash helmet while dangerous gusts, caused by wind funneling through the new high rise flats by the Olympic Park, did their best to push me off. Just as I crossed the canal a sheet of rain engulfed me and the drivers to my right. The road in front suddenly turned into a shallow river. I usually ride over the flyover – not today with the torrent of water cascading off the sides.
The 3.15pm storm that flooded large parts of East London. The white area shows where the heaviest rain was
By the time I reached Mile End the rain had almost stopped. The City looked fairly dry and on reaching London Bridge the roads were completely dry. The Friday crowds were out in force in Borough Market, enjoying the sunshine and seemingly oblivious to the chaos unfolding just a few miles away in East London. Within 10 minutes of walking into my office Alex Salmond announced his resignation. Another storm: another momentous event! It was another of those coincidental storms that, in my mind, seem to mark momentous events such as the Royal birth last July
I checked the stats of the storm back in Wanstead: 24.5mm fell with a peak rate of 76.5mm/hr at 15.47. The storm ended a run of 16 dry days bringing the total for the month up to 33mm – the 24hr total was 30.5mm. The explosive convection of this storm can be seen here. The associated hail and rain brought much flooding to Hackney, Hackney Wick and Leytonstone. This storm seemed to be the result of a convergence line over London between light southerlies to the south and easterlies to the north – the heavy rain was very localised.
The flooding wasn’t restricted to East London. In Southend water started pouring through the roof of the Dixons theatre though it failed to stop the performance. Shops in London Road were inundated.
Anyone hoping for a continuation of June and July’s hot weather would have been left sorely disappointed by last month which was characterised by frequent rain and the coldest August night for over 20 years.
A stunning example of sunlight illuminating the underside of cloud at sunset was seen mid-month
August 2014 was the first month this year to be cooler than average; the mean temperature of 17.2C was 1C below average, making it the 89th warmest August since 1797: 1.6C cooler than last August, the coolest for 7 years.
The month was marked with thunderstorms and heavy downpours, contributing to what was a much wetter than average month – some 76mm fell which is 152% of the monthly average and the wettest for 4 years.
The hottest day occurred on the 7th with 27.3C recorded – nothing special for August and a date that heralded the end of the hot spell during June and July.
A couple of nights were notably cool for August: 5C was recorded during the early hours of the 23rd – the coldest August night since 1993.
Sunshine was below average with 161 hours recorded – that’s 83 per cent of mean. The sunniest day was on the 3rd when 12 hours of sunshine were recorded. Throughout the month there were just 2 days with 10 hours or more of sunshine. There were 4 days with thunder recorded – the average for August is 3.
Looking further afield there were many thunderstorms around the UK though many places missed out on the big downpours. It was yet another month where rainfall totals could vary greatly in the space of just a few miles.
On the 9th a station in Woodford Green recorded 24.4mm, double what fell in Wanstead. The legacy of TS Bertha coincided with the end of our extended hot spell – an excellent analysis of this storm can be found here.
There were some spectacular cloud formations not far from here. A particularly good one was seen in Witham.
On 25th a perfect curl could be seen on a depression centred off the west coast of Irleland. The rain associated with this low pressure brought the month’s highest daily rainfall total: 23.4mm (the system bringing 27.5mm) – a thoroughly miserable Bank Holiday Monday where it rained ALL day, from 6am until 9.30pm. It was yet another example of how much even frontal rainfall can vary over a small area.
On 25th a perfect curl could be seen on a depression centred off the west coast of Irleland. The rain associated with this low pressure brought the month’s highest daily rainfall total: 23.4mm (the system bringing 27.5mm) – a thoroughly miserable Bank Holiday Monday where it rained ALL day, from 6am until 9.30pm. It was yet another example of how much even frontal rainfall can vary over a small area with St James Park recording 38.2mm. The top 30 totals for that day can be seen here.
sunset overlooking Wanstead Flats 2nd August
Looking even further afield four people were killed in a flash flood at an Italian festival early on in the month.
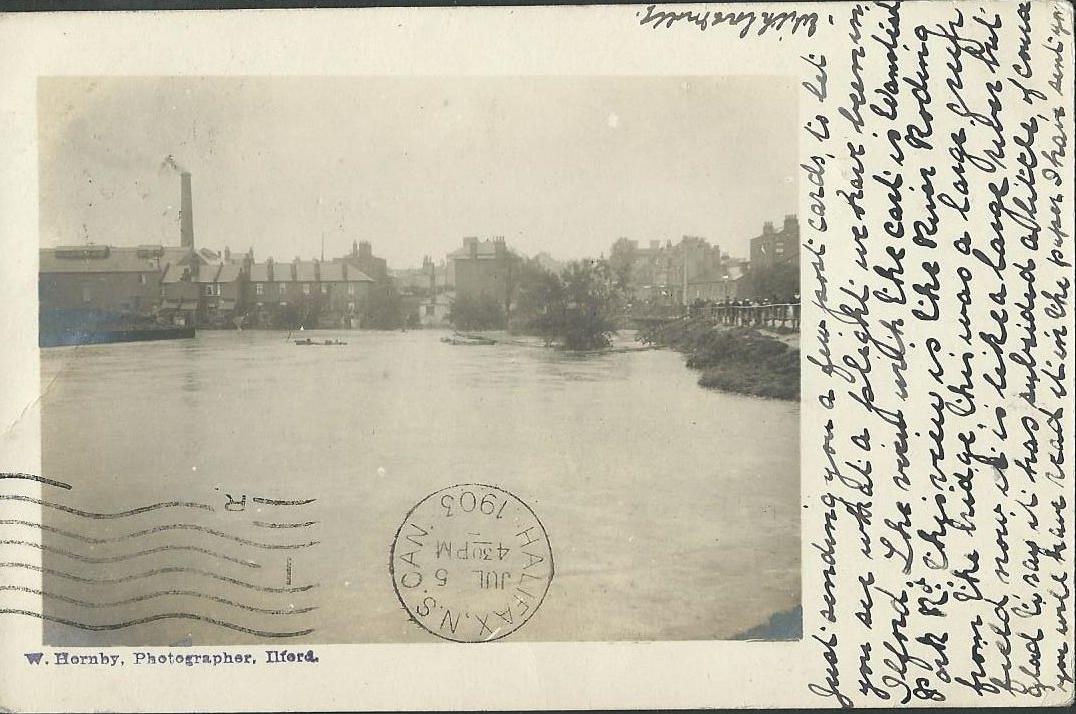
It was the summer when the ‘sea’ came to Redbridge. A record-breaking 59-hour deluge in the middle of June 1903 left vast swaths of the borough inundated. But this was no thundery downpour. All across London and the South East record rainfall rates and totals were set, many of which still stand well over a century later.
The author of this postcard wrote the following: “Just sending you a few postcards to let you see what a plight we have been in Ilford. This view is the River Roding from the bridge. This was a large green field now it is like a large river but glad to say it has subsided a little of course. You will have read it in the papers I have sent you.”
Images of the flooding were captured by Watson Hornby, an amateur photographer and artist, who traded at 7 Cranbrook Road, Ilford. This terrace of houses in Wanstead Park Road, which backs on to the River Roding, were also flooded out. The postcard was written on July 1st, 1903
According to one local historian the fields between Wanstead Park and Ilford – as far as Uphall Road – were like an open sea and the railway track at Seven Kings resembled a shallow river.
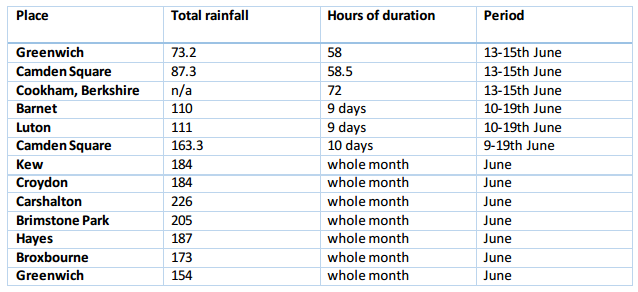
After a dry start to the month June quickly went downhill with notable falls of rain during the second week. The main deluge arrived around noon on Saturday, June 13, and lasted until near midnight on the 15th.
The rain was caused by a depression that moved slowly across southern England, becoming stationary over the English Channel close to the Isle of Wight for 24 hours before moving north-east. It introduced a very cool NE’ly airflow – the temperature on the 14th and 15th failed to climb above 11C and on the 19th a high of just 9.2C was recorded as yet more rain fell.
Across the London area there were five days within the period 10th to 19th June when over 25mm of rain was measured in many places. The deluge added to what became the wettest summer month on record. At the Royal Observatory, Greenwich, just over 154mm fell, three times the amount of what normally falls in June in this area. Further west, Kew Observatory recorded 184mm.
The June 1903 flood at Empress Avenue at the junction of Wanstead Park Road
The 1903 rains produced an unprecedented summer flood on the Thames. At Teddington 7335 million gallons (33,374 million litres) of water flowed over the weir on June 21st. Elsewhere the Lea Valley was one vast lake, especially around Enfield, with the Royal Gunpowder Factory inundated.
The Friday, June 19th edition of the Essex County Chronicle abounds with other tales of woe from the floods…
Barking and District: In the large area of low-lying ground between Lea Bridge, Ilford, Barking, and East Ham, houses stood in a great inland sea, which was washing over the garden fences and lapping at the lower windows. Upstairs the occupants could be seen moving about or gazing hopelessly out at the dreary waste of black waters. Boats from Barking Creek were rowing about with supplies of milk and bread, and those who wished were taken away. All along the Barking Road from East Ham scenes almost identical were witnessed, but, happily with the end of the rain, the water did not retain its level long. Past Barking and on to Rainham the roads on Tuesday were quite impassable, much of the heavy traffic which goes through Rainham towards Barking having to turn back.
The floodwaters between Wanstead Park and Ilford were described as a vast inland sea
Woodford and Wanstead: The inhabitants of Claybury Asylum and Woodford Bridge were cut off by 3ft of water from Woodford. The whole of the Roding Valley was in a deplorable state; sheds, trees and stock that was once alive floating in all directions. Wanstead was divided from Ilford by a great lake, but happily the total of loss in property was here very small.
Lea Bridge: The Leyton marshes were covered by one great sheet of water, Lea Bridge Road itself being quite 2ft under. Boats were to be seen plying among the tramcars.
Epping: The valleys were well-nigh impassable, especially at Thornwood and parts of Theydon Bois.
Romford: The floods reached to Romford High Street, and made the thoroughfare impassable for pedestrians. The crisis caused a heated exchange among members at a meeting of the Urban Council on Monday evening where it was agreed to allow the free use of the town fire engine for pumping water from ratepayers’ premises, provided that those who required its services paid for the labour. Cllr J. Bassett thought the residents should make their own arrangements for getting rid of the water. Cllr J.R Holliday replied: “You don’t live near the river. I should like to stick you in the middle of it. I think it is the duty of the council to protect property.”
Laindon: Here the height of the deluge was experienced between seven and eight o’clock on Sunday evening. The rain descended in apparent ropes of water, causing consternation, flooding houses, choking drains and water-troughing, cutting deep channels in roads, washing up plants and new potatoes. On Monday the water was between 3 and 4ft feet deep at Noak Hill and other bridges.
Woodford: An exciting scene took place at Woodford Bridge, where a steam circus, with its owners, was in the most precarious position. Men and women were submerged up to their armpits while extricating the caravans.
Away from the South East the weather was much dryer. Felixstowe and Yarmouth newspapers reported that Sunday had seen “delightfully sunny weather, with cool north-easterly breezes”. Lincoln, meanwhile, recorded less than an inch of rain for the whole month!
Could these rains happen again? Meteorologically, given the same synoptic set-up, it is possible. In terms of the June monthly total of rain we came close in 1997 when 133mm fell – though this was much more evenly spread throughout the month. And thanks to massive investment in local river systems since the 1950s the flooding nightmares brought by the Lea and Roding rivers should stay firmly in the past.
*You can see the full stats from Greenwich for June 1903 by clicking this link.


 actually trumps 200 years ago; the running total for rainfall here is 390.1mm, higher than the 309.6mm recorded in 1816.
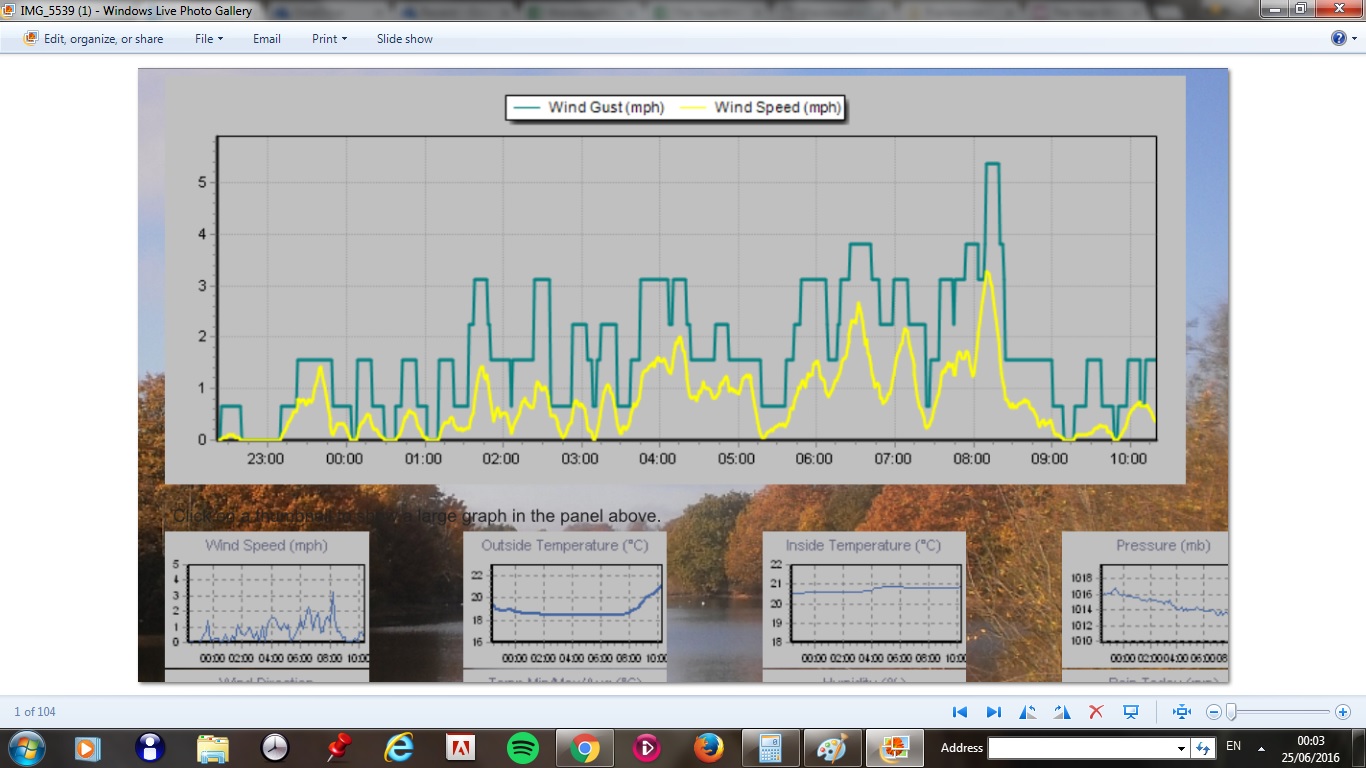


You must be logged in to post a comment.