The mean temperature for July so far in Wanstead stands at 22.2°C, that’s 4.6°C above the 1961-90 average.
Far too hot for many it would seem. And, with many regions in England now officially under drought conditions, far too dry.
So where has the climate of my childhood got to?
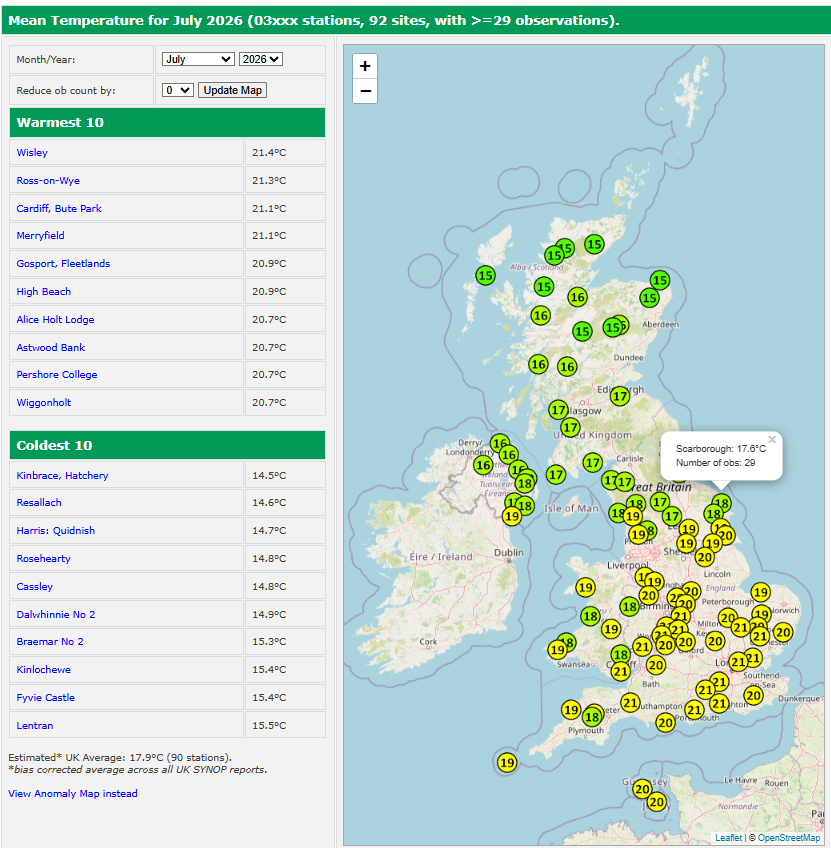
A look on the excellent RoostWeather site shows that a mean temperature of 17.6°C this July lies somewhere between Scarborough and Edinburgh.
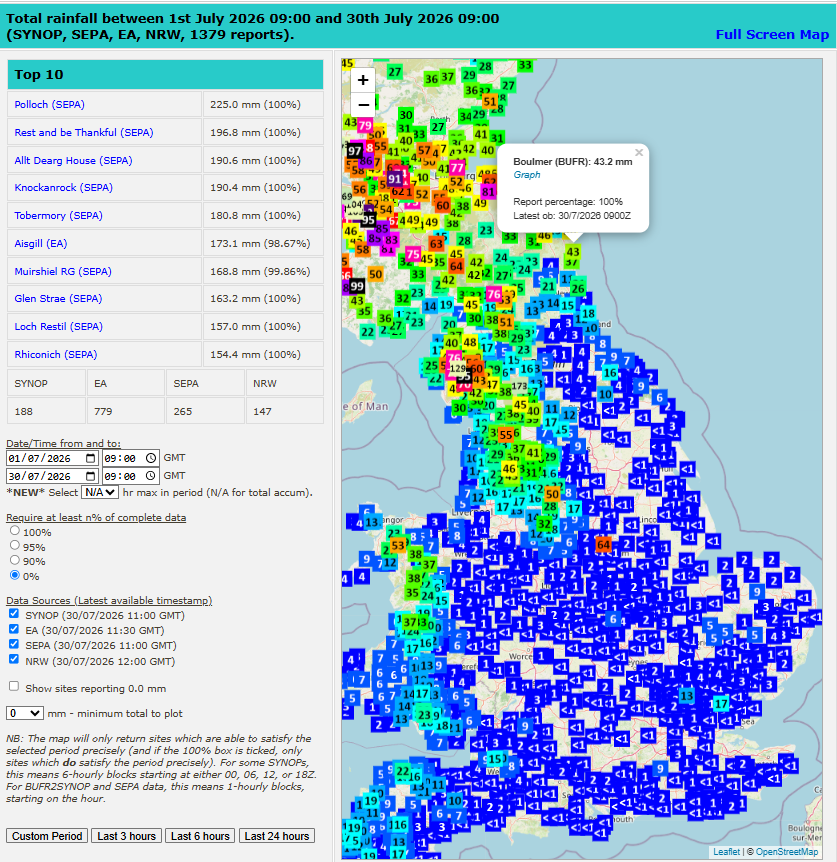
But, with just 6mm of rain all month, that’s far too dry. You need to move another 93 miles north to find somewhere with over 40mm of rainfall, the average amount during a July in 1961-90.
Which takes us up to somewhere between Boulmer and Alnwick.
In March I attended an avalanche course to try to better understand the dynamics of what causes masses of snow to suddenly roll down a mountain.
The Swiss Mountain Training level 2 syllabus didn’t disappoint and over the course of three days I was soon digging snow pits to study the layers and what causes them to occasionally release.
Shovels in hand I, along with my fellow students, was soon digging down to a depth of over 150cm. Probes revealed a huge temperature difference; from -11C at the surface to just above freezing at the base.
Grass roots left for councils to grab, into darkness is nature plunged. By acres of green plastic drab, of reason, we are now expunged. But this is what the people want, of climate we are nonchalant.
Warnings are for other people, yet last year floods claimed your garage. Memories lost, in discharge faecal, not long before the next barrage. Clues are in that relentless march of CET upwards, landscapes parch.
On we go, no time for nature, let us now pave over that drive. Flat Earthers all, blind to danger of the abyss, we’re doomed to dive. Fear not we’ll scrub the atmosphere. Of carbon dioxide from air near.
Fly away we must on breaks grand, Worry about climate later. Holiday firms need that demand, from the poles to the equator. But it’s home, our backyards we need to restore nature, not concede.
The coming winter is likely to be mild and wet thanks to a predominant south-westerly Atlantic regime.
This year I have tried to improve my statistical method by using historic data from across the capital thanks to the Met Office’s ever expanding library of data; daily Kew values now date back to 1881!
In terms of rainfall and mean temperature a total of eight years were similar to this October and November, spanning 1929 to 2020.
The probabilities for the following DJF winter were thus.
Mean temperature
Probability
Rainfall
Probability
Very mild
37%
Wet
37%
Average to mild
51%
Average
63%
Below average
12%
Dry
0%
London winter forecast 2023/24
Looking deeper into the stats I had a look at the Oceanic Niño Index; the most similar years to this one were 1982 and 1987.
A note on WeatherWeb mentions exception rainfall in the Lewes & Brighton area of Sussex, between 20th September and 31st December 1982.
January 1988 was the wettest in England and Wales for over 40 years, and the wettest at Hampstead since records began there in 1909.
February of that winter also saw a major storm affecting much of the British Isles on the 10th and 11th with much damage to buildings.
The prognosis for snow at this point seems bleak – though chances may be heightened should we experience a stratospheric sudden warming in December / January. Though, as seen in 1987 where a vortex ‘split’ was recorded, this would still not guarantee wintry weather.
Taking the above years into account would give a winter where the average mean would follow this graph. Therefore, after the cold snap during the first week of December, the temperature gradually climbs through the month until the 18th when the will be a gradual drop for a possible cold snap between Christmas and New Year.
This then followed by the usual warm up in the new year with changeable weather through January. The best chance of a sustained cold snap appears to be from February 7th to 13th.
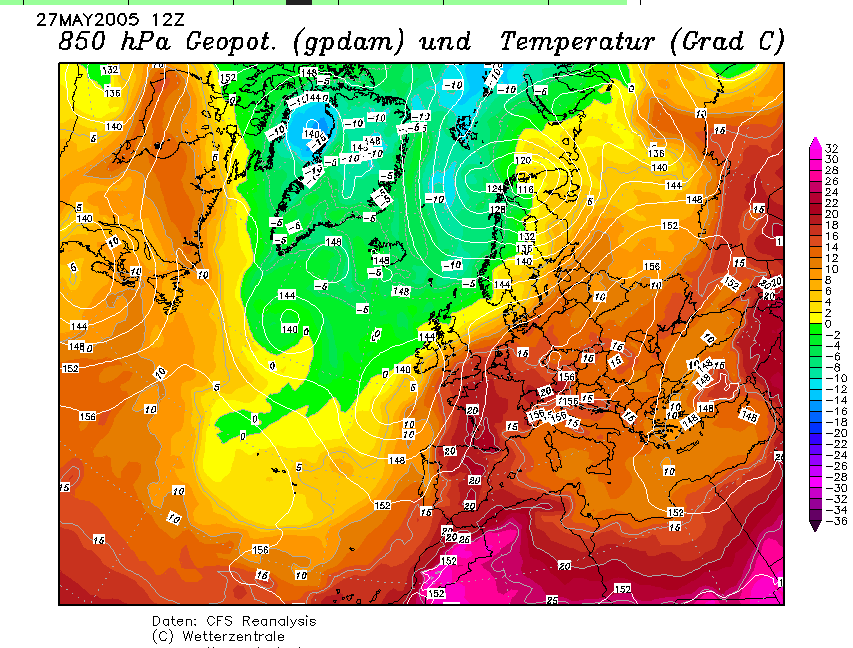
It will be 30C season soon but unlikely this month. The only occasion this happened in May in the last 60 years was 2005 on the 27th when 32.1C was reached.
A low pressure system to our west was responsible for sucking up hot air from Iberia.
The incidence of 30C has increased this century. The level of 86 Fahrenheit used to be very rare in the Seventies and Eighties but as this graph below shows it has been getting more common.
The highest incidence of 30C days happened in 2018, the summer that seemed to go on and on; an extended dry spell helped contribute to a large blaze on Wanstead Flats during the day of the World Cup Final.
What about the likelihood of 30C days this summer? The coming pattern, according to the GFS, looks like June could see heat building over Iberia. It wouldn’t take much for a suitable synoptic to see this heat harnessed for the southern UK.
The erratic onset of spring in some years often presents that problem of what to wear every morning. During the current warm spell I’ve seen all manner of attire on the school run; everything from T-shirt and shorts to full winter regalia topped off with hat and gloves.
The position of the sun is now bringing in to range the season when the gap in temperature between day and night can be at its greatest.
On Saturday (23/2), virtually unbroken sunshine and ‘thick’ air saw the temperature in Wanstead peak at 16.1C before clear conditions overnight saw the minimum plunge to just 0.2C. The gap of 15.9C represents the fourth highest diurnal temperature range for February in this area back to 1959.
Top 10 February diurnal temp ranges
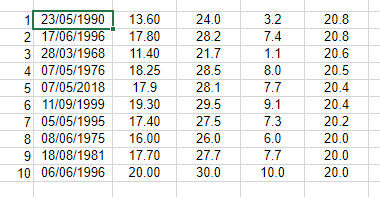
Looking at the year as a whole the greatest range is 20.8C with the months of May and June the most likely to see the condition.
Earlier this winter there were many reports on how good snowfall had been in Austria. But on closer inspection it was clear that the weather pattern at that time only favoured certain resorts.
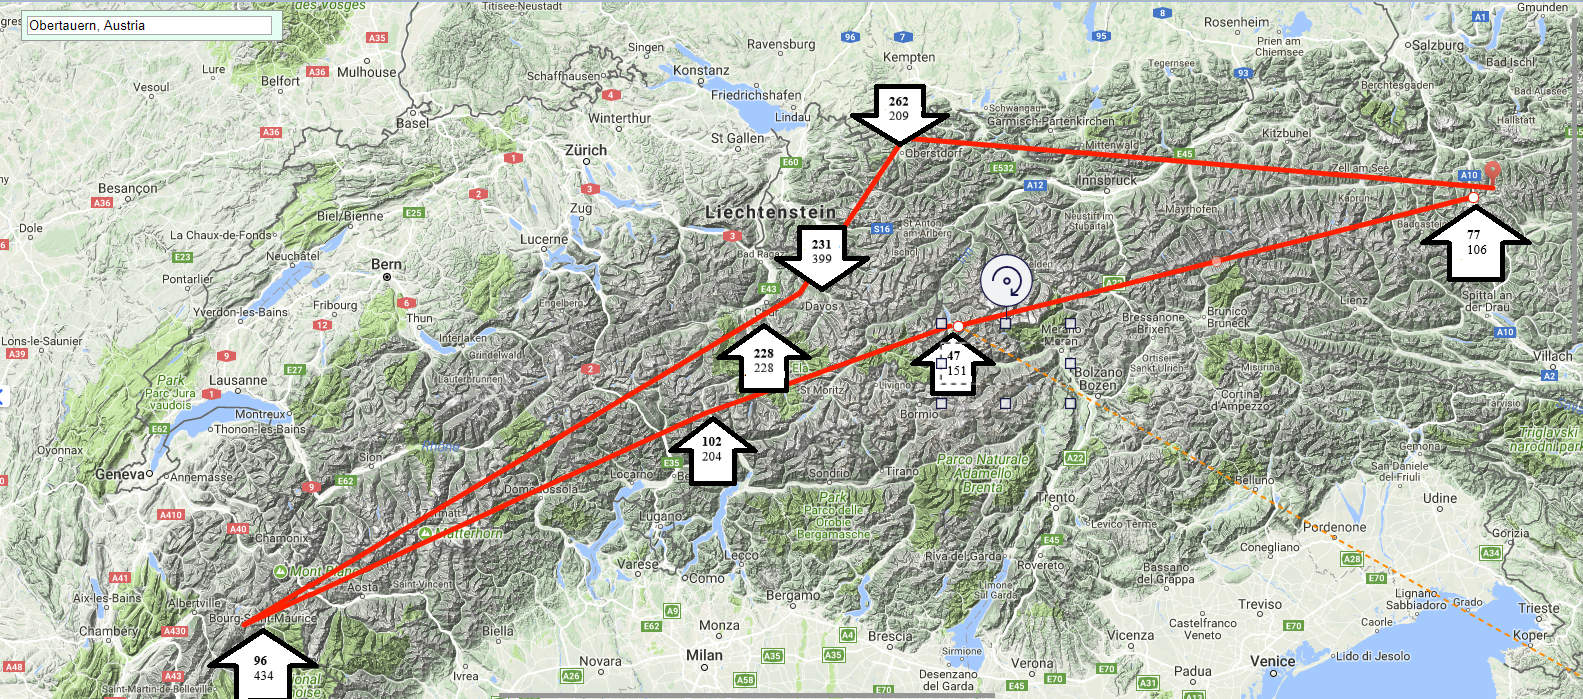
In contrast with last year the totals I’ve used in my cross section of the range don’t look that exciting; Bourg-St-Maurice, the jumping off point for Savoie resorts including Les Arcs and Val d’Isere, has recorded 96mm of precipitation this season, in stark contrast to the 433mm it recorded last season between Christmas Day and February 5th.
In Switzerland Arosa, a resort well placed to pick up snow from any direction, has recorded the same this season as last. Totals in Davos are well down on last season. Similarly San Bernardino has recorded about half the amount of precipitation than it did last season. Its location toward the southern side of the range has been sheltered from the prevailing winds this year. That said it did enjoy a big dump last week.
Going further south and east St Vallentin in Italy has recorded about a third what it did at this stage last season.
Mean temperatures overall are about 2C to 3C lower than they were last season.
30-day precipitation totals reveal that Bourg St Maurice recorded just 96mm, compared with last year’s 433mm while Obertauern in the east recorded 77mm, compared with 106mm the same period last year
The winter of 2017/18 will probably be remembered as much colder that it actually was – the exceptionally severe spell right at the end was only at its halfway point by the time the meteorological winter was over.
Like a scene from the Pathfinder movie
The mean temperature for the season finished 5C, that’s 0.5C below average and the coldest for five years.
Rainfall was above average: 180.8mm fell, that’s 124 per cent of average and the wettest for four years.
Sunshine was just over average: 174.4 hrs is 104 per cent over average and the sunniest for tree years.
As so often with winters at this latitude the average for three months makes it look a non-descript season – it is only when you look at the detail that compelling facts emerge.
The coldest day of the season occurred on the last day of February when the maximum failed to rise above -1C, the first ‘ice day’ for five years and the coldest day since 2010. It was also the seventh equal coldest February day in a local record going back to 1959.
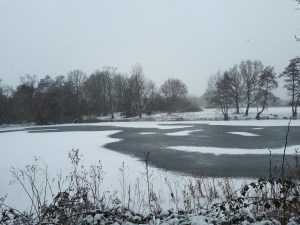
Perch pond, being deeper, took longer to ice over
The coldest night of the winter was in the early hours of the 28th when a low of -6.9C was recorded. The temperature would have been far lower were it not for a shower that moved in at 3am.
The warmest day of the winter occurred on December 30th with 14.2C recorded. The warmest night was on January 28th when the temperature fell to just 10.8C.
The wettest day of the winter occurred on January 2nd when 15.3mm was recorded.
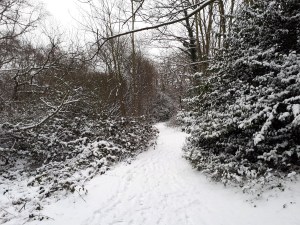
Snow arrived at the start of winter and at the very end: seven days of snow falling and four days of snow lying over the three months is below average.
This slideshow requires JavaScript.
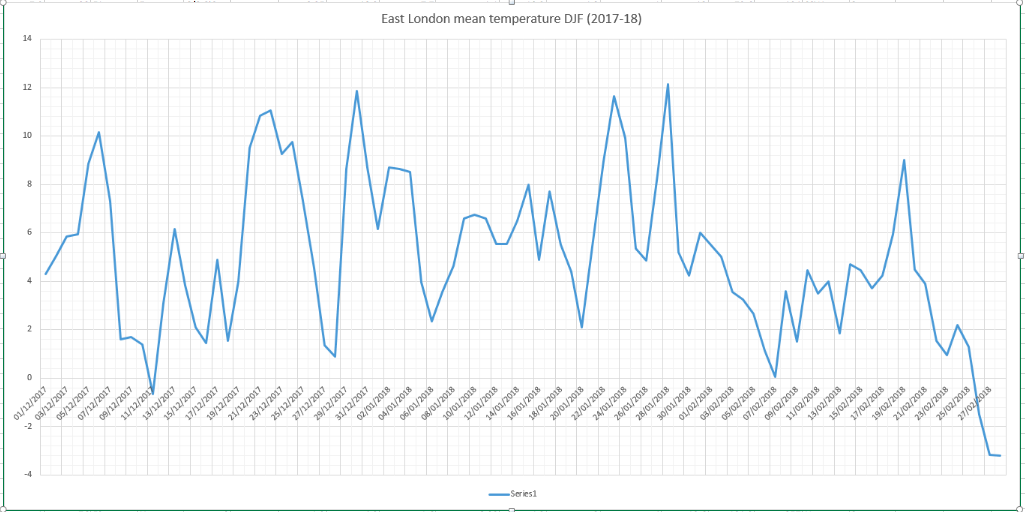
The daily mean temp yo-yo’d throughout December, January and February
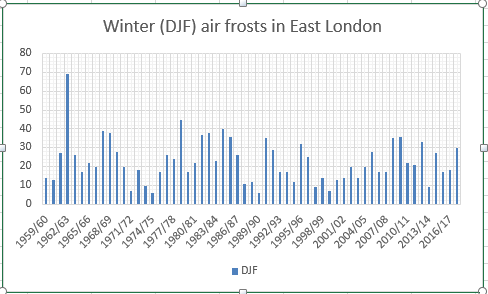
There were 30 air frosts during the three months, eight above the 1981-2010 average.
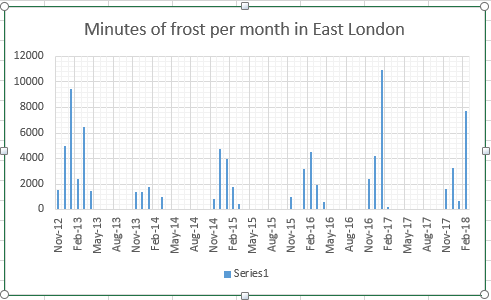
There were 11,680 minutes of frost over the winter, less than last year, though 66 per cent of those were recorded in February. Considering the past 6 Februaries this year’s frost hours were 170 per cent greater than the next highest, February 2016!.
Temperature (°C):
Mean (1 minute) 5.2
Mean (min+max) 5.0
Mean Minimum 2.0
Mean Maximum 8.0
Minimum -6.9 on 27/02/2018
Maximum 14.2 on 30/12/2017
Highest Minimum 10.8 on 28/01/2018
Lowest Maximum -1.0 on 28/02/2018
Air frosts 30
Rainfall (mm):
Total for period 182.2
Wettest day 15.3 on 02/01/2018
High rain rate 28.2 day 02/01/2018
Rain days 52
Dry days 38
Wind (mph):
Highest Gust 45.0 on 02/01/2018
Average Speed 3.7
Wind Run 8059.5 miles
Gale days 0
Pressure (mb):
Maximum 1036.4 on 22/12/2017
Minimum 970.3 on 10/12/2017
Days with snow falling 7
Days with snow lying at 0900 4
There’s been countless reports about amazing amounts of snow falling across the French, Swiss and Italian Alps to the point where some agencies have been proclaiming that it has been the best season for the white stuff in 30 years.
Extraordinary totals have fallen in some areas. Bourg-St-Maurice, the jumping off point for Savoie resorts including Les Arcs and Val d’Isere, has recorded over 400mm of precipitation over the past 30 days, equating to around 4m of snow at the resort summits.
In Switzerland, large amounts of snow in a short period caused chaos in Zermatt, stranding tourists after the area’s rail services suffered disruption.
Away from the north and west side of the Alps, however, snowfall, while good, has been less impressive the further south and east you look.
30-day precipitation totals reveal that Bourg St Maurice recorded 422mm while Obertauern in the east recorded 99mm.
It is a far cry from last year where some resorts on the southern side of the range were particularly dry. San Bernardino, during the last 30-days, has recorded 179mm of precipitation. During the same period last year just 14.6mm fell!
The outlook for the Alps continues to look unsettled with snow forecast to fall at resorts that are in deficit to the Valais and Savoie areas.


You must be logged in to post a comment.