An article by the late meteorologist and broadcaster Philip Eden a number of years ago considered many of these patterns and found that, to varying degrees of reliability, they provided a guide to what the weather would be like at any given time of the year.
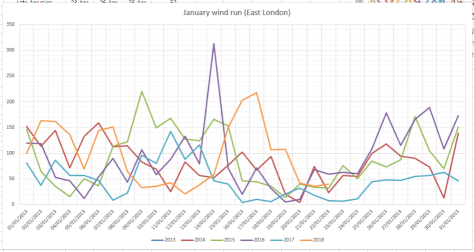
Considering climate change I wondered how much these patterns could still be relied on. Using my own pressure, rainfall and ‘wind run’ data (the total amount of daily wind) going back to the start of 2013 I had a look at the singularities for January and February
January patterns at the beginning, middle and end of the month appear to be the most reliable. However, it is only the ‘mid-Jan settled’ period that is most reliable.
The pressure trace most notably shows a general rise from the 17th, the date of last week’s windstorm, consistent with the mid-January settled singularity.Though this year’s ‘settled’ January spell saw rain the past 5 years have seen mostly dry weather.Very little wind has been recorded around January 20th for the past 5 years
The early Feb settled spell occurs with very low probability: just 56 per cent. And this year the pressure, according to the GFS model, plotted below by WXCharts.eu, is predicted to be around 1040mb by February 2!
This animation of the GFS model shows the idea of the Iceland low, which drives our SW’ly type weather, ‘taking a holiday’ to southern Iberia, possibly advecting any cold weather in the east to flood the UK
Looking at the results of the past 5 years it could be concluded that the patterns do still occur but because of the nature of the jet stream, which seems to meander far more readily than in the past, these stormy / quiet episodes are becoming shorter than they were in previous studies.
The Met Office’s latest outlook for a relatively high chance of cold weather in the early part of winter has set the internet abuzz with talk that the UK is about to experience its coldest winter in years.
The 3-month outlook, produced by the agency for contingency planners, states:
Lower-than-average temperatures are more probable than higher-than-average values. Overall, the probability that the UK-mean temperature for November-December-January will fall into the coldest of our five categories is 30% and the probability that it will fall into the warmest of our five categories is 10% (the 1981-2010 probability for each of these categories is 20%).
THe ‘30% chance’ for temperatures to be in the coldest of five categories is more significant than it would appear: in this three-year period of mild winters that figure usually hovers far lower.
The continent is not yet cold enough to get excited about this synoptic chart for Monday, November 7th
The Met Office’s method, which includes a combination of data such as QBO, ENSO and ground based observations also agrees with my own method of finding local October singularities back to 1797. This month I found that an average or cold November is most likely: average and cold are both 30 per cent probability. Rather cold and severe are both 20%! There appears no chance of anything mild.
So, we can look forward to ‘a reduction in the normal westerly flow across the UK from the Atlantic, with a greater frequency of northerly or easterly winds’.
But what does this mean for the London area? If the near continent is not cold enough northerly and easterly winds could just bring a succession of cold rain in the form of showers off the North Sea with a higher than average frequency of frosty nights: nothing out of the ordinary for a slightly cooler than average November.
To try and second guess proceedings into December I decided to plot all year singularities to find when the cold spells would most likely fall and how severe they could be.
The results for November look unexciting: the coldest day is likely to be around the 19th with a maximum of 6.9C. The best chance for something cold looks to be in December, around 6th to the 11th – but there again highs of 3C or 4C would mean that any snow would be short lived. There appears to be a warm up in time to scotch hopes of a white Christmas before another cool down toward new year.
So, in conclusion, late autumn / early winter is likely to be a lot colder than the past three years. It is perhaps this fact, together with frosty mornings being common, that will make the season feel colder than it actually is.
I will be publishing my usual winter forecast on December 1st.
The coldest day in November is likely to be around the 19th
Sections of the tabloid media have been going into overdrive these past couple of weeks with tales that the UK will soon be in the grip of an Arctic freeze – one headline in the Daily Express boasted that parts of the UK were in for FOUR MONTHS OF SNOW.
The Daily Express ‘forecast’ was published at the end of September
These stories are nothing new though they seem to be published earlier and earlier in the autumn. By the time we reach November – once the traditional time when winter forecasts started appearing – the tabloids have already turned their attentions to spring. Much of it is just ‘clickbait’ – a means for publishers to prove their stories are being read to keep their advertisers happy, a symptom of an industry in financial dire straits.
There will be snow somewhere in the UK during the next five months but predicting heavy snowfall in a given area, such as London, is impossible. But given the outrageous claims at such a long way from the start of the season on December 1st I decided to have a look to see if there is anything wintry on the horizon.
I started by comparing a range of historic datasets, including quasi-biennial oscillation (QBO) and el niño–southern oscillation (ENSO), against monthly mean temperature and rainfall anomalies. Because ENSO data only goes back to 1950 the findings are obviously far more restricted than my winter forecast method which uses local data going back to 1797.
The results of my data trawl are underwhelming. The best fit years were as follows:
For anyone who likes snow the above is not encouraging, however, given the past year which has seen several daily and monthly records shattered, including a record warm December, who’s to say that recent warm temperatures will suddenly swing the other way.
The above table would also suggest that the coming winter will be colder and snowier than the previous three – but that gives little away given how mild the past three winters have been.
October 2016 has seen a strong blocking high become established over Scandinavia, the earliest this has happened since 1881.
A study of mean temperature anomalies in London since 1950 suggest that sudden swings, both positive and negative, are becoming more likely. Last month was the fifth month in a row that I recorded a positive anomaly – the longer this goes on the more likely it is the mean could turn negative – though bear in mind that I have recorded 12 months in a row of positive anomalies, from February 2011 until January 2012.
Current weather also suggests that something maybe afoot with the earliest establishment of a strong anticyclone over Norway (the fabled Scandinavian high) since 1881! This weather pattern gives the south-east its best chance of snow with the feed of cold air often coming all the way from Siberia. Time and again, however, I’ve seen these patterns break down in November just as everyone starts talking about an imminent severe winter. There is more than an element of truth to the saying:
Ice in November to bear a duck, rest of winter will be slush and muck
In conclusion, while the early figures look bleak for snow in the low-lying south-east, it is still far too early to tell if the coming winter will be mild or cold.
The last time Liverpool won the league in 1990 (by league I mean top tier of English football) the South East enjoyed a mostly dry, warm and sunny summer. A particularly hot spell in August of that year saw the UK high temperature record broken when the mercury reached 37.1C at Cheltenham on August 3rd, a record that stood until 2003.
Since the middle of December last year the weather has been remarkably similar to that football season when the Reds won their 18th league title. Both winters were remarkably mild and stormy with January 1990 seeing the Burns’ Day storm.
The mean temperature this year over the same period, December 13th to April 26th, is just 0.2C cooler than 1989-90, while rainfall is 2.1% greater and sunshine is 2.5% less. A remarkable singularity.
Will history repeat itself come the end of the season and the end of the summer? Up until early Sunday afternoon the stage seemed set. But a slip by Liverpool skipper Steven Gerrard at the end of the first half gifted Demba Ba with a chance that opened the way for Chelsea to complete the double over their title rivals.
The Liverpool squad of the 1989-1990 season won the club’s 18th league title
It must have been agonising for the Kop to watch, 24 years on from the exact same weekend the Reds lifted the title with two games left. The weather that followed that memorable day was dry, sunny and warm with temperatures reaching the mid 20s on many days.
Fast forward two dozen years and the weather looks decidedly unsettled, with frequent showers or longer spells of rain interspersed with sunshine. Though there’s doubtless many twists and turns left I wonder if Reds fans believe their title hopes are going the same way as the change in the weather?
Football’s a funny old game – just like the weather.


You must be logged in to post a comment.