Tag Archives: TORRO

The curse of June 13th

1 Jun 21 Jun 16 Jun 77

June can be a strange month weatherwise. Scorching temperatures as well as washout, cold weather, perhaps epitomised by the Queen’s Diamond Jubilee pageant on the river Thames in 2012, can feature prominently.

The month can also throw up some striking anomalies, none more so than the fact that the 13th is the only day in the month where the temperature has never reached or exceeded 30C anywhere in the British Isles.

According to TORRO the highest daily maximum recorded in the UK is 28.3C at Earls Colne, Essex, in 1948; at Brixton, south London, in 1896 and Aboyne in 1994. Yet either side of this date has records comfortably above 31C, as the table below shows.

torro.PNG

The closest we’ve got locally to 30C in the last 60 years was in 1989 when 27C was recorded.

So why is the 13th ‘cursed’ with traditionally being the coolest day of the month? The best explaination perhaps is the fact that the date occurs more or less during the middle of the North-west European monsoon.

According to Philip Eden’s list of singularities the June monsoon can strike any time between the 1st and 21st but normally peaks on the 16th with a 77 per cent frequency.

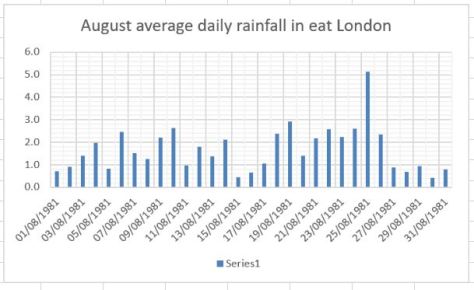
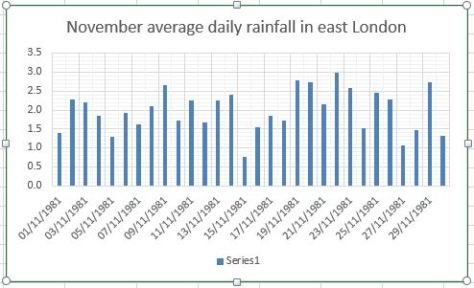
As well as cool temperatures the phenomenon can also bring copious amounts of rain, as happened in 1903 when large parts of Redbridge were inundated following a 59-hour deluge that started on… the 13th.

Will we see a repeat this Thursday? Unlikely, though the general pattern is not that different to what led to events over a hundred years ago.

13th

Advertisement

London’s August extremes since 1959

For the past few years August has often failed to match up to June and July for hot, summery weather. Looking at the models this August promises something very warm though whether it is another 1995 or 2003 is anyone’s guess.

I’ve put together a few top 10s of stats for Wanstead, St James’s Park and Heathrow for the month of August.

august top ten wans

august SJP

august heathrow

Some national UK August values according to TORRO

Hottest: 38.5C Brogdale, near Faversham, Kent – 10th 2003
Coldest: -4.5C Lagganlia, Highland – 21st 1973
Wettest: 238.8 Cannington, Somerset – 18th 1924

In terms of climatology August maxima, considering the 1981-2010 average, shows a fairly steady decrease through the month, though around the 15th there is often a spike before a steady decrease to month’s end. This would reflect the late August winds singularity which occurs every year around the 20th at 67 per cent probability.

august av max

The average rainfall graphic shows that downpour amounts are fairly random from year to year. The driest days are the 15th and the 30th.

aug av rain


London’s July extremes since 1959

Recent weather patterns have seen much high pressure to our north keeping us dry and mostly sunny but, aside from June, protected from humid Spanish plumes.

A look at local east London stats shows that half of the last 10 July months have been warmer than average while only two have been much drier than average.

I’ve put together a few top 10s of stats for Wanstead, St James’s Park and Heathrow for the month of July.

wanjuly


july heathrow

sjp july

Some national UK July values according to TORRO


Hottest: 19th 2006: 36.5C at Wisley, Surrey.
Coldest: 15th 1977: -2.5C at Lagganlia, Highland.
Wettest: 18th 1955: 279.4.8mm at Martinstown Dorset.

july av mx
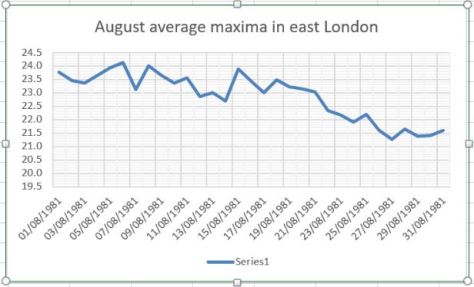
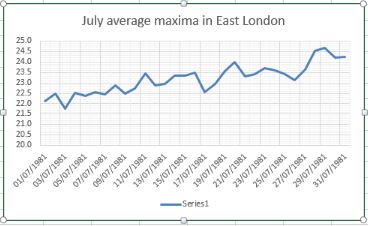
In terms of climatology July maxima, considering the 1981-2010 average, shows a fairly steady increase through the month, though around the 17th there is often a dip before a warm end. This would reflect the July heatwave singularity which occurs every year at 80 per cent probability.

The average rainfall graphic shows that downpour amounts are fairly random from year to year. The driest days are the 1st and the 25th. july av rn


London’s June extremes since 1959

A look at local east London stats shows that six of the last 10 Junes have been warmer than average while half have been much drier than average.

I’ve put together a few top 10s of stats for Wanstead, St James’s Park and Heathrow for the month of June.

Probably most notable from the below values is that recent Junes have been devoid of extreme cool temperatures and rainfall.

Snow has been known to fall in June, in 1975.

Rain is usually most frequent in the last week of the month.

june extremes wans

heathrow june

june sjp

The 10 driest Junes were:

Some UK May values according to TORRO

Hottest: 29th 1957: 35.6C at Camden Square, London. Also Southampton 28th 1976
Coldest: 9th 1955: -5.6C at Dalwhinnie, Highland. Also June 1st and 3rd 1962: Santon Downham, Norfolk
Wettest: 28th 1917: 242.8mm at Bruton, Somerset

Screen Shot 2018-06-06 at 12.11.18
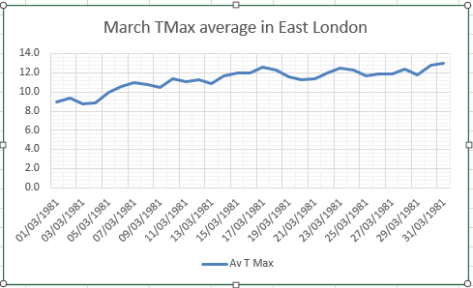
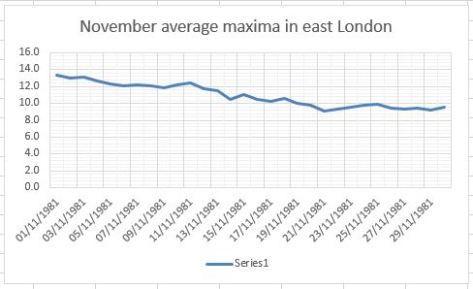
In terms of climatology June maxima, considering the 1981-2010 average, shows a gradual increase through the month, though around the 19th to the 21st there is often a dip before a warm end. This would reflect the June Monsoon which occurs every year at 77 per cent probability.

The average rainfall graphic reflects this, showing a four-day wetter spell after the 20th.

Screen Shot 2018-06-06 at 12.29.10

London’s May extremes since 1959

Ne’er cast a clout till May is out. With the recent March and April weather being so variable it would be wise to bear in mind this old saying, especially with fine and warm weather forecast for the Bank Holiday weekend.

A look at local east London stats, however, shows that seven of the last 10 Mays have been warmer and drier than average.

I’ve put together a few top 10s of stats for Wanstead, St James’s Park and Heathrow for the month of April.

Probably most notable from the below values is that recent Mays have been devoid of extreme cool temperatures and rainfall.

With nights now relatively short air frosts are uncommon though the odd ground frost can still strike on a clear night.

Snow can fall in May – one example being 1979 in the higher parts of the capital – but after the first week it is extremely rare.

Rain is usually most frequent in the last week of the month.

wanstead may

SJP may

heathrow may


This slideshow requires JavaScript.

Some UK May values according to TORRO

Hottest: 22nd 1922: 32.8C at Camden Square, London.
Coldest: 2nd 1917: -9.4C at Lynford, Norfolk
Wettest: 8th 1884: 172.2 at Seathwaite, Cumbria


In terms of climatology May maxima, considering the 1981-2010 average, shows a gradual increase through the month, though around the 25th there is often a brief dip before a warm end.

The average rainfall graphic reflects this, showing a three-day wetter spell after the 24th.

max max


may rain


London’s March extremes since 1959

I’ve put together a few top 10s of stats for Wanstead, St James’s Park and Heathrow for the month of March.

The month, the first of the meteorological spring can offer really contrasting weather; perishing cold and very pleasant warmth are both very possible, as the values show.

Probably most notable in the list is the cold March of 1962 which was the coldest of the 20th century and 11th coldest in a local list going back to 1797. March 2013 was also very cold. Strong winds from deep depressions often feature as does the odd blizzard.

Marches in the 1960s also appear to often start very cold and end very warm; the term ‘In like a lion, out like a lamb’ being very appropriate.
•Though this blog only covers extremes back to 1959, thanks to Met Office digitised data, I’ve unearthed records prior to this. Both W.A.L Marshall’s A Century of London Weather (covering 1841 to 1941) and J. H. Brazell’s London Weather (covering 1841 to 1964) confirm the coldest March day as the 13th in 1845 when 25F (-3.9C) was recorded at

The coldest March minimum was 4/5 in 1909 with 9F (-12.8C) at Epsom. Greenwich and Hampstead recorded 14F (-10C)

march extreme

Screen Shot 2018-03-21 at 13.57.55

Screen Shot 2018-03-21 at 13.38.47

Some national UK March values according to TORRO

Hottest: 25C Wakefield, West Yorks – 29th 1929
Coldest: -22.8C Logie Coldstone, Grampian – 14th 1958
Wettest: 164.3mm Glen Etive, Highland – 26th 1968

march av tmax

march Tmin

march av rain

London’s February extremes since 1959

I’ve put together a few top 10s of stats for Wanstead, St James’s Park and Heathrow for the month of February.

Probably most notable is the cold February of 1991 which saw the deepest snowfall I can remember – days of snow saw the level depth past my knee in suburban London. February 1986 was also very cold but also very dry with little snow.

Februaries in the 1990s were also often warm with 19.7C being reached in Wanstead on 13th in 1998.

It is a shame that the Met Office only publishes easy to access daily data in Excel format back to 1959 as this obviously omits the classic snowy February of 1947 which is worth a blog on its own.

My winter forecast for the London area can be found here.

wanstead feb

top 10 heathrow feb

SJP top 10 feb

Some national UK February values according to TORRO

Hottest: 21.2C Kew Gardens – 26th 2019
Coldest: -27.2C Braemar – 11th 1895
Wettest: 196.6mm Ben Nevis, Highland – 6th 1894

feb max av

London’s January extremes since 1959

I’ve put together a few top 10s of stats for Wanstead, St James’s Park and Heathrow for the month of January.

Probably most notable is just how impressive the depth of cold was during the cold spell of 1987. When considering St James’s Park the temperature on the 12th never rose above -6C: nearly 4C colder than any January day in 1963, the coldest winter in modern times.

My winter forecast for the London area can be found here.

Screen Shot 2018-01-03 at 21.26.39

Screen Shot 2018-01-04 at 14.47.01

sjp

Some national UK January values according to TORRO

Hottest: 18.3C Aber, Gwynedd – 27th 1958
Coldest: -27.2C Braemar, Grampian – 10th 1982
Wettest: 238.4mm Loch Sloy main adit Strathclyde – 17th 1974

Climatology

Here’s a couple of graphs showing the maxima, minima and rainfall. Notice the spike  which reflects the singularity which has an 84 per cent probability.

jan av tmax

jan av min

jan av rain

London’s December extremes since 1959

I’ve put together a few top 10s of stats for Wanstead, St James’s Park and Heathrow for the month of December.

Probably most notable is how the month in 1978 lurched from being very mild and wet to very cold in under three weeks later, setting up one of the coldest-ever winters.

Screen Shot 2017-12-02 at 12.41.15

dec recs

December Heathrow

Some national UK December values according to TORRO

Hottest: 18.3C Achnashellach – 2nd 1948
Coldest: -27.2C Altnaharra, Highland – 30th 1995
Wettest: 199.1mm Dalness, Highland – 17th 1966

Climatology

Here’s a couple of graphs showing the maxima and rainfall. Notice the spike just before Christmas day which reflects the singularity which has an 84 per cent probability.

december maxima.PNG

December minima.PNG

december rainfall.PNG

London’s November extremes since 1959

I’ve put together a few top 10s of stats for Wanstead, St James’s Park and Heathrow for the month of November.

Probably most notable is how the month in 2010 lurched from being so warm at the start to so cold three weeks later, setting up December to be one of the coldest on record.

wanstead

November SJP

heathrow

Some national UK November values according to TORRO

Hottest: 21.7C Prestatyn, Clwyd – 4th 1946
Coldest: -23.3C Braemar, Grampian – 14th 1919
Wettest: 211.1mm Lluest Wen Reservoir, Rhondda – 11th 1929

November climatology

In terms of climatology November maxima, considering the 1981-2010 average, shows a steady fall until the 15th. And another steady fall to the 22nd before things level off. This would reflect the November singularities; St Martin’s Summer, between 15th and 21st, peaking on the 18th, occurs in 66 per cent of years. The Early December storms singularity can arrive this month, on the 24th, the air off the Atlantic raising the mean temperature.

november average maxima

The average rainfall graphic shows that downpour amounts are variable through the month. A tendency for dry weather around the 15th reflects the St Martin’s Summer singularity.

november rain

This graphic shows the average 9am air pressure in November since 2013.

pressure