Tag Archives: wanstead

Wanstead weather in October

The current site hosting Wanstead’s weather station has been running for 11 years next month; the automatic station uploading data every 10 minutes to the internet.

The 10-year averages from the station are now good enough to be listed on the Climatological Observers Link.

A look at the tenth month shows some interesting trends…

The 9am air pressure readings were not included in previous climate summaries owing to analogue barometers only giving approximate air pressure readings. The advent of AWS has changed that, particularly for independent amateur observers.

A look at the below graphic shows pressure lowest around the 21st, the stormiest weather of the month. Storm Babet in 2023 is proof of that.

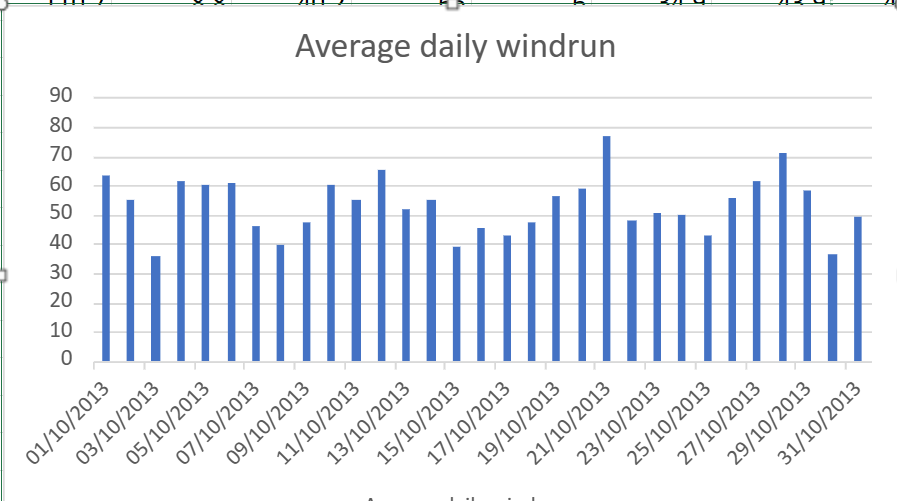
Average daily windrun is how much wind there’s been during a 24 hour period. Again the 21st comes out as windiest.

Average rainfall

Average daily maximum

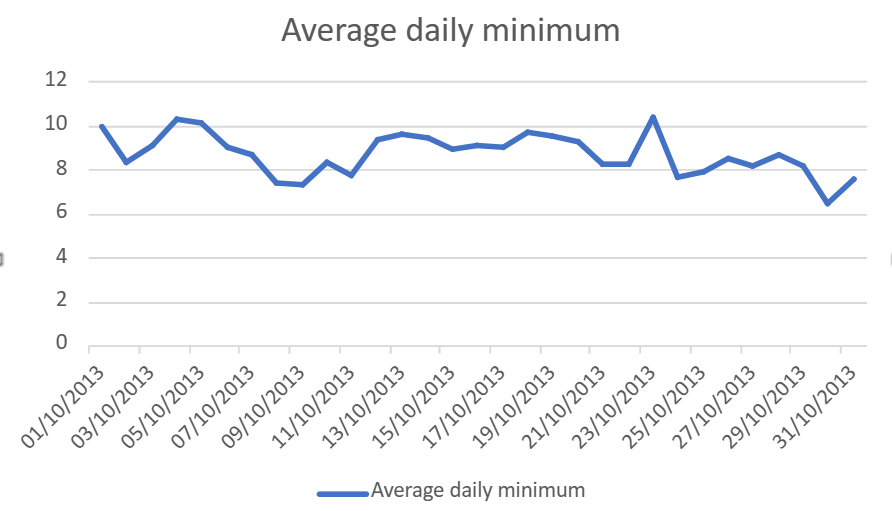
Average daily minimum

Rolling 12-month maxima in Wanstead, east London

The rolling 12-month average maxima anomaly in Wanstead on June 10th is sitting at 1.6C.

Considering local statistics back to 1959 the figure reached an all-time high of 2.1C last November, a level it stayed until December 11th, when a very remarkable week of snow and frost arrived.

With unremarkable maxima for most of this year the figure has been falling. But with a building El Nino it remains to be seen if the highest anomaly ever of 2.1C will be breached.

Date12-month rolling anomaly
10/6/20231.6
10/6/20221.1
10/6/20210.4
10/6/20201.3
10/6/20191.7
10/6/20180.5
10/6/20171.2
10/6/20160.9
10/6/20151.0
10/6/20141.4
10/6/2013-1.3

The snowfall of December 11, 2022

The morning of December 11, 2022, began cold after an overnight frost that saw temperatures fall to -5.3C. Freezing fog lasted through the day, coating everything in rime to set the stage for what was to be one of the most notable snowfalls in years.

Precipitation started just before 7pm with a mix of rain, ice pellets and wet snow, this soon turning to all snow within 10 minutes and settled fast.

By 9pm there was a good 6cm; Wanstead Park was soon transformed.

By midnight the snow had stopped, leaving a good 13cm out the back

Elsewhere there was a rare sighting of thundersnow in Billericay.

<blockquote class=”twitter-tweet”><p lang=”en” dir=”ltr”>Incredible &amp; relatively rare thundersnow captured on Essex! <br><br> <a href=”https://t.co/2o0OHY35oF”>pic.twitter.com/2o0OHY35oF</a></p>&mdash; Met4Cast (@Met4CastUK) <a href=”https://twitter.com/Met4CastUK/status/1602073484951261185?ref_src=twsrc%5Etfw”>December 11, 2022</a></blockquote> <script async src=”https://platform.twitter.com/widgets.js&#8221; charset=”utf-8″></script>

A chilly and dry autumn on the way?

Anomalies of the past two months throw up some interesting singularities as we head into late summer and autumn – with a hint that we could be heading for a much colder than normal December.

Using stats from the past 60 days revealed the following years. Those most similar to the current ENSO situation are highlighted in bold.

The most negative month on average will be December.

In terms of rainfall those hoping for a deluge look likely to be disappointed, at least in the south-east, with a continuation of synoptic conditions that favour drier than average weather.

The best chance for a wetter than average month appears to be September though, given recent synoptics, this is likely more a result of trough disruption than any sustained period of Atlantic-driven fronts.

Wanstead colder than Aviemore

That’s not a statement that applies much, least of all the second week of January. But the current weather pattern has seen this town in the Highlands subject to the warming influence of the Atlantic, to a higher degree than London.

The above 850mb chart, typical of the past week, shows the warmer air aloft and the south of the UK seemingly cut off from outside influence.

Indeed, lack of solar heating at this time of year ensures that any thermal activity is minimal – with very little mixing of the boundary layers by day.

Wanstead Park, being a frost hollow, has seen this phenomena most days during the past week with this part of London markedly colder than elsewhere in the capital.

By the 16th the 7-day running mean at Aviemore was 2.4C higher than Wanstead!

The Christmas storm singularity

One of the best articles written regarding weather forecasting is Philip Eden’s ‘Does the Weather Have a Memory?’

The crux of the article is that certain weather types can repeat at the same time of year with one having a 100 per cent probability!

The Christmas storm singularity occurs in 84 per cent of years.

While 84 per cent certainly doesn’t mean ‘nailed on’, in the current set up of models being evenly spread between settled and stormy it can be safely guessed at this range that there will be unsettled weather around on the 25th. Whether it will affect the whole country remains uncertain.

The last big snorter of a Christmas storm I can remember in London was 2013. The entry for the 23rd into the 24th reads.

“Cloudy and breezy start grew steadily duller with rain just before noon. Rain grew heavier with some really strong gusts into evening culminating at 2am. Cloud at one point was 10kms thick. Three deaths related to weather.”

There was chaos nationwide with flooding and power cuts.

https://www.bbc.co.uk/news/uk-25512391

The average wind run for this station shows the singularity as well as the mid December settled spell we are now seeing.

Pressure peaks and troughs

Air pressure is probably the least celebrated meteorological statistic, most probably because unless you’re staring at a barometer all day you can’t ‘see’ it.

High pressure brings mostly fine weather while low pressure usually brings wind and rain – though it is the gradient of the isobars that can measure the impact each system can bring.

Steep falls and rises in pressure bring the most memorable events, in my case the October 1987 storm.

During the next week there will be a notable fall in pressure – but how will it compare with the past recent years? Looking at my own stats, a relatively small but complete set of 9am barometer readings back to May 2013, it does look like it will be notable.

The table below shows the numbers to beat.

As with many of these events the most impactful weather was found in the north of Scotland. The first period coincides with Storm Caroline.
The Met Office blog says Caroline brought a max gust of 93mph at Fair Isle and transport disruption and closed schools across the Western Isles.

Of course what goes down also comes up and pressure rises can be even more notable. In February 2016 the pressure rose 50mb in just three days, a week or so after Storm Imogen.

According to the Met Office FAX charts the 9am pressure in London on March 11th will be around 988mb, which would represent a fall of 48.6mb from 9am on March 6th.

The early March storms singularity

Storms in late February / early March occur in 88 per cent of years, according to Philip Eden’s study on singularities.

This year looks no different although the drop in air pressure looks like it will happen just in the nick of time.

The GFS op for the March 9th compared with the situation on the 2nd

A look at the past eight years shows the effects of the pattern are quite pronounced.

And a look nationwide reveals the following named storms occurred around this period.

Storm Jake, March 2, 2016

Storm Ewan, February 28, 2017

Storm Emma, March 1, 2018

Storm Karine, March 2, 2020

And going back further reveals a notable storm in the 19th century.

Luke Howard’s meteors

Attention on the bright meteor seen over the UK earlier this week got me thinking about the meteors frequently mentioned in Luke Howard’s Climate of London volumes.

Howard had a keen interest in all things atmospheric, not least this celestial phenomena. Many of his personal accounts are mentioned over a period of a decade or so including accounts of meteors overseas.

April 4, 1807

February 1, 1808

July 12, 1808

December 16, 1808

March 22, 1809

May 1, 1809

July 18, 1809

January 26, 1811

April 1, 1811

November 7, 1812

April 23, 1813

July 29,1813

February 2, 1816

December 12, 1816

August 6, 1817

Decenber 8, 1817

January 28, 1818

February 6, 1818

Grimmest winter since 1979

The last three months in east London, considering sunshine, have been the dullest for 10 years. Despite the sunny end to February just 123 hours of sun have been recorded, just under 74 per cent of the seasonal average.

With little sun, rainfall well above average, temperatures best described as average and the endless lockdown it is no wonder things felt so grim.

A couple of years ago, inspired by the blogger XMetman, I devised my own ‘grim index’ to try to rank how each winter ‘felt’.

Using the same criteria, and assuming that most people welcome sunshine, it can be seen that since the least grim winter of 2007-08, the season, after a blip in 2018-19, has been growing steadily worse.

The grimmest winter, considering statistics back to 1881, was, ironically, the 1978-79 ‘Winter of Discontent’ when, again ironically, ‘Sunny Jim’ Callaghan was in Downing Street as widespread strikes coincided with the coldest winter for 16 years.

On looking at the Top 20 of grim winters it is striking how most coincide with depressing world events, the Great War, World War 2 and the Spanish Flu pandemic.