It’s been an unusual autumn so far. A very notable lack of sun from the end of October into November was followed by an early cold snap before Storm Bert brought flooding chaos to parts of south Wales, the West Country and elsewhere.
Just before the beginning of every winter I have a crack at predicting what winter will be like; the results often being very mixed.
However, on looking at the stats so far there’s virtually no years that have been similar to this autumn; the one year being 1968.
1968, looking back at reanalyis charts, swung from mild to cold with snow on Christmas Day. The Weather Outlook mentions the conditions on the 25th.
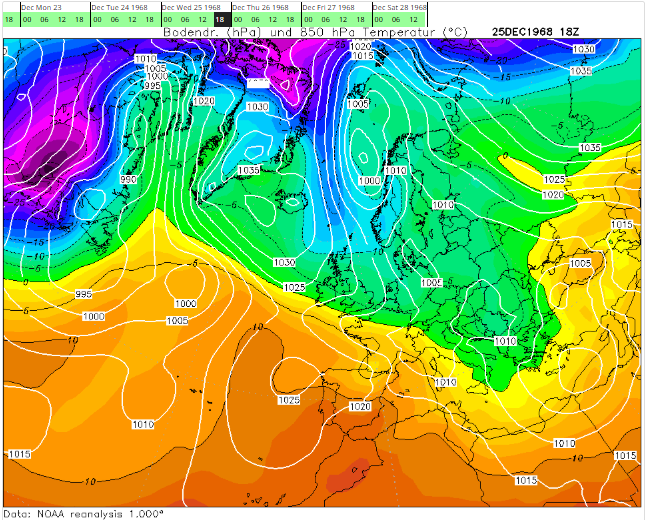
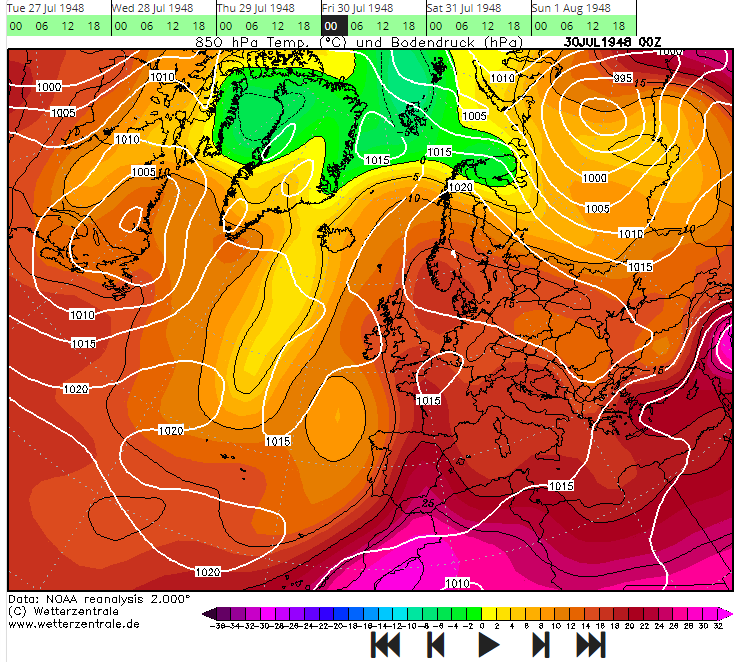
Though the odds are very long at this stage the 850mb chart for 1968 is not beyond the realms of possibilities given the recent synoptic patterns. And if not the 25th I would suggest that a cold snap between Christmas and New Year is a better chance than evens this year.
1968 was the year Bing Crosby sung an alternative intro to White Christmas while marooned in a sunny California.
The sun is shining, the grass is green; the orange and palm trees sway. There’s never been such a day in Beverly Hills, LA. But it’s December 24th , and I long to be up north!
Though we think of snow at Christmas in London it is very rare. And has often been rare been since Victorian times.
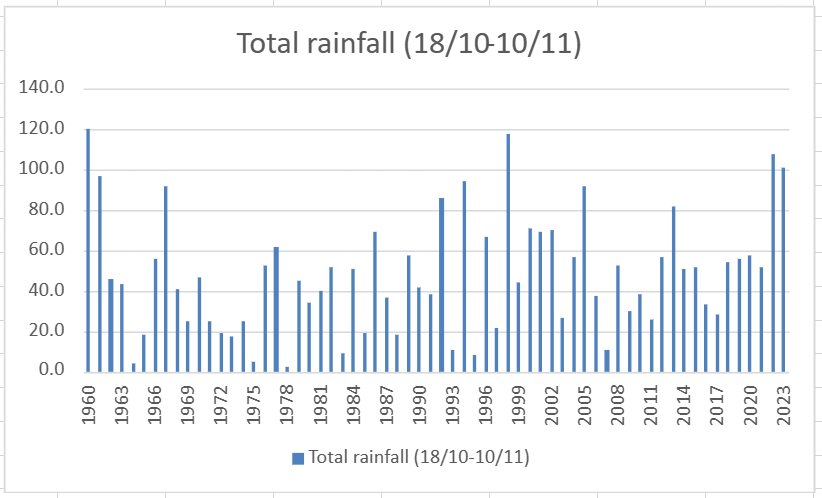
October 18th this year heralded a run of weather where it has hardly stopped raining in this part of the south-east.
Since that date there has been 101mm of rain with 22 ‘rain days’, 24 hour periods where there’s been 0.2mm of rain or more. Just one of the last 24 days has been completely dry.
In terms of the 1991-2020 average the amount represents just under twice the usual amount of rainfall at this time of year.
In terms of unusual weather patterns it is up there amongst the ‘top 10’.
What does it mean for the coming winter. Impossible to say on a small scale but I’m guessing wet and mild in the south. Note however that 1960/61 and 1998/99 had a number of maritime northerly outbreaks which added up to an average winter in Scotland, and plenty of snow for the Highlands.
Also note how similar this autumn is to last year when the snowy spell in December came out of nowhere.
The last three months in east London, considering sunshine, have been the dullest for 10 years. Despite the sunny end to February just 123 hours of sun have been recorded, just under 74 per cent of the seasonal average.
With little sun, rainfall well above average, temperatures best described as average and the endless lockdown it is no wonder things felt so grim.
A couple of years ago, inspired by the blogger XMetman, I devised my own ‘grim index’ to try to rank how each winter ‘felt’.
Using the same criteria, and assuming that most people welcome sunshine, it can be seen that since the least grim winter of 2007-08, the season, after a blip in 2018-19, has been growing steadily worse.
The grimmest winter, considering statistics back to 1881, was, ironically, the 1978-79 ‘Winter of Discontent’ when, again ironically, ‘Sunny Jim’ Callaghan was in Downing Street as widespread strikes coincided with the coldest winter for 16 years.
On looking at the Top 20 of grim winters it is striking how most coincide with depressing world events, the Great War, World War 2 and the Spanish Flu pandemic.
Valentines Day 2021 saw the cold spell come to an end in the London area. Maxima over the past 7 days never exceeded 2.3C on any day, the yardstick I use for a spell of cold weather to qualify.
Though some places did get a decent amount of snow precipitation in this area was very low ; lying snow at 9am at this station never exceeded 3cm. Very cold, dry air however was enough to preserve cover out of the sun.
As cold spells go it was two days longer than the median of 5 days, so slighter colder and drier but with double the amount of sunshine.
A couple of years ago I tried to rank cold spells in this area since 1960, with mixed results. I’ve since revisited the method and have achieved better results using the following algorithm. (Number of days * total precipitation)*(mean temperature of spell)-(total sun hours). This gave the following list.
And the next 26 cold spells
A comparison of the upper air at the start of two cold spells
There’s been many images that define this spell but this post probably nails it in that I’ve never seen the ice thick enough on the marshes to tempt someone to ice skate.
Sleeping in heatwaves is never a great prospect even in an age where fans and air conditioning units are becoming more and more common.
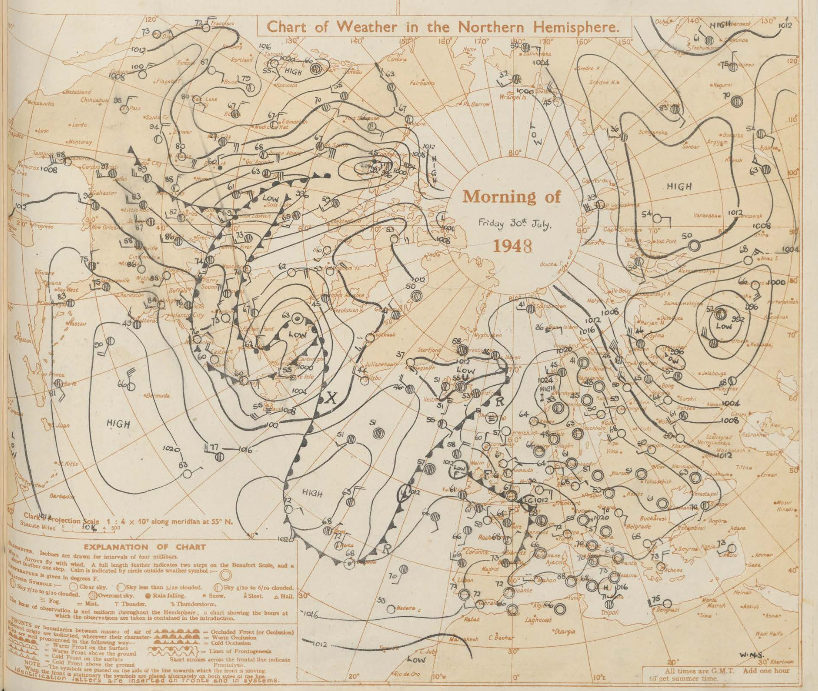
In 1948, however, residents of Kensington and other areas of London were so hot and desperate to escape oven-like houses caused by temperatures well into the 90s that they decamped en masse into the streets and local parks to get some kip.
A report published in the Aberdeen Journal on Friday 30th July describes how folk down south were coping with the heat.
“The metropolis last night was like a large restless household—with all the lights ablaze, doors and windows thrown open, the family fretful, and endless pots of tea brewing far into this morning.
“Perhaps one in ten among the 8,000,000 of us slept after midnight. For the rest, we tossed and turned and saw out this heatwave night, when temperatures were never below 71 degrees, a variety of ways. About midnight I walked past the gaunt old Edwardian mansions in Kensington. With the exception the lights that burned from every window, the scene was reminiscent of the early days of the Blitz.
“Families trekked across the roadway in varying stages of undress to their little bits of ornamental gardens. With them went camp beds, bed linen, umbrellas, “in case,” the children, and the household pets, choose a cool open-air camping spot and feel wonderfully adventurous and spartan in the process.”
“At regular intervals the adolescent members of the squatting colonies were dispatched to the tea and coffee stalls on the corner, and perhaps for the first time in years these traders ran out of stocks. On the Kensington-Chelsea boundary, where life becomes noticeably less inhibited and on occasions less swish, a mixed group of young artists was sleeping on the pavement off Fulham Road.
“Round the next corner, where many theatrical and film stars live, several had slung hammocks on their meagre front lawns – one actually suspended between the bathroom windows of two adjacent houses. Midnight street wear for both sexes was cool if unconventional —silk pyjamas, bath robes, tennis shorts, and one in kilt and bathing costume top who could have gone straight into the arena at Lonach.”
The temperature at Westminster that night never fell below 23.3C (73.9 F), a record for July that still stands.
The column goes on to describe the situation in the House of Commons where the heat had reached “almost Turkish bath intensity”.
“Some members were in natty tussore silk suitings, but this helped little, and it was many of their number who appealed to the Speaker to have more windows opened. The Speaker, panting like the rest of us, said they were all open. If they wanted more cool breezes from the Thames, members would have to smash the windows.”
Wild weather in the run up to the autumnal equinox was frequently a staple of the Septembers of my childhood but it has been absent in recent years.
Since 2013 I have been recording the ‘wind run’ data on my AWS, a stat generated by the amount of times the anemometer spins.
The results show there has been nearly two-and-a-half times more wind than the 5-year average.
Stormy weather over the equinox is one of the less frequent recurring singularities. The meteorologist Philip Eden a few years ago noted that ‘Mid-September storms’ during the period of 17th to 24th September had a frequency of 60 per cent.
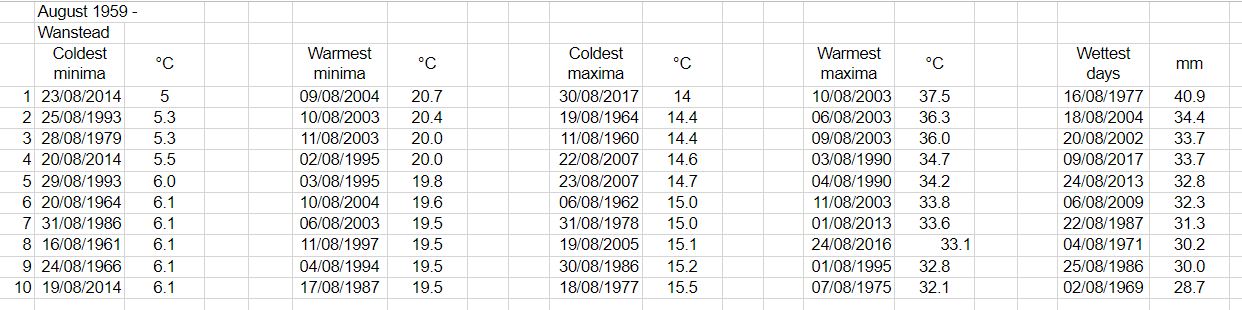
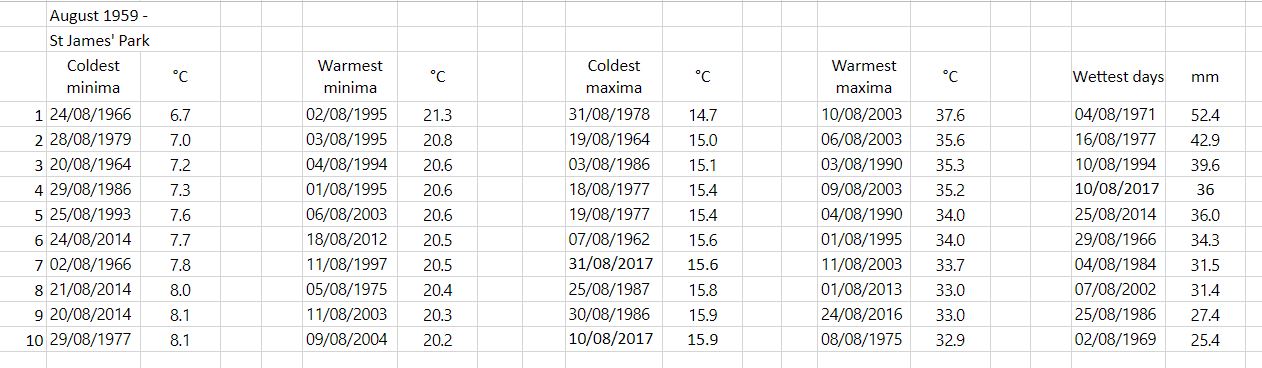
For the past few years August has often failed to match up to June and July for hot, summery weather. Looking at the models this August promises something very warm though whether it is another 1995 or 2003 is anyone’s guess.
I’ve put together a few top 10s of stats for Wanstead, St James’s Park and Heathrow for the month of August.
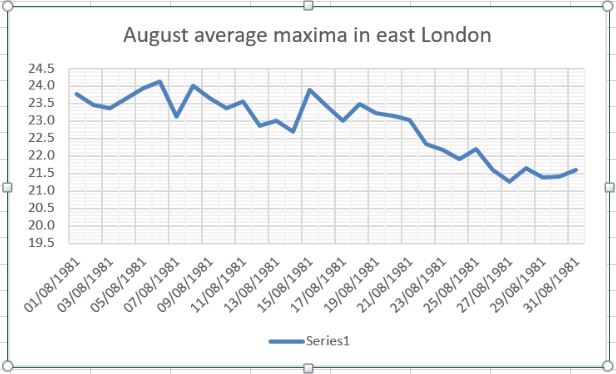
In terms of climatology August maxima, considering the 1981-2010 average, shows a fairly steady decrease through the month, though around the 15th there is often a spike before a steady decrease to month’s end. This would reflect the late August winds singularity which occurs every year around the 20th at 67 per cent probability.
The average rainfall graphic shows that downpour amounts are fairly random from year to year. The driest days are the 15th and the 30th.
Recent weather patterns have seen much high pressure to our north keeping us dry and mostly sunny but, aside from June, protected from humid Spanish plumes.
A look at local east London stats shows that half of the last 10 July months have been warmer than average while only two have been much drier than average.
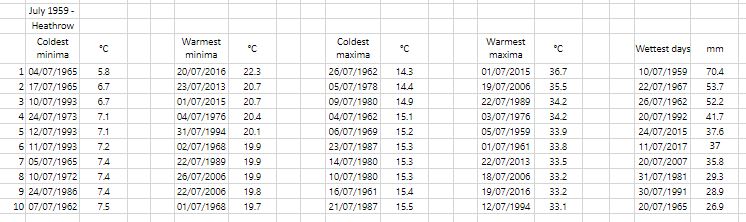
I’ve put together a few top 10s of stats for Wanstead, St James’s Park and Heathrow for the month of July.
Some national UK July values according to TORRO
Hottest: 19th 2006: 36.5C at Wisley, Surrey.
Coldest: 15th 1977: -2.5C at Lagganlia, Highland.
Wettest: 18th 1955: 279.4.8mm at Martinstown Dorset.
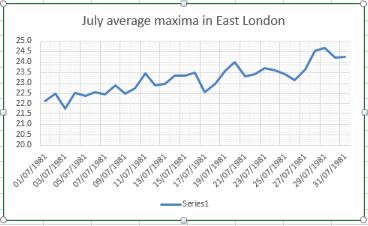
In terms of climatology July maxima, considering the 1981-2010 average, shows a fairly steady increase through the month, though around the 17th there is often a dip before a warm end. This would reflect the July heatwave singularity which occurs every year at 80 per cent probability.
The average rainfall graphic shows that downpour amounts are fairly random from year to year. The driest days are the 1st and the 25th.
A look at local east London stats shows that six of the last 10 Junes have been warmer than average while half have been much drier than average.
I’ve put together a few top 10s of stats for Wanstead, St James’s Park and Heathrow for the month of June.
Probably most notable from the below values is that recent Junes have been devoid of extreme cool temperatures and rainfall.
Snow has been known to fall in June, in 1975.
Rain is usually most frequent in the last week of the month.
The 10 driest Junes were:
Some UK May values according to TORRO
Hottest: 29th 1957: 35.6C at Camden Square, London. Also Southampton 28th 1976
Coldest: 9th 1955: -5.6C at Dalwhinnie, Highland. Also June 1st and 3rd 1962: Santon Downham, Norfolk
Wettest: 28th 1917: 242.8mm at Bruton, Somerset
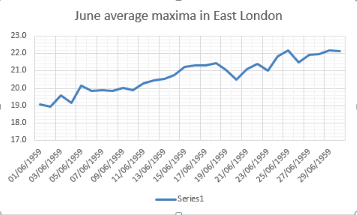
In terms of climatology June maxima, considering the 1981-2010 average, shows a gradual increase through the month, though around the 19th to the 21st there is often a dip before a warm end. This would reflect the June Monsoon which occurs every year at 77 per cent probability.
The average rainfall graphic reflects this, showing a four-day wetter spell after the 20th.


 In terms of climatology July maxima, considering the 1981-2010 average, shows a fairly steady increase through the month, though around the 17th there is often a dip before a warm end. This would reflect the July heatwave singularity which occurs every year at 80 per cent probability.
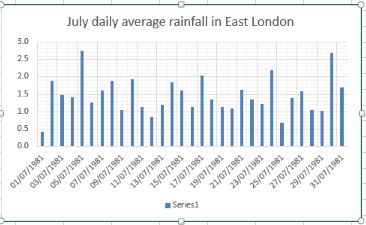


 In terms of climatology June maxima, considering the 1981-2010 average, shows a gradual increase through the month, though around the 19th to the 21st there is often a dip before a warm end. This would reflect the June Monsoon which occurs every year at 77 per cent probability.

You must be logged in to post a comment.