The morning of December 11, 2022, began cold after an overnight frost that saw temperatures fall to -5.3C. Freezing fog lasted through the day, coating everything in rime to set the stage for what was to be one of the most notable snowfalls in years.
Precipitation started just before 7pm with a mix of rain, ice pellets and wet snow, this soon turning to all snow within 10 minutes and settled fast.
By 9pm there was a good 6cm; Wanstead Park was soon transformed.
By midnight the snow had stopped, leaving a good 13cm out the back
Yesterday's snow sequence shows how concentrated this event was and that Wanstead seems to have been the area that benefitted most. It also seems to have died rapidly over the Chilterns @LondonSnowWatchpic.twitter.com/RYO5RijQXw
The best chance for lying snow this winter looks like being at the end of the second week of January.
A combination of local analogues and global atmospheric factors including the El Niño-Southern Oscillation suggest that the coming season will be colder than recent years. Though that’s not saying much considering just how mild winters of the past decade have been.
Meteorological autumn was the warmest for 5 years and slightly drier than last year’s wet autumn. Though it shares some similarities with 2015 the external influences are thankfully different to that season which produced the warmest December on record. Considering data back to 1797 I was able to make the following suggestions on how the next 90 days may unfold.
December is most likely to be around average temperature-wise with rainfall also about average. Possibly stormy at the end of the first week. Any snowfall events are likely to be marginal – bad news for anywhere below 70m above sea level. In terms of Christmas a white one in London looks unlikely. There may be interest in the week running up to the big day but I wouldn’t be surprised to see that inexplicable warm up that often happens just as the 25th arrives. Mean: 5.8°C (5.6°C 1981-2010 average) Rainfall: 57.1mm (53.2mm 1981-2010 average)
January is the month most likely to see any lying snowfall, particularly during the first half of the month, with the mean temperature about 1C colder than average. Rainfall is likely to be above average. Mean: 4.1°C (5.2°C 1981-2010 average) Rainfall: 63.8mm (53.2mm 1981-2010 average)
February looks wet and mild overall. Mean: 6°C (5.3°C 1981-2010 average) Rainfall: 55.6mm (39.2mm 1981-2010 average)
Overall the mean for winter: 5.3°C, a little below average. And rainfall about 120 per cent higher than average.
Looking in closer detail reveals that the coldest period is most likely to be between 13th and 19th January, with anomalies sufficiently low enough for lasting lying snow.
The extremes that no-one can forecast
As well as the extreme December 2015 the analogues also revealed the severe season of 1822-23 which saw ice on the Thames by late December. February 8th saw a great snowstorm in northern England where people had to tunnel through the snow.
Another was 1950-51 which was very snowy at high levels. There were 102 days of lying snow at Dalwhinnie (1000ft), exceeding the 83 days set in 1946-47. December 15th saw 15in of snow in Shanklin, Isle of Wight in 3.5 hours.
The outlook for possible snow over the weekend reminds me of a similar synoptic set-up in December 1990 that left large parts of the Midlands northwards covered in deep snow, but that delivered only cold rain to the London area.
2017
1990
The situation in 1990 is explained on the excellent Booty Weather site.
“A low formed dramatically over central England on the 7th, large quantities of rain, turning in many places to snow, fell on its western and northern flanks. On the 7th and 8th very heavy snow fell over northern England, Wales, the Midlands and south west England, with heavy drifting in gale force winds, causing considerable disruption to traffic and cutting power lines.
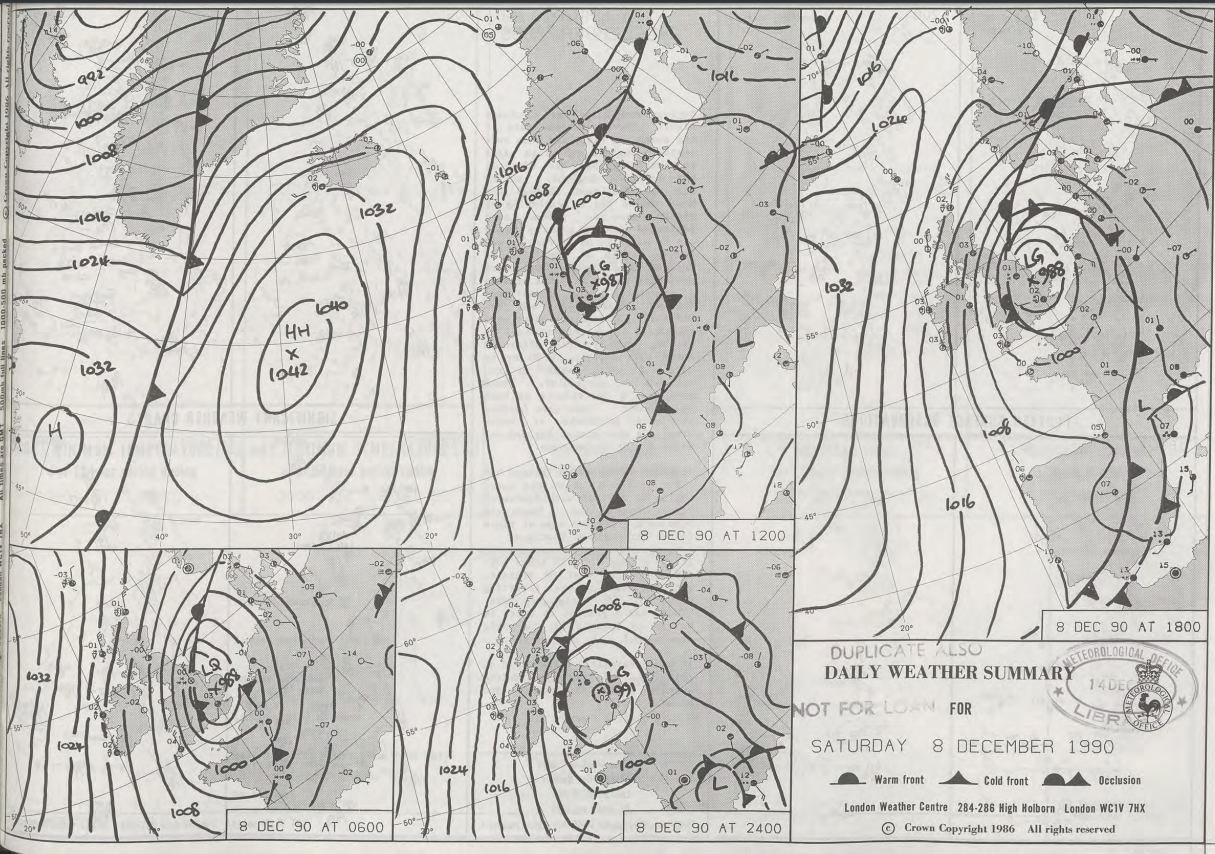
“The snow did not freeze, however, but melted very rapidly during the next few days, as the temperature rose a little. By late on the 8th, many parts of the Midlands had 20cm or more of lying snow. Acocks Green, Birmingham, reported 42.5cm on the 8th. The Peak District had 38cm at Middleton and 25cm at Winksworth. Newcastle under Lyme reported 28cm, and many other places had more than 20cm. Drifts up to 60cm on motorways in the Derby area, and at Carlton in Coverdale, near Leyburn, a report of 240cm. Snowfall on the 9th in the Dorchester area in 1990 was the heaviest pre-Christmas fall in that area since 9 December 9th, 1967.”
My stats in London suggest that the system was a bit of a non-event here. Another account of December 1990 is covered here.
Met Office synoptic charts, general situation and surface obs for December 8th 1990
The winter of 2015/16 was skewed by a ridiculously mild December which brought the natural calendar forward three months.
A persistent flow of air from the Azores caused the unseasonable warmth in December, skewing the overall temperature for the season
Daffodils and other spring bulbs which normally come out in early March in this part of the UK Â were in full bloom at the end of December. Spring blossom was also very early with many may trees out in early February.
The mean temperature for the season finished 7.38C, that’s 1.9C above average. It was the third warmest winter in my series going back to 1797, behind 1989 / 90 and 1974 / 75.
Rainfall was almost precisely average: 144.8mm fell, within half a millimetre of what normally falls. Sunshine was just under average: 162.8 hrs is just over 5 hours short of what we’d normally expect during December, January and February.
The warmest day of the winter occurred on December 19th with 16.3C recorded, the second warmest December day in my daily record going back to 1959 – the record fell short by just 0.1C.
Snowfall, like the previous two winters, was very scarce
The coldest night of the winter coincided with the coldest mean temperature on January 19th. A low of -5.7C was the lowest value recorded in Wanstead for three years.
The wettest day of the winter occurred on January 10th when 11.6mm, a very unremarkable amount for winter and in complete contrast to the deluge that affected NW England and NE Scotland. There were 51 rain days (where 0.2mm or less fell) and 37 wet days (where 1mm of rain falls over a 24hr period).
Although sunshine was around average there were 24 sunless days.
Snow, like the previous two winters, was very scarce: just one day of snow falling and lying occurred on January 17th, though you had to be up early to see it.
So, all in all, not bad. The Daily Express and others should take note. This is what they printed last November… I’ll leave it up to the reader which forecast was more useful…
The coldest night in three years was recorded last month together with the first lying snow in January since 2013 – though you had to be up early on Sunday 17th to see it.
Snowfall on the 17th was just over 1cm deep at High Beech. In Wanstead it was just a thin covering that was gone by midday
For anyone looking for ‘traditional’ winter weather it was pretty desperate stuff and seems a continuation of the mild winters of the past three years.
Apart from a mild final week much of the month was rather cold with a couple of sharp night frosts that affected many early daffodils that bloomed during the super mild December.
Rainfall of 65.8mm was 124% of average – very similar to last January’s total. Mean temperature for the month was 5.8C, 0.6C above the 1981-2010 mean. It felt far cooler, however, because the December mean was 5C above average.
Sunshine was just above average. Over 54 hours were recorded, 108% of what we can expect to see during an average January.
The wettest day occurred on the 10th with 11.6mm.
Air frosts: 6
Ground frosts: 18
So what has February got in store weatherwise? There is no sign of any longer term changes in the pattern of synoptics across the UK. All models continue to suggest a very volatile jet stream with resultant low pressure close to or across the UK for much of the first half of February.
The snow on the 17th fell during the early hours of the morning
This week westerly winds will remain strong with severe gales in the north in association with Storm Henry over the next 36 hours. The current mild and damp conditions in the south should be replaced with colder, showery air moving south later on Monday, lasting into Wednesday. On Thursday another large warm sector will move up across the UK from the SW returning mild and damp conditions.
At the weekend all models show low pressure areas taking a much more southerly route across the UK with gales and wet weather. While no cold weather looks likely there may be incidences of very heavy and thundery showers. Only GFS on Monday is showing any hint of more settled, colder weather at the end of the period.
Using my long range method February is looking average, very dry and dull.
A mean of about 5.9C, just over average, is the highest probability at 71%. Something ‘rather mild’ comes in at 29% probability.
Rainfall is looking low: 15mm represents something 38% of average.
Sunshine totals will be low and it could be a dull month, around 60 hours of sunshine, that’s just 82% of average.
My January outlook for temperature good. I predicted a mean of 5.2C (outcome: 5.8C) with 59mm of rain (outcome: 65.8mm).
Here follows the full weather diary for December. To view full stats follow this link:http://1drv.ms/1kiTuzv
1st: Bright after sunny, clear dawn before clouding over with light rain. Rain at midnight.
2nd: Cloudy start after early overnight rain. Rainy spells and blustery throughout the day.
3rd: Drizzle to start then damp before more rain moved in at 11.30am – this fell intermittently through the day and evening and was often heavy.
4th: Bright, damp start after overnight rain. Some light outbreaks up to 2pm.
5th: Sunny, clear and cold start with contrails dotting the sky. Clouding over later with rain after 6pm. Misty around midnight.
6th: Bright, very damp start. Mostly cloudy with rain in the evening and overnight.
7th: Dull start with outbreaks of rain spreading in, some heavy and very blustery. Drying up after lunchtime though feeling cold. Cool overnight with frost on cars with a very brief shower on school run.
8th: Bright start though light showers around. Gradually clouding over. Clearer spells overnight and cool.
9th: Bright start though with plenty of cloud around. Showers, some heavy with small hail at 8.30pm. Clear spells overnight.
10th: Bright start after overnight rain. Cloud gradually decreasing to leave it clear at noon. Cloud returned after dusk and thickened up around 9pm. Heavy rain from midnight.
11th: Cloudy, damp and cold start. Some breaks after noon then clear spells overnight and cold.
12th: Sunny, cold start. Clouding over at midday to leave cold-feeling afternoon and overnight – too much wind for a frost.
13th: Bright, cold start but turning mostly cloudy. Rain in the evening and on ride home.
14th: Rainy. cold start, then cloudy with sunny intervals. Cold air digging in from midday.
15th: Sunny all day with just a few cirrus. Took a while for frost to form properly.
16th: Sunny, frosty start with just a few cirrus. Variable cloud and evening in London felt freezing. Some drizzle, this turned heavier and by 4am thick flakes were falling to give a thin covering. Some 1cm at High Beach during a bike ride.
17th: Cloudy start. Thin covering of snow (<1cm) thawed by lunchtime. Cloud built into afternoon to leave chilly evening.
18th: Bright start but sunshine was weak so felt cold. Mostly clear into the evening allowed for an early frost. A classic radiative cooling night until the early hours, assisted by a very gentle low-level flow off the continent where there were some very low dew points. Between 2am and 6am there was some thin, high-level cloud that drifted across, which stopped the radiative cooling. Warmth from the ground then briefly lifted the temperature until, once more the cloud cleared after 6am and allowed the temperature to fall again to its minimum of -5C at 0809z. There was also a little mixing of the layers of air between 2 and 6 which would also have had a cooling effect. Had it not been for the cloud I’d suggest that the low could have fallen to -6.2C, which would have been the coldest since February 2012 when it fell to -9.2C over full snow cover.
19th: Sunny all day with occasional alto-cumulus drifting across. Another cold night, the coldest in 3 years.
20th: Bright start with lots of scattered cumulus. Sunnier early afternoon and less cold. Another frost quickly forming after dark.
21st: Frost lifting quickly then cloudy with limited brightness throughout the day.
22nd: Cloudy start with rain arriving at 9.05am. Bursts through the day until early afternoon. Some brief brightness in the late afternoon.
23rd: Sunny, cool start. Clouding over with rain in the evening. Very mild.
24th: Cloudy start after overnight rain. Mostly cloudy with odd spot of drizzle though bright.
25th: Sunny, clear start though cloud bubbled up at 11am to leave mostly cloudy afternoon. Clear spells overnight and chilly.
26th: Cloudy and increasingly gusty up to midday. Some rain in the evening.
27th: Cloudy, blustery start.
28th: Sunny all day with just a few clouds around noon.
29th: Cloudy and breezy with some drizzle in the wind early afternoon. Report of 101mph gust on Shetland from Storm Gertrude. Wind seemed to strengthen at midnight before rain arrived.
30th: Cloudy and damp start after overnight rain. Sky soon cleared to leave mostly sunny afternoon.
31st: Drizzle in morning as warm front moved in.
During the opening months frequent cold blasts brought much wintry weather. Cold weather at the end of January turned severe during the second week of February.
In the early hours of the 7th heavy snow, driven by gale-force north-easterly winds, brought some of the worst winter weather this area has ever seen. Some 35mm of precipitation is recorded on the 8th – this would normally give at least one foot of level snow that could obviously be whipped up into huge drifts.
Luke Howard described the scene in his diary entry saying the abundance of snow “loaded the trees to their tops and weighed down the smaller shrubs to the ground.”
The snow and polar continental air also produced perfect conditions for a textbook radiative cooling night within two days of the snowfall. The minimum recorded on the morning of the 10th: -20.6C has not, as far as I can tell, been repeated since.
To put that into perspective the lowest minimum of the severe winter of 1963 for this area was -12.2C recorded at Greenwich on January 21st. The coldest night I have personally recorded was -10.3C on January 12th 1987.
Howard, who would have taken readings at his laboratory in Stratford and home in Tottenham, remarked on the rare occurrence of the cold and said that the thermometer had remained below 0F (-17.8C) for a number of hours: “an occasion that happened less than five times within a century – the last appearing to be 19 years previous.”
Howard’s theory of the day was that such extremes didn’t occur during long continued frosts but rather at an interval of one winter after such a season. He mentions the frost of 1794-95, which lasted 44 days, immediately before which the thermometer fell to -2F. The following year a low temperature of -6.5F was recorded. The year 1816 followed the cold winter of 1813/14 – the same pattern, so Howard was prepared for the night of February 9th 1816.
Modern climatologists tend to discount these old records by arguing that standard conditions set by the World Meteorological Organisation were not met. However, Howard backs up his findings with a very thorough explanation of how he went about measuring the record low temperature that followed a freezing day where the maximum thermometer didn’t rise above -6.7C.
“Early in the evening on trying the experiment of placing a wet finger on the iron railing it was found to adhere immediately and strongly to the iron. I exposed several thermometers in different situations.
“At 8 pm, a quicksilver thermometer with the bulb supported a little above the snow stood at 0F. At 11pm a spirit thermometer in the same position indicated -4F, the former which had a pretty large bulb had not sunk below -3F. At 7.30am the 10th a quicksilver and a spirit thermometer hung overnight about 8ft above the ground indicated respectively -3F and were evidently rising.
“The thermometer near the surface of the snow had fallen to 5F and probably lower, but at the usual height from the ground of my standard thermometer the temperature was at no time below -5F. The exposure is north and very open.”
Howard goes on to describe the following day:
“From 8am the thermometer continued to rise steadily at noon a temperature of 25F was pleasant by contrast to the feeling and it was easy to keep warm in walking without an upper coat. Even at 0F, however, the first impression of the air on the skin was not disagreeable; the dryness and stillness greatly tending to prevent that sudden abstraction of heat which is felt in moist and quickly flowing air.
“Early in the afternoon the wind changed all at once to SW some large cirri which had appeared all day passed to cirrocumulus and cirrostratus with obscurity to the south. I now confidently expected rain as had happened in former instances but was deceived and the thaw took place with a dry air for the most part and with several interruptions by night.
As often happens with severe cold snaps Howard reported on the 17th that the snow “was mostly gone but very thick ice remains on ponds”; a period of just over a week.
The cold snap saw the mean temperature for February 1816 over three degrees colder than average at 0.8C.
Such extreme temperatures are rare in the capital though not unheard of. I know that there have been cases of sub -20C readings in, for example, the Rickmansworth frost hollow and Ian Currie’s Chipstead Valley, but I have never seen anything so low in east London. Could it be repeated again? Possibly, but like 1816, the synoptics would have to be absolutely perfect for it to happen.
This winter was the second sunniest on record in this region. Sunshine hours totalled 238 hours during December, January and February – that’s 142% of average and second only to 2007/08.
Winter 2014/15 was the second sunniest on record with 238 hours of sunshine
The first lying snow for two years is also a notable observation of winter 2014/15. That it lasted just a few hours emphasises how little snow there was at sea-level for the second winter in succession.
The mean temperature of 5.2C was just 0.3C below the 1981-2010 average. Some 152mm of rain fell – that’s just 7mm over the winter average.
Winter began with the sunniest December on record in my series going back to 1877. Over 90 hours of sunshine was recorded in this area which is 224% of what we can expect to see during an average December.
January saw the first falling snow in nearly two years with the last three days of the month seeing the first flakes of winter – nothing much to write home about by average winter standards.
February produced the first lying snow in nearly two years. The 1cm depth at 9am on 3rd, however, is nothing much to write home about by average winter standards.
The wettest day during the three months was January 12th when 13.1mm fell.
Snow fell on 6 days. Air frosts: 27 Ground frosts: 48
Full stats for winter can be found here:Â http://1drv.ms/1rSfT7Y
At the end of November I published my annual winter forecast. I said the season would *probably* be colder with a better chance of snow than last winter. If I’m honest I thought we’d see more incidents of snowfall though, with my predicted mean temperature of 4.2C being exceeded by 1C, the air around the UK just wasn’t cold enough for snow at sea level. My predicted rainfall was more impressive – I forecast 156mm and was out by just 4mm!
Obviously when the season is average long-range forecasts like this have a much higher chance of being correct. One could argue that basic climatology has made my forecast look a reasonable one. But I stick to what the stats suggest and try to steer clear of the endless hyperbole published almost daily by certain tabloids.
There is a higher chance of snow this year. The average for lying snow in Wanstead at 9am in winter is 6 days
Probabilities for winter for the London area would be a more apt title for this post but that’s not very exciting compared with the hyperbole published almost daily by the likes of the Daily Express.
Much has been written about the sources of their forecasts over the past couple of years. Splash headlines that promise Armageddon Arctic conditions or Biblical blizzards never seem to materialise. So without boring you further I’ll move on to my own views on how I think the next 90-odd days will unfold.
Taking into account more sophisticated methods than my own there seems to be a signal for something colder than last year – though that’s not saying much given that 2013/14 was the 11th warmest winter on record with NO snow falling observed in this area.
Jack Frost could also be around more this winter than last
Though it was abandoned by the Met Office years ago I have decided to base my predictions more on analogues this year. IÂ have a lot more data at my disposal – the series I use now extends past 1881 back to 1797.
The figure I arrived at, taken as an average of the closest matching autumn periods, is a mean temperature of 4.2C with rainfall totalling 156mm over the months of December, January and February – that’s about a degree colder than average and about average rainfall – though I think it could be less given that December is looking relatively dry on the current model output.
The probability of a winter with a mean temperature of between 3C and 4C is 33% – the most likely outcome – though this low figure emphasizes the mixed signals this autumn. With this in mind a winter similar to 1984/85 is possible which saw a brief cold snap at the end of December together with a two-week cold spell that began during the first week of January. There was also a 10-day cold spell during February of that winter.
To try to add value to the above outcome I also had a look at the likelihood of this winter being as mild as last winter.
It has been noted in the past that mild winters often come in twos. I had a look back through the series to see if this was true.
The occurrence of two very mild winters in succession is 27/217 (12.4%). The occurrence of a very mild winter being followed by a very cold or severe winter is 16/217 (7.4%). So while, from these simple stats, another mild winter is more likely, it is not really high enough to consider over the average I Â found in the first calculation made from straight autumn statistics.
A final fact to consider is just how mild and wet this year has been. Every month this year, apart from August, has been warmer than average by an average factor of 1.2. If December continues warm this year could possibly end as the warmest on record. However, it is also possible that nature is about to redress the balance.
* Forecasting models use probability on any given outcome. Millions of observations are fed into the Met Office database (and other countries’ weather agencies) every day. Supercomputers then crunch through this data to give probable outcomes. With the volatility of the atmosphere it is not surprising that certainty of any outcome often falls away rapidly. Forecasting has improved greatly in the last 20 years – though anything the models churn out beyond three to five days should be handled with caution. Long range models can give *some* idea of general trends for the months ahead – but changing just one variable can vastly alter an outcome at the end of the run.
* *Over the past few months I have been collating data for the area around Wanstead. This data is freely available from the excellent Met Office library and is emailed via Excel spreadsheet. Rainfall stats include a near-complete daily archive, stretching from 1961 to 2003, from City of London Cemetery . Sadly the rainfall station, along with many others, ceased to supply the Met Office after cuts were made shortly after the turn of century. Prior to 1961 I have used monthly figures taken at the Greenwich Royal Observatory stretching back to 1881. Though this is 6 miles away the difference in temperature between the two areas would be miniscule compared with rainfall data and so can be used. I use my own stats for the period after 2003.
The Frost Fair of 1814 on the River Thames in London. Painting by Luke Clenell, entitled The Fair on the Thames, February 4th 1814
It is 200 years ago this month that London enjoyed its last frost fair.
Weeks of hard frost from the day after Boxing Day was enough to freeze the river between the old London Bridge and Blackfriars, enabling dozens of opportunist London traders to set up stalls and booths selling souvenirs, drinks and food.
Unlicensed gambling, drinking and dancing was the order of the day for those brave enough to venture on to the ice. A sheep was roasted on the ice with the public charged to look at it, and charged again for a slice of “Lapland mutton”. At one point an elephant was led across the ice at Blackfriars.
The ice was however, not very stable. Boatmen deprived of an income charged visitors a penny to cross planks to get on to the ice. They were on hand to rescue two women who fell through, although a plumber carrying lead was not so lucky.
Though changes to the flow of the Thames has vastly reduced any chance of a frost fair being repeated I’ve often wondered what the day to day climate would have to be like to freeze the Thames as it did in 1814.
Luke Howard’s Climate of London provided a starting point. His pioneering measurements of the atmosphere taken outside his laboratory by the River Lea in Stratford, though not as accurate as today’s readings, provide an excellent insight into just how cold the season was.
This line chart shows that the winters of 1813/14 and 1962/63 bore some resemblance
I was surprised to find that the stats compare well with the winter of 1962/63 – the coldest winter in recent memory. Obviously Howard’s readings would not have been as accurate as today’s – his thermometers were initially suspended in a laurel bush to shield solar radiation – but they would still have been close.
I have converted his readings  in Fahrenheit to Celsius and plotted them on a spreadsheet here. As well as records of temperature, wind, rain and moon phase Howard also included any notable weather events in his diaries from both home and abroad.
The winter of 1813/14 started mild. On December 16th he noted that “bees quit the hive in unusual numbers for the season”. During the following days up to Christmas Day wind and rain alternated with misty, occasionally frosty, mornings – probably not unlike some of the weather we experienced last month.
However, Boxing Day brought a big change: “Since the 26th we have had a succession of thick fogs with a calm air or at most a breeze from the NE. Yesterday the air cleared a little and today has been fine; a display of cirrus clouds with much red in the morning and evening sky, Â the peculiar smell of electricity has been perceptible of late when the air cleared up at sunset.” Howard goes on to report that there was an eruption of Mt Vesuvius in Italy.
The beginning of January saw the mists thicken into heavy freezing fogs: “The mists which have again prevailed for several days and which have rendered travelling dangerous.”
The view across to St Paul’s from Bankside at low tide. Images of what it looked like this month in 1814 can be seen on the Corporation of London’s website
In those days, with cloud identification in its infancy, Howard identified the fog as stratus and noted with wonder the formation of rime frost on everyday objects: “The air has been in effect loaded with particles of freezing water such as in a higher region would have produced snow. Â These attached themselves to all objects crystallizing in the most regular and beautiful manner. A blade of grass was thus converted into a pretty thick stalagmite some of the shrubs covered with spreading tufts of crystals looked as if they were in blossom while others more firmly incrusted might have passed for gigantic specimens of white coral.”
By January 5th  a “deep snow brought by an easterly wind had reduced the whole scenery to the more ordinary appearances of our winter”.  More snow followed on the 6th and piled into drifts on a strengthening NE’ly. The biting gusts presented Howard with yet another new winter phenomenon: snow rollers:  “With the temperature at the surface 33 or 34F presented an amusing phenomenon which was pointed out by my children. Instead of driving loose before the wind it was collected occasionally into a ball which rolled on, increasing till its weight stopped it. Thousands of these were to be seen lying in the fields some of them several inches in diameter”.
On the 9th Howard describes a misty morning and a snowy landscape that had a “bluish tint”. The “blueness” of the air is possibly down to the sheer cold – it was -13.3C that morning. I’ve seen something similar, a bluish hue to the air, on very cold mornings in the Alps. Howard notes that the minimum on the surface of the snow that night, the coldest of that winter, was -14.4C.
The River Lea close to where Luke Howard’s laboratory stood
On the 11th a “very red” sunrise was observed . By the 12th Howard describes the Arctic scene from his laboratory: “The River Lea is now firmly frozen and the Thames so much encumbered with ice that navigation is scarcely practicable.” Howard also notes on this date that the snow in upper parts of Hampshire and “on the Hind Head” had fallen to a depth of 15 feet in places.
A slight thaw was noted on the 16th from the warmth of the earth. More snow fell on the 18th and 19th. Snow on the 20th was accompanied by a strong NE’ly. On the morning of the 21st Howard noted drifts “many feet deep”.
The 22nd to the 25th saw more outbreaks of snow before the wind swung into the SW on the 26th with snow followed by rain – the cold spell was beginning to lose its grip. Howard notes on the 29th: As the barometer began to rise the wind came round by SW to NW and blew with great violence till near morning”. Classic freeze/thaw conditions followed over the next few days before the real thaw, and the end of the frost fair, arrived on February 5th. Howard notes: “Crimson sky at sunrise hollow wind snow and sleet. 6th A gale from SW with showers of rain at evening.”
The rest of February, and meteorological winter, appears fairly nondescript. Howard notes that on the 12th a gunpowder explosion resulting in a fire at the Custom House, 5 miles south, caused a  “shower of fragments of burnt paper”. Sharp frosts and misty mornings prevailed to end of month, Howard noting the “clear orange twilights”, probably caused by the eruptions in Italy that formed a new crater on Vesuvius. Howard mentions a letter he received from Heligoland on February 21 which had also seen intense frost that was preceded by thick fogs and heavy falls of snow. The latter was 10 and 12 feet deep – the frost lasting six weeks.
Howard wrote his own account of the frost fair…
“The Thames Frozen Over
January 15: The masses of ice and snow had accumulated in such quantities at London Bridge on the upper side yesterday that it was utterly impossible for barges or boats to pass up. During the whole of this week that part of the Thames below Windsor Bridge called Mill River has been frozen over and has been crowded with persons skaiting.
February 3: The confidence of the public in the safety of the passage over the frozen surface of the Thames was yesterday increased. All the avenues from Cheapside to the different stairs on the banks of the river were distinguished by large chalked boards announcing A safe footway over the River to Bankside and in consequence thousands of individuals were induced to go and witness so novel a spectacle and many hundreds had what we cannot help terming the fool hardiness to venture on the fragile plain and walk not alone over but from London to Blackfriars Bridge. Several booths formed of blankets and sail cloths and ornamented with streamers and various signs were also erected in the very centre of the river where the visitors could be accommodated with various luxuries. In one of the booths the entertaining spectacle of a sheep roasting was exhibited
February 7: Friday several printers brought presses and pulled off various impressions which they sold for a trifle eg Printed to commemorate a remarkably severe frost which commenced December 27, 1813, accompanied by an unusual thick fog that continued eight days and was succeeded by a tremendous fall of snow which prevented all communication with the Northern and Western Roads for several days. The Thames presented a complete field of ice between London and Blackfriars Bridges on Monday the 31st of January, 1814. A Fair is this day February 4, 1814, held and the whole space between the two Bridges covered with spectators. This field of ice was indeed a very rugged one consisting of 1 masses of drift ice of all shapes and sizes covered with snow and cemented together by the freezing of the intermediate surface. The deceitfulness of the latter caused as is too common on such occasions the loss of some lives by drowning. The following passage announcing the opening of the river soon after is worthy of preservation on account of the spirit in which it is written.
February 11: We are happy to see the lately perturbed bosom of Father Thames resume its former serenity. The busy oar is now plied with its wonted alacrity and the sons of Commerce are pursuing their avocations with redoubled energy. Cheerfulness is seated on the brow of the industrious labourer those who were reduced to receive alms as paupers again taste the sweets of that comparative independence with which labour crowns the efforts of the industrious. What a fruitful source of congratulation does this prospect afford nor can the contemplative mind dwell on the subject without feeling gratitude to that beneficent Being who in a time of such calamity opened the hearts of the benevolent to administer from their abundance to the necessities of their poorer brethren and thus add cement to the bond by which all mankind are linked together. The mischief done on the river during the late frost is greater than can be remembered by the oldest man living. Among the craft alone it is calculated to amount to upwards of 10,000 independent of the damage sustained by the cables tackle & of the shipping.”
You must be logged in to post a comment.