The average maxima in Wanstead so far this summer is 22C, some 0.8C higher than in 1990 – the year an August heatwave saw the UK’s max record broken with 37C in Cheltenham. Media at the time said: “I wonder if the UK will ever see 100F?
The temperature in Wanstead on August 3rd reached 35.8C, my station notes for the day say: ‘dry, sunny and very, very hot’.
Will we see a similar heatwave next month? The weather models tonight suggest not, a flat westerly flow keeping any extreme heat in Iberia.
However, in keeping with summers that occur after an El Nino event, the core of any heat usually happens in late summer – August into September.
With the El Niño–Southern Oscillation (ENSO) trending toward neutral I thought it would be interesting to see how east London’s climate has been affected over the past year.
Using the 12-month rolling mean for this station the difference is an increase of 0.24C. The increase in rainfall, using the 12-month rolling average, is more stark with an increase of 100.9mm.
I had a look at all other El Nino events back to the early 1960s. Some 5 of 7 events saw an increase in the rolling average mean.
The 12-month rolling average rainfall similarly saw an increase in 5 of the 7 events.
The most notable event was May 1997 to May 1998 which saw the temperature increase by 1.67C and a massive increase in rainfall of nearly 300mm.
The mean for June in east London was 16.2C, 0.2C warmer than average though the coolest 6th month for 11 years. So yet another warm month – it is now 18 months since we saw a below average one.
Rainfall was on the low side, just 15mm was 29% of average, the driest June for 6 years and 20th driest locally since 1797. Today also moves us into meteorological drought territory – 15 days since there was last measurable rain (>0.2mm)
Sunshine at 204.6hrs was 115% of average, the dullest for 3 years.
The most notable day was probably the 15th with thunder and lightning and a heavy shower at 1230-1300. Further moderate showers in the afternoon.
So, far from being the ‘crap summer’ some are portraying it summer 2024 so far is pretty average here.
More of the same for July. Perhaps a couple of hot days but any prolonged heat staying to our south?
As thought months ago with ENSO moving toward neutral August should be the month with the best chance of any heat records being broken?
Here’s a few extremes for the month of July across the capital.
It’s been a wet winter so far. Some 177mm has fallen in Wanstead – already 122 per cent more what falls in an average winter.
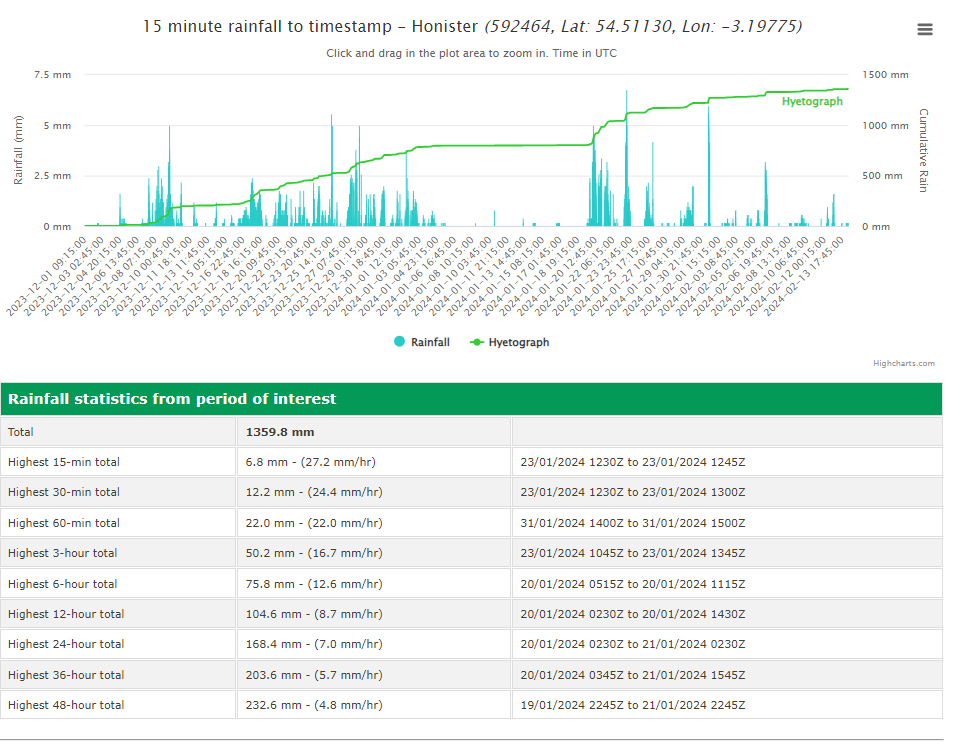
But the amount pales into comparison with the Lake District. Since December 1st 1360mm has fallen at Honister, a station close to Seathwaite which proudly proclaims itself as ‘England’s wettest place’.
Over a calendar year the area usually sees 5.6 times the amount of rainfall of London. However, this winter the total of 1360mm makes it 7.7 times wetter! A testament to just how persistent the SW’ly airstreams have been this season. And a reminder that the Lake District is the called the Lake District for a reason.
Continuing on from last month this blog focuses on the weather recorded at this station over the last 11 years.
A look at the twelfth month shows some interesting trends…
The 9am air pressure readings were not included in previous climate summaries owing to analogue barometers only giving approximate air pressure readings. The advent of AWS has changed that, particularly for independent amateur observers.
A look at the below graphic shows pressure falling through the first half of the month. A sharp rise is then seen before falling again – there’s often storms around the 23rd until the 27th.
Average daily windrun is how much wind there’s been during a 24 hour period. The 23rd comes out as windiest.
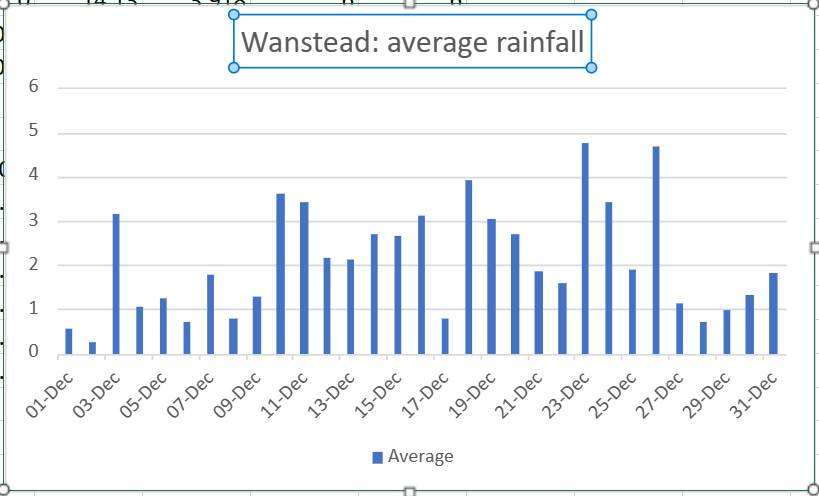
Average rainfall shows precipitation building through the month, to peak on the 23rd before a sharp drop off after the 27th.
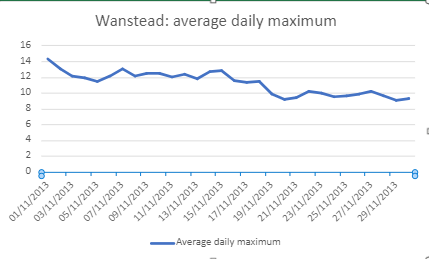
Average daily maximum temperatures during December show a stuttering first 10 days before a steady rise through the next fortnight before a steady fall off from the 23rd .
Average daily minima is up and down in the first 10 days before a steady rise from the 11th. Again there’s that falling off a cliff on the 23rd. This pivotal date, being so close to Christmas Day, is one of the reasons why ‘will it, won’t it be a white Christmas’ is a perennial fascination among the nation.
October 18th this year heralded a run of weather where it has hardly stopped raining in this part of the south-east.
Since that date there has been 101mm of rain with 22 ‘rain days’, 24 hour periods where there’s been 0.2mm of rain or more. Just one of the last 24 days has been completely dry.
In terms of the 1991-2020 average the amount represents just under twice the usual amount of rainfall at this time of year.
In terms of unusual weather patterns it is up there amongst the ‘top 10’.
What does it mean for the coming winter. Impossible to say on a small scale but I’m guessing wet and mild in the south. Note however that 1960/61 and 1998/99 had a number of maritime northerly outbreaks which added up to an average winter in Scotland, and plenty of snow for the Highlands.
Also note how similar this autumn is to last year when the snowy spell in December came out of nowhere.
Samantha Burgess, deputy director of the Copernicus Climate Change Service, said: “October 2023 has seen exceptional temperature anomalies, following on from four months of global temperature records being obliterated. We can say with near certainty that 2023 will be the warmest year on record, and is currently 1.43ºC above the preindustrial average.”
On a local scale the average maximum temperature, considering the rolling 12-month average, has actually decreased 0.6ºC compared with last year at this date.
Looking at the last 10 years the past 12 months have been the 3rd warmest. With a building El Nino it could be assumed that next year will see a greater increase in anomaly here but, 2015 suggests, positive ENSO can actually lead to a decrease. As can a La Nina lead to an increase, as shown in 2022.
The climate system of the world is complicated in that it doesn’t warm uniformly which leads to problems when a sizeable part of a population look out of their windows and see weather that is cold and miserable. That social media lists the ever increasing number of weather disasters around the world doesn’t seem to make a difference.
Governments and agencies have their work cut out trying to convince enough people that we really must better look after the world, starting in our own back yards.
As Burgess adds regarding the United Nations Climate Change Conference later this month: “The sense of urgency for ambitious climate action going into COP28 has never been higher.”
The current site hosting Wanstead’s weather station has been running for 11 years this month; the automatic station uploading data every 10 minutes to the internet.
A look at the eleventh month shows some interesting trends…
The 9am air pressure readings were not included in previous climate summaries owing to analogue barometers only giving approximate air pressure readings. The advent of AWS has changed that, particularly for independent amateur observers.
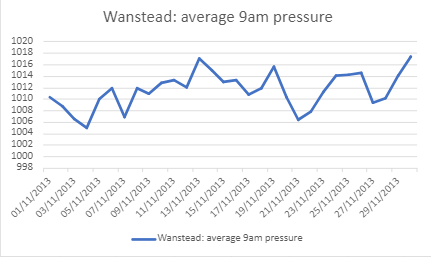
A look at the below graphic shows pressure lowest around the 4th, the stormiest weather of the month. Storm Ciaran in 2023 is proof of that.
Average daily windrun is how much wind there’s been during a 24 hour period. The 21st comes out as windiest, the date when in the past there has been some notable early snowfalls in the south of the UK.
Average rainfall shows most precipitation in the first two thirds of the month with the biggest fall of rain on the 19th.
Average daily maximum temperatures during November take a general decline but, again, there’s a notable fall away on the 20th.
The mean for this October finished 13.1C, 1.3C above average. That’s 15th warmest locally since 1797 and 0.6C down on last year! Notable given the start was nearly 6C above average.
Rainfall finished 96mm, 144% of average. Which sounds a lot. But considering the last 5 years it would be third wettest – such is that October now seems to be a default wet month. Back to 1797 it would place 47th.
Looking at the average 9am pressure things really went south after the 17th.
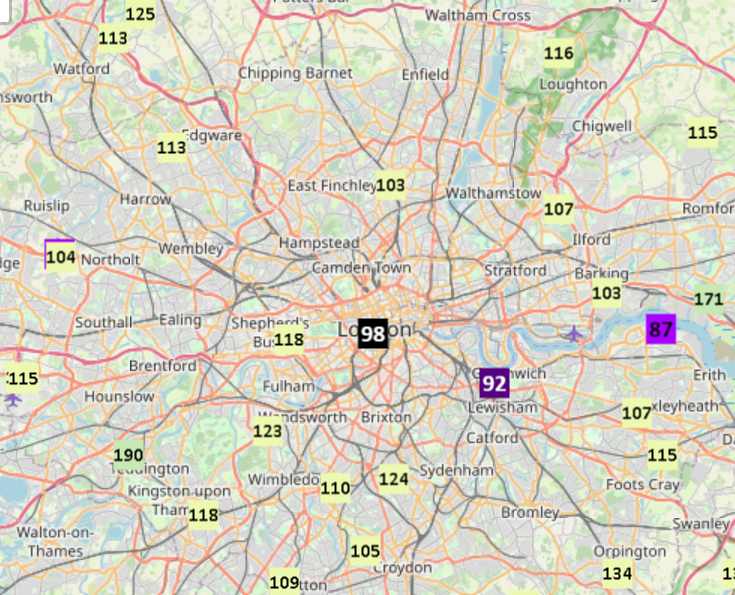
Looking at London as a whole rainfall at this Wanstead station was closer to the total at St James’s Park than Redbridge Roundabout!
And further afield check out how much wetter the south coast was.
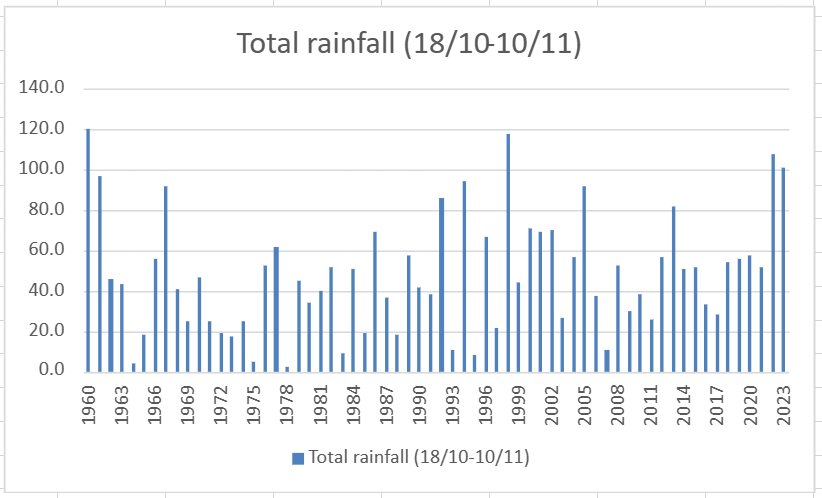
Tracking the rolling 12-month daily rainfall total allows a ‘real-time’ look whether an area is experiencing a drought or a deluge.
This week’s figure represents the 8th highest at this date since 1962. So not unusual. Until you look at the jump since last year. Some 303.6mm the past 12-months just pips the same period in 1976-77.
What is perhaps most noticeable is that this year follows last year’s negative fall which was the largest since 1961.
It’s one rainfall station BUT the results suggest a climate that is swinging more violently from one extreme to the other.


You must be logged in to post a comment.