
Air pressure is probably the least celebrated meteorological statistic, most probably because unless you’re staring at a barometer all day you can’t ‘see’ it.
High pressure brings mostly fine weather while low pressure usually brings wind and rain – though it is the gradient of the isobars that can measure the impact each system can bring.
Steep falls and rises in pressure bring the most memorable events, in my case the October 1987 storm.
During the next week there will be a notable fall in pressure – but how will it compare with the past recent years? Looking at my own stats, a relatively small but complete set of 9am barometer readings back to May 2013, it does look like it will be notable.
The table below shows the numbers to beat.

As with many of these events the most impactful weather was found in the north of Scotland. The first period coincides with Storm Caroline.
The Met Office blog says Caroline brought a max gust of 93mph at Fair Isle and transport disruption and closed schools across the Western Isles.


Of course what goes down also comes up and pressure rises can be even more notable. In February 2016 the pressure rose 50mb in just three days, a week or so after Storm Imogen.

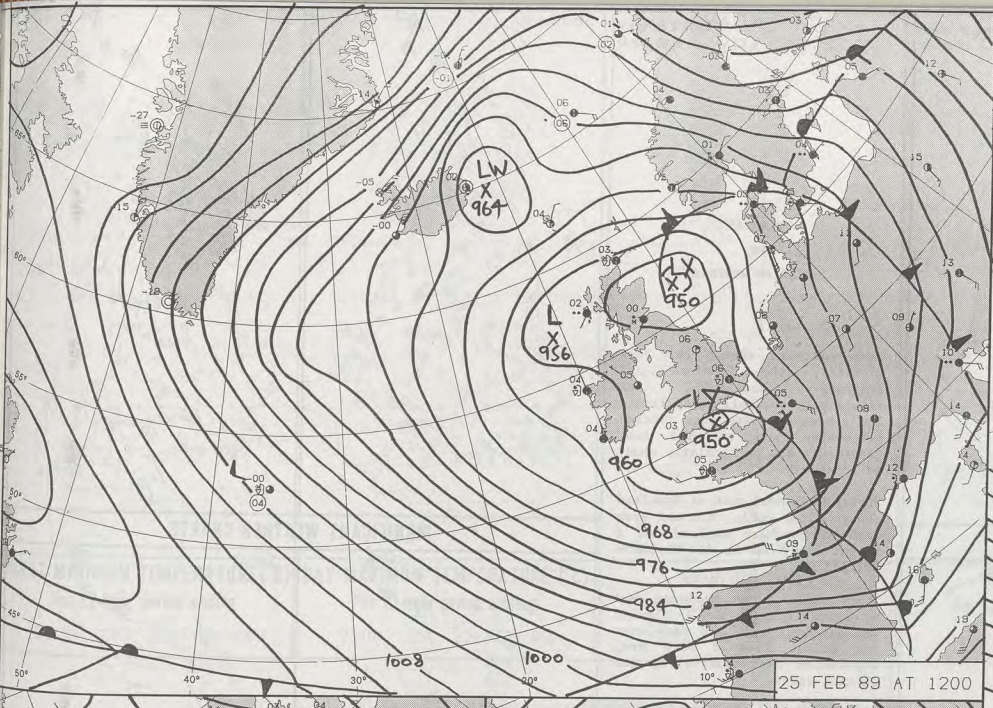
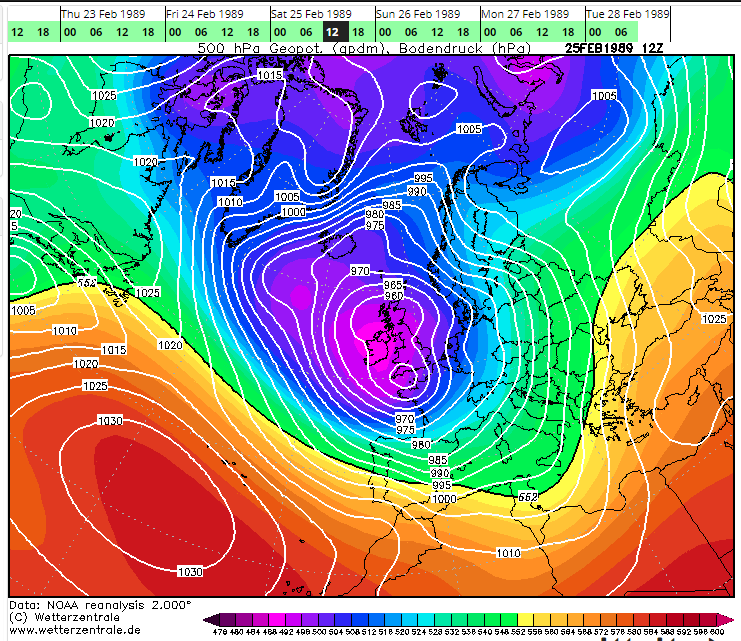
According to the Met Office FAX charts the 9am pressure in London on March 11th will be around 988mb, which would represent a fall of 48.6mb from 9am on March 6th.


You must be logged in to post a comment.