Samantha Burgess, deputy director of the Copernicus Climate Change Service, said: “October 2023 has seen exceptional temperature anomalies, following on from four months of global temperature records being obliterated. We can say with near certainty that 2023 will be the warmest year on record, and is currently 1.43ºC above the preindustrial average.”
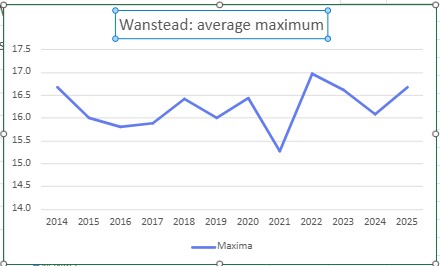
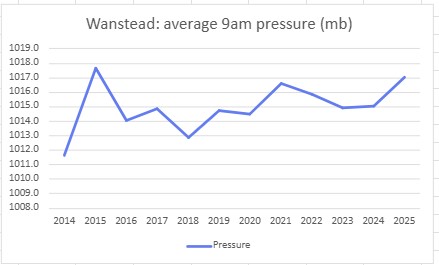
On a local scale the average maximum temperature, considering the rolling 12-month average, has actually decreased 0.6ºC compared with last year at this date.
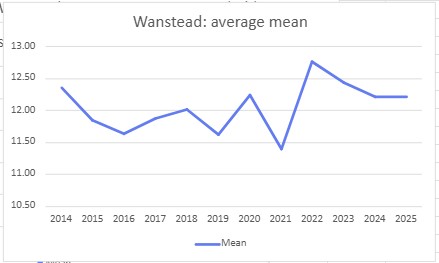
Looking at the last 10 years the past 12 months have been the 3rd warmest. With a building El Nino it could be assumed that next year will see a greater increase in anomaly here but, 2015 suggests, positive ENSO can actually lead to a decrease. As can a La Nina lead to an increase, as shown in 2022.
The climate system of the world is complicated in that it doesn’t warm uniformly which leads to problems when a sizeable part of a population look out of their windows and see weather that is cold and miserable. That social media lists the ever increasing number of weather disasters around the world doesn’t seem to make a difference.
Governments and agencies have their work cut out trying to convince enough people that we really must better look after the world, starting in our own back yards.
As Burgess adds regarding the United Nations Climate Change Conference later this month: “The sense of urgency for ambitious climate action going into COP28 has never been higher.”
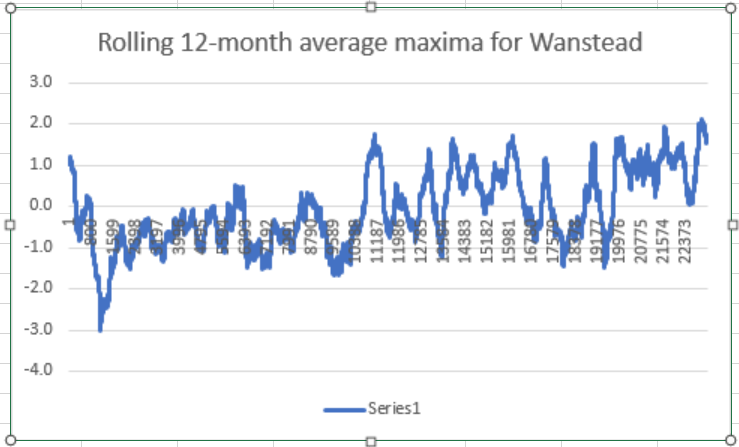
The rolling 12-month average maxima anomaly in Wanstead on June 10th is sitting at 1.6C.
Considering local statistics back to 1959 the figure reached an all-time high of 2.1C last November, a level it stayed until December 11th, when a very remarkable week of snow and frost arrived.
With unremarkable maxima for most of this year the figure has been falling. But with a building El Nino it remains to be seen if the highest anomaly ever of 2.1C will be breached.
Luke Howard‘s Climate of London volumes provide a plethora of interesting facts and figures about the atmosphere during a time when few reliable records of London weather were made.
Over a period of just over 20 years he mentions the aurora borealis being sighted somewhere in Britain 15 times.
The first, on March 3rd 1807, describes the phenomenon.
The whole hemisphere very red for some time after sunset which we ascribed to the reflection of light from elevated cirri. Our Manchester correspondent, however, states the same phenomenon at the same time as an Aurora Borealis. Additional communications decisive of this point will be acceptable. The phenomenon was repeated on the 21st which with the preceding and following night was windy.
Seven years later, on April 14th 1814, proceedings were described thus.
Aurora Borealis of late years a very unfrequent visitant in these parts appeared last night with no great degree of splendour but with the usual characteristic marks of this phenomenon. About 11pm when my attention was first called to it there was a body of white light in part intercepted by clouds extending at a moderate elevation from the N to the NW with a short broad streamer rising from each extremity. After this it became an arch composed of similar vertical masses of fibrous light which moved along in succession preserving their polarity and curved arrangement. One large streamer in particular went rapidly through nearly the whole length of the arch from W to E. Some of these masses were rather brilliant and one exhibited colours. After some cessation and a repetition of this appearance carried more towards E and W the light settled in the N and grew fainter in which situation at midnight I ceased to observe it
Further mention is made on 8th February 1817 and later that year, on 26th October, another account.
A little before 8pm I observed from the neighbourhood of Lowestoft, Suffolk, a distinct commencement of Aurora Borealis in the north in white streamers ascending to a considerable elevation which after a minute or two became converted into a still light the latter remaining for an hour or two after was at length obscured by clouds.
And the same year, as shown in the book.
More sightings were recorded on 12th and 17th October 1819 and 14th December of the same year. Also 31st July 1821.
Six years later, on 18th january 1827, an account of the Northern Lights in Epping Forest was noted.
The final case of the aurora of London was made on 25th September 1827.
Further records were noted on 15th September 1828 in Glasgow and 11th December 1830 at Ackworth, Yorkshire
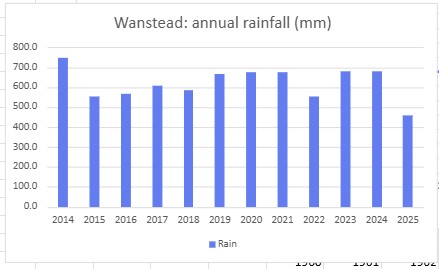
The wet theme of the final week of September carried on into October; the 100.3mm collected was 150 per cent of the 1981-2010 average, the wettest 10th month for 15 years.
The monthly mean finished 11C, that’s 0.8C below average, the coldest October since 2012. It is only the second month of 2019 where the monthly mean temperature finishes below average.
Only 72hrs of sunshine were recorded, 68 per cent of average, the dullest October since 2002.
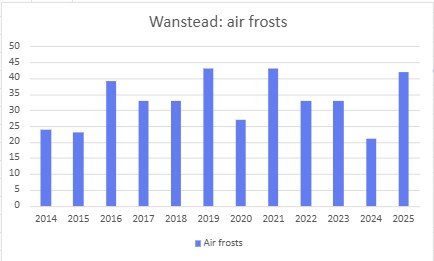
The area’s first frost arrived 10 days before the median date back to 1959. And 3 days earlier than last year. A shower with >5mm hail was observed on the 9th.
Two hundred years ago this October the extremely rare phenomenon of lying snow in October was recorded in London.
A likely plunge of Arctic air on the 21st saw rain turn to snow which lay nearly 8cm deep by the morning and remained for nearly a week.
The month started dry and warm. On the 1st Luke Howard recorded 75°F at his laboratory in Stratford. The warmth remained into the second week with 77°F recorded on the 10th, 11th and 12th.
The values from Luke Howard’s Climate of London.
The wind swung into the north on the 18th and with it arrived the first hoar frosts that were cold enough to kill garden plants.
On the 21st the cold air further dug in and with it rain that turned to sleet. Howard said: “It began to snow about noon falling in very large flakes thick and rapidly for an hour and covering the ground. Some rain followed.
“In the evening the wind rose and it blew hard in the night from NNW. At midnight came a second heavy fall of snow which continued till 6am and though at first much of it melted it lay in the morning a full three inches deep.”
Howard adds that the surroundings ‘took on appearance of mid winter with the single exception of the foliage still remaining on the trees which mingled with an enormous burden of snow presented a very singular and grotesque appearance’.
The weight of the snow was also enough to break off large limbs from fruit trees.
The snow was still lying on the 23rd and, probably caught out by the earliness of the polar plunge, swallows were seen at Stamford Hill. On the 24th a very white frost was observed with a low of 31°F recorded at Tottenham.
The event was covered in the national press. The Imperial Weekly Gazette mentions impassable roads in to London, including at Walthamstow.
More wintry weather followed in November, December and January.
Could snow fall here again in October? The probability is very low but it is not impossible, given the right synoptic conditions. Recent cases of notably positive and negative anomalies following in quick succession somewhat mirror the weather of Howard’s day.
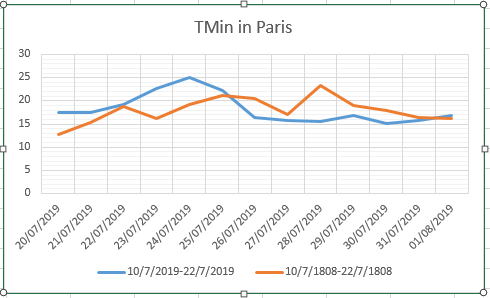
In July 1808 Paris wilted in a heatwave. The average maximum for the 13-day spell that began on the 10th was 31°C, higher than a similar spell last month that saw the all-time record for the French capital broken.
The temperature at the peak of last month’s hot spell reached 42.6°C, some 6.4°C higher than the peak of the 1808 spell but, as the graph below shows, maxima fell back more quickly than 1808.
The more ‘pointed’ nature of maximum temperature during the spell last month backs up findings of the changing jet stream; the wriggly nature amplifying the heat.
The average mean and minimum temperature of both spells showed a difference of just 0.2°C.
Since Paris recorded its hottest day ever there have been just two days where the temperature has exceeded 30°C.
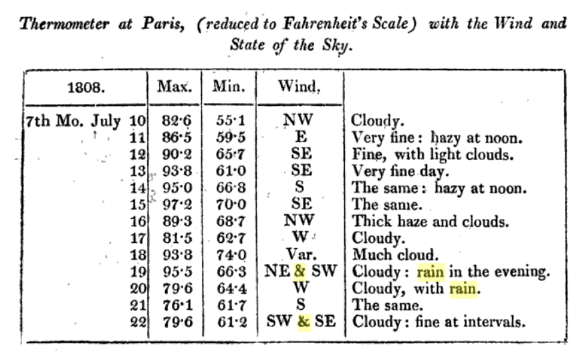
The values for the 1808 spell were listed in Luke Howard’s Climate of London.
The heat in Paris in 1808, like in 2019, was also felt in London. Luke Howard noted the following in The Climate of London.
“Very hot from July 12th to 19th. On the 12th a thermometer in perfect shade in a window in St James’s Park was 81.5 degrees at 3pm, and on the 13th at the same hour, 94 degrees. On the same day four men and seven women were killed by sunstroke in various parts of the Midland counties, and numerous coach and other horses were also killed. On the 15th a very violent and destructive thunderstorm in Gloucestershire, Monmouthshire, and surrounding counties.”
* Values for 2019 were taken from the station Montsouris.
** Though there is no way of knowing how accurate the 1808 values were previous studies have found that historic temperatures can be as much as 3°F too high.
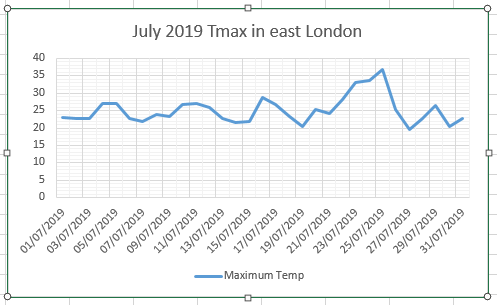
July 2019 saw the month’s daily maximum record broken on the 25th with a high of 36.8C, The reading beat the previous record set on July 1st 2015 by 0.8C and was the second highest reading recorded in this area. Cloud that drifted in mid afternoon put paid to any chance of all-time record though Cambridge, further north, managed to break the UK record with a reading of 38.7C. This temperature set in the Botanic Gardens beat the previous record of 38.5C set in Brogdale, Kent, in 2003.
Brogdale
Cambridge
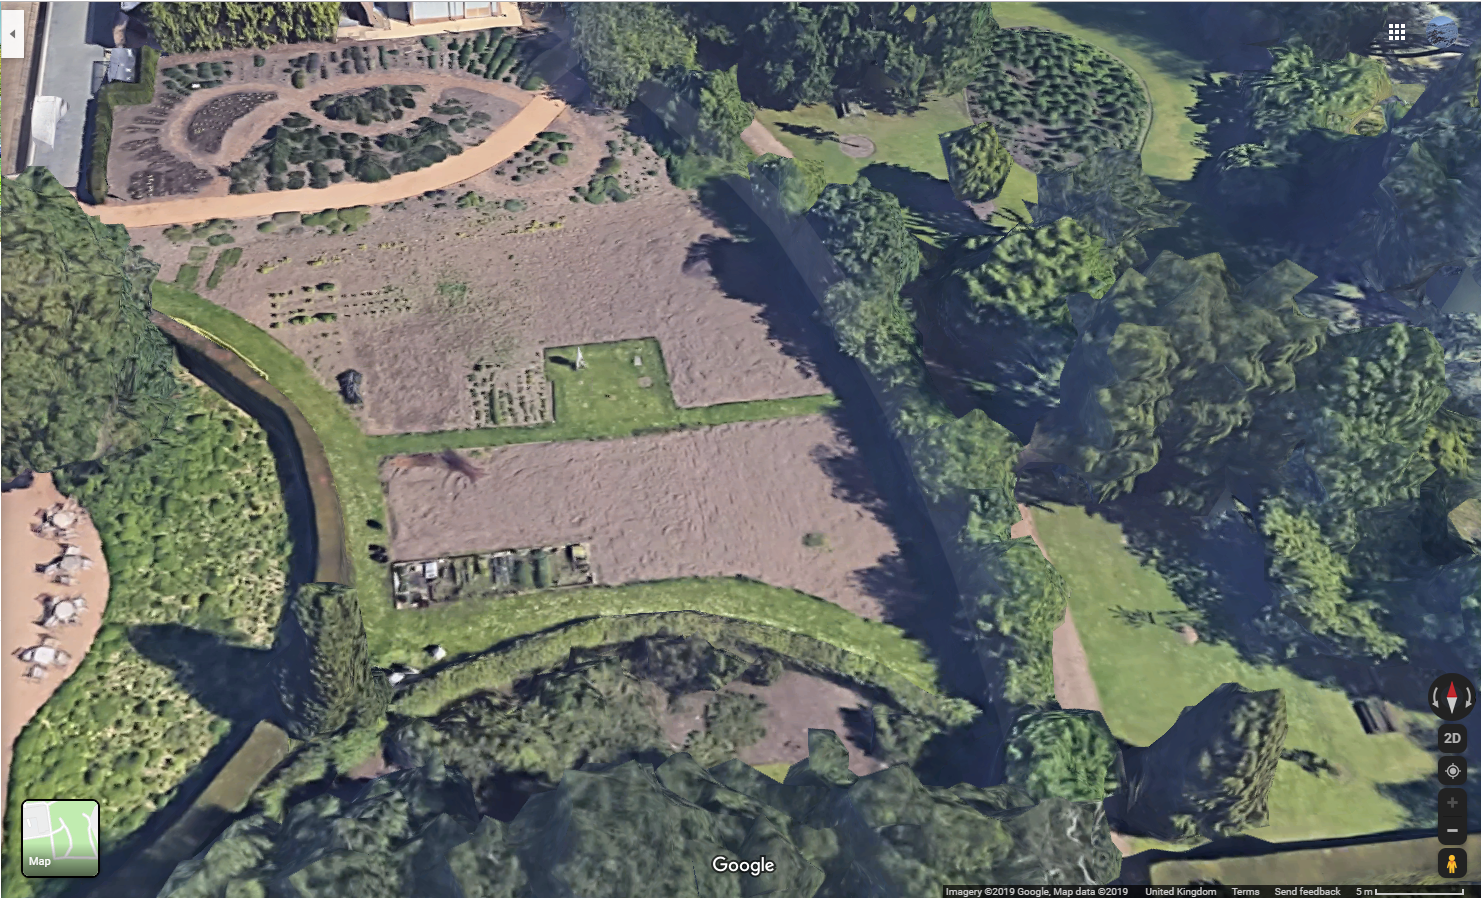
The weather enclosure in the Cambridge Botanic Gardens meets WMO guidelines
Although it has been mentioned that the Cambridge site appears to be overdeveloped it meets the WMO standard and the Met Office are happy with the record.
Compared with 2003 the heat this time was far more widespread and further north, with many stations recording higher values than 2003, as shown by these 24 hours to 6pm readings below.
In 2003 some 44 stations recorded 30C or above whereas this year some 67 reached 30C or higher.
Though the heat was record breaking it was much shorter lived than 2003. Like last month and July 2015 the 9-day temperature trace is far more ‘pointed’ – perhaps a symptom of the changing behaviour of the jet stream.
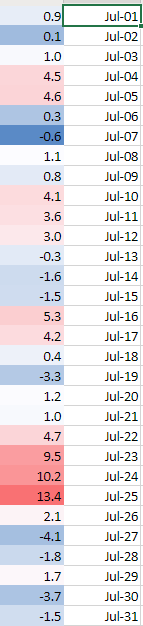
Overall the monthly mean finished 19.9C, that’s 1.4C above average though 1.8C cooler than last July – the warmest month on record.
Rainfall at 61.5mm, was 141 per cent of average, the wettest for 2 years. Sunshine, at 165hrs, is 85 per cent of average and well down on last July’s 273hrs.


You must be logged in to post a comment.