June 2014 continued this year’s theme of being milder than normal; the mean temperature of 17.1C was 1C above average, making it the 22nd warmest June since 1797.
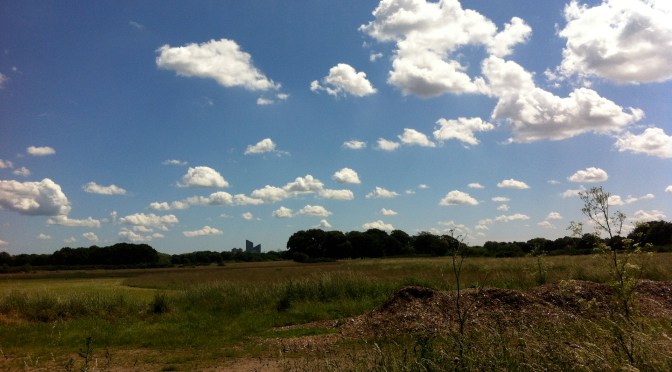
June was marked by some spectacular cloudscapes and sunsets. This was the view across Wanstead Flats from Centre Road looking toward Ilford on the 21st
June, like March and April, was dryer than average with just 15.2mm of rain, that’s just under 30 per cent of average.
The driest June since 2000 started off unsettled with frequent rain – 6mm falling on the 3rd. The following day was cool with the temperature reaching just 16.2C.
Though there were nine days when over 10 hours of sunshine was recorded the magic 80F was surpassed just once: on the 9th when 27.5C was reached under 6 hours of sunshine. This sunniest day was the 10th when 14 hours of sunshine nudged the thermometer to 24.5C. Overall there were 214.1 hours of sunshine – that’s 120% of average, the sunniest since 2011.
On many days during June, including the 30th shown here, the sky turned dark but just spits and spots of rain were often produced
Despite plenty of potential no incidents of thunder were recorded – the much-hyped weekend of the 7th / 8th saw less than 2mm of rain – all of the action staying well to our east in the France, Germany and the Low Countries. Further thundery potential on the 13th failed to produce anything in this area though a disturbance over Berkshire saw thunderstorms develop in the Oxford, Reading, Basingstoke and Wokingham region, with up to 38mm of rain falling over a wide area.
It is a typical feature of summer that rainfall can vary a great deal across a small area. The nearest official station to Wanstead, St James’s Park 8.4 miles to our south-west, recorded 33.8mm – more than double what fell here.
Some nights were chilly when the sky cleared but there was no air frost or ground frost.
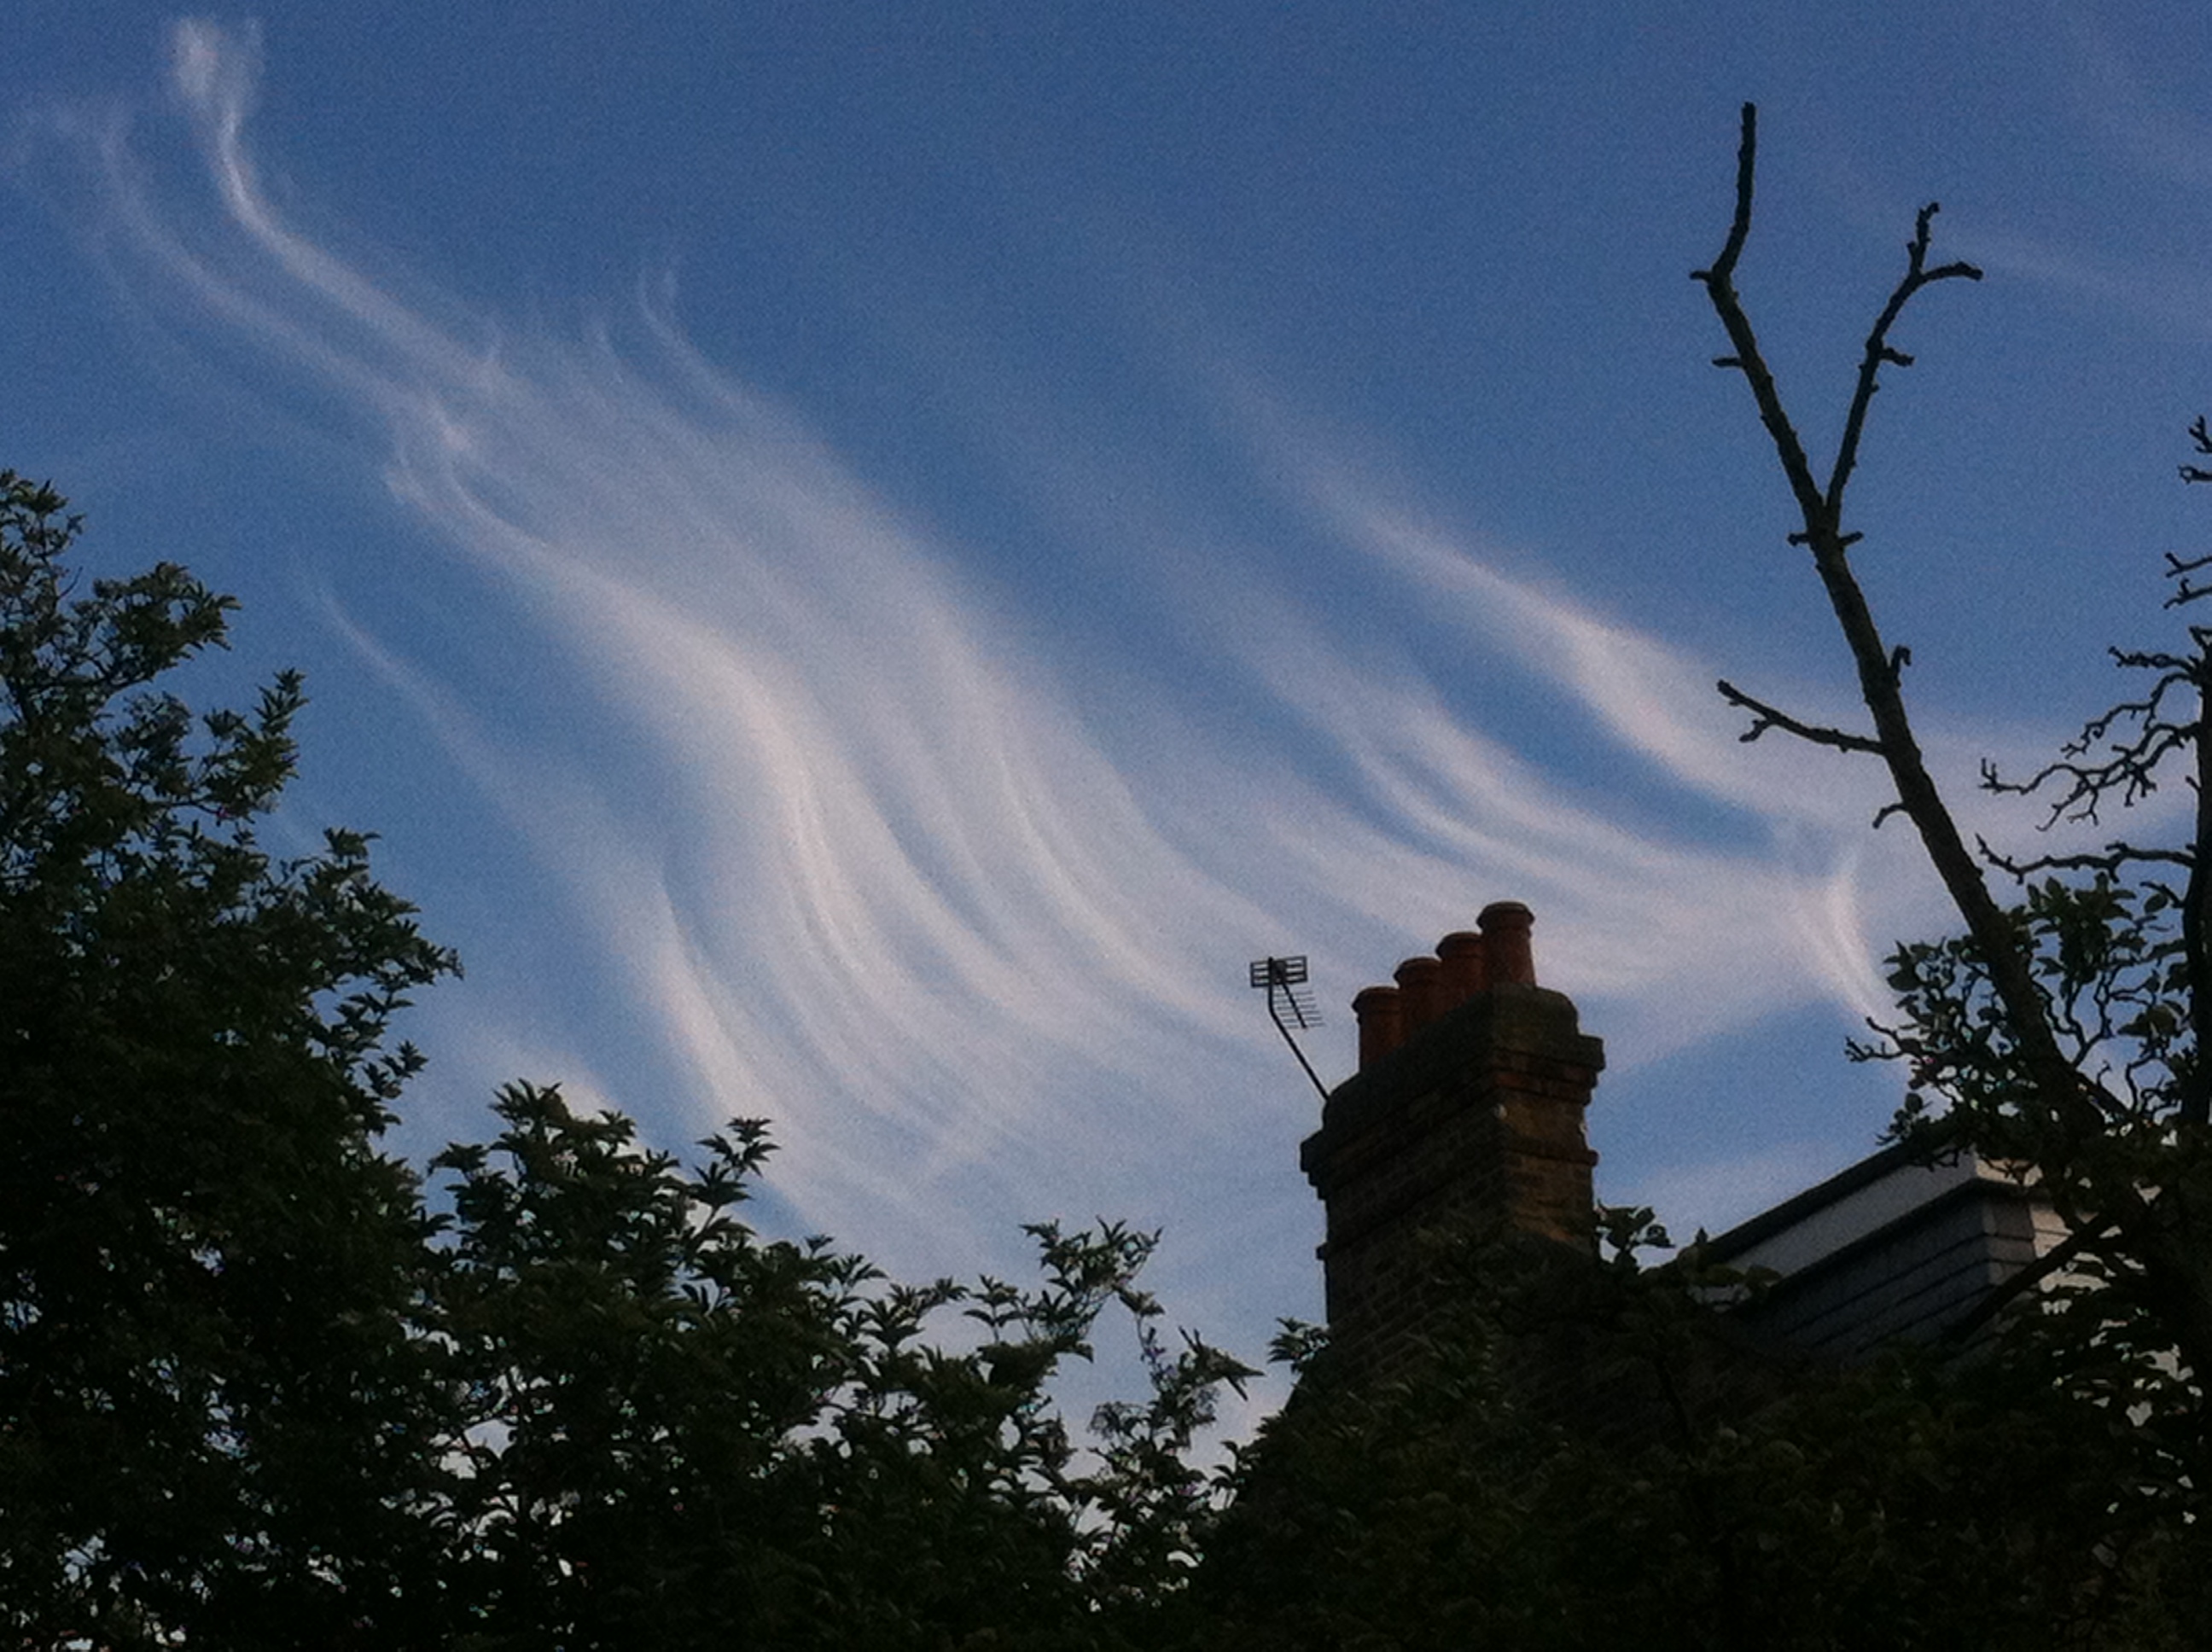
Yet another occasion of impressive cloud formation during June included this example of late evening cirrus. The formation, seen at ground level, seemed similar to a display of the AuroraCircumhorizontal arc over Aldersbrook
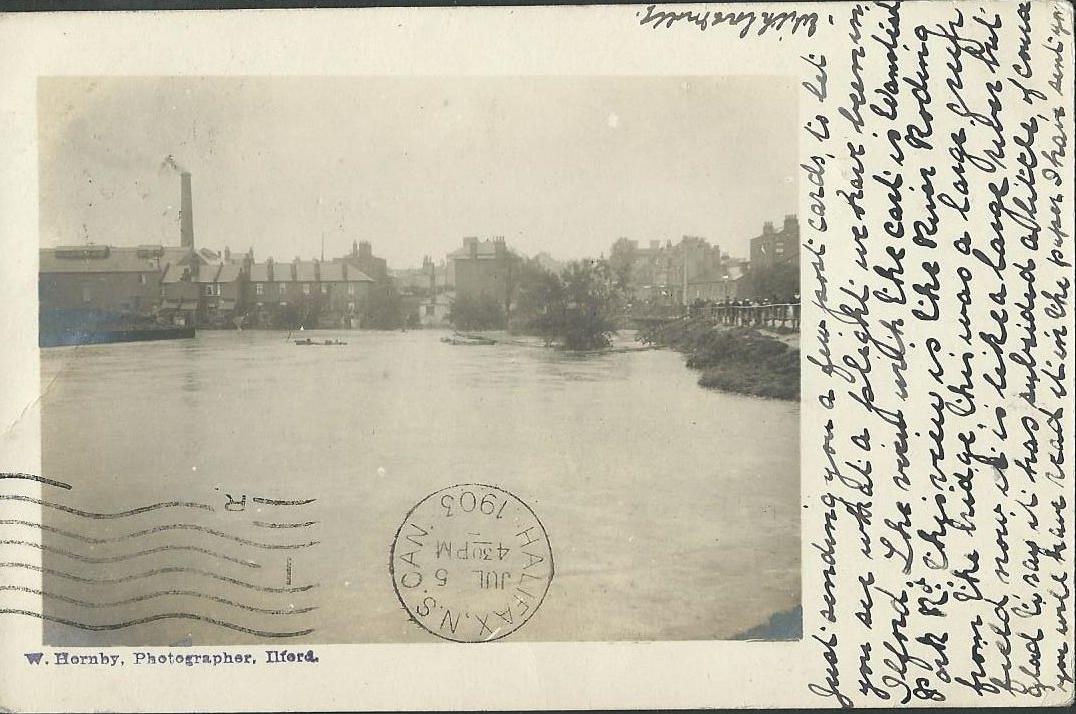
It was the summer when the ‘sea’ came to Redbridge. A record-breaking 59-hour deluge in the middle of June 1903 left vast swaths of the borough inundated. But this was no thundery downpour. All across London and the South East record rainfall rates and totals were set, many of which still stand well over a century later.
The author of this postcard wrote the following: “Just sending you a few postcards to let you see what a plight we have been in Ilford. This view is the River Roding from the bridge. This was a large green field now it is like a large river but glad to say it has subsided a little of course. You will have read it in the papers I have sent you.”Images of the flooding were captured by Watson Hornby, an amateur photographer and artist, who traded at 7 Cranbrook Road, Ilford. This terrace of houses in Wanstead Park Road, which backs on to the River Roding, were also flooded out. The postcard was written on July 1st, 1903
According to one local historian the fields between Wanstead Park and Ilford – as far as Uphall Road – were like an open sea and the railway track at Seven Kings resembled a shallow river.
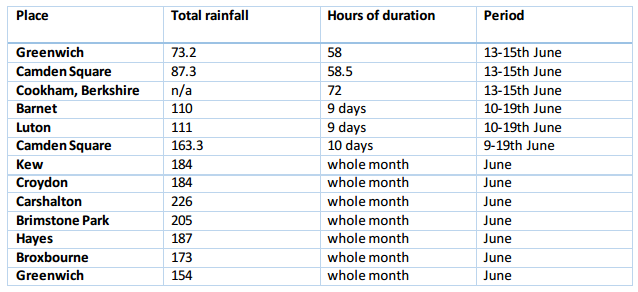
After a dry start to the month June quickly went downhill with notable falls of rain during the second week. The main deluge arrived around noon on Saturday, June 13, and lasted until near midnight on the 15th.
The rain was caused by a depression that moved slowly across southern England, becoming stationary over the English Channel close to the Isle of Wight for 24 hours before moving north-east. It introduced a very cool NE’ly airflow – the temperature on the 14th and 15th failed to climb above 11C and on the 19th a high of just 9.2C was recorded as yet more rain fell.
Across the London area there were five days within the period 10th to 19th June when over 25mm of rain was measured in many places. The deluge added to what became the wettest summer month on record. At the Royal Observatory, Greenwich, just over 154mm fell, three times the amount of what normally falls in June in this area. Further west, Kew Observatory recorded 184mm.
The June 1903 flood at Empress Avenue at the junction of Wanstead Park Road
The 1903 rains produced an unprecedented summer flood on the Thames. At Teddington 7335 million gallons (33,374 million litres) of water flowed over the weir on June 21st. Elsewhere the Lea Valley was one vast lake, especially around Enfield, with the Royal Gunpowder Factory inundated.
The Friday, June 19th edition of the Essex County Chronicle abounds with other tales of woe from the floods…
Barking and District: In the large area of low-lying ground between Lea Bridge, Ilford, Barking, and East Ham, houses stood in a great inland sea, which was washing over the garden fences and lapping at the lower windows. Upstairs the occupants could be seen moving about or gazing hopelessly out at the dreary waste of black waters. Boats from Barking Creek were rowing about with supplies of milk and bread, and those who wished were taken away. All along the Barking Road from East Ham scenes almost identical were witnessed, but, happily with the end of the rain, the water did not retain its level long. Past Barking and on to Rainham the roads on Tuesday were quite impassable, much of the heavy traffic which goes through Rainham towards Barking having to turn back.
The floodwaters between Wanstead Park and Ilford were described as a vast inland sea
Woodford and Wanstead: The inhabitants of Claybury Asylum and Woodford Bridge were cut off by 3ft of water from Woodford. The whole of the Roding Valley was in a deplorable state; sheds, trees and stock that was once alive floating in all directions. Wanstead was divided from Ilford by a great lake, but happily the total of loss in property was here very small.
Lea Bridge: The Leyton marshes were covered by one great sheet of water, Lea Bridge Road itself being quite 2ft under. Boats were to be seen plying among the tramcars.
Epping: The valleys were well-nigh impassable, especially at Thornwood and parts of Theydon Bois.
Romford: The floods reached to Romford High Street, and made the thoroughfare impassable for pedestrians. The crisis caused a heated exchange among members at a meeting of the Urban Council on Monday evening where it was agreed to allow the free use of the town fire engine for pumping water from ratepayers’ premises, provided that those who required its services paid for the labour. Cllr J. Bassett thought the residents should make their own arrangements for getting rid of the water. Cllr J.R Holliday replied: “You don’t live near the river. I should like to stick you in the middle of it. I think it is the duty of the council to protect property.”
Laindon: Here the height of the deluge was experienced between seven and eight o’clock on Sunday evening. The rain descended in apparent ropes of water, causing consternation, flooding houses, choking drains and water-troughing, cutting deep channels in roads, washing up plants and new potatoes. On Monday the water was between 3 and 4ft feet deep at Noak Hill and other bridges.
Woodford: An exciting scene took place at Woodford Bridge, where a steam circus, with its owners, was in the most precarious position. Men and women were submerged up to their armpits while extricating the caravans.
Away from the South East the weather was much dryer. Felixstowe and Yarmouth newspapers reported that Sunday had seen “delightfully sunny weather, with cool north-easterly breezes”. Lincoln, meanwhile, recorded less than an inch of rain for the whole month!
Could these rains happen again? Meteorologically, given the same synoptic set-up, it is possible. In terms of the June monthly total of rain we came close in 1997 when 133mm fell – though this was much more evenly spread throughout the month. And thanks to massive investment in local river systems since the 1950s the flooding nightmares brought by the Lea and Roding rivers should stay firmly in the past.
*You can see the full stats from Greenwich for June 1903 by clicking this link.
At the beginning of May I had a look at the March and April stats to try to decipher what the coming summer would be like. The results still suggest that summer will be a mixed bag weather-wise with only brief hot spells interspersed with humid thundery breakdowns and cool, cloudy and showery regimes.
The third warmest March-April period since 1799 possibly prompted some weather ‘experts’ to claim that we’re heading for a hot summer. But converse to what the Daily Express told us in April I cannot see any signs of a ‘hottest summer ever’. And it should be remembered that this rag also warned us that the past winter would see ‘100 days of snow’. In the event I think 100 days of rain was probably more true, and I would like to point out at this juncture that my own winter forecast was hopelessly out, along with many others.
To reach my conclusion on this summer I have used pattern matching of meteorological data for March, April and May stretching back to 1799. The mild and dry weather of March and April has been tempered by the wet May. The mean for the spring season was 11.7C with 116.4mm of rain and 473 hours of sunshine. If you take into account all years that were within +/- 10 per cent of these figures you get the following table.
When considering the data I first extracted the number of similar years by rainfall. Of these I then discounted any that were not within + / 10 per cent of the spring 2014 mean temperature.
The ‘best fit’ years were revealed as 1811, 1828, 1871, 1882, 1912, 1945, 1959 and 1989. Using sun hours similarities this could be narrowed further to 1912, 1945, 1959 and 1989, however it should be noted that I don’t have sun hours data prior to 1881!
Or, expressed in probabilities, I concluded the following:
Summer probabilities
So from the above you could deduce that the next three months will be average to rather cool, with average to slightly below average rainfall. Sunshine below average.
Trying to predict details over the next 3 months is impossible, but looking at the ‘best fit’ years mentioned above a warm spell happened without fail between the dates June 18th – June 22nd. Other dates to bear in mind for possible fine spells are July 5th, July 12th-15th, July 22nd, August 4th and August 20th.
* Taking into account the fact that temperatures in London are up to 1C warmer than they were 100 years ago I have added 1C to mean temperatures before 1915.
** Obviously, in the event of a series of direct hits from thunderstorms, my rainfall estimate could be hopelessly short – a symptom of abundant solar energy at this time of year which creates a ‘noisy’ atmosphere compared with winter.
*** The 1981-2010 average mean for summer in this region is 17.6C, with 144.9mm of rain and 564 hours of sunshine
…then we’ll only see a splash. If the ash before the oak then we’re sure to get a soak.
If this old weather saying carries any weight then this summer should be a corker…
This young ash on the corner of Montalt Road and Chingford Lane, Woodford Green, is much later into leaf than the adjacent oak
Only I wonder how many of the ash trees I noticed on my ride back from Enfield this afternoon are struggling to survive let alone burst into leaf. The initial onset of chalara fraxinea (ash dieback) over the past couple of years now seems to be taking its toll in a much bigger way on ash specimens around the countryside.
The tell tale dead branches are becoming a lot more common.
Some have blamed the spread of Chalara on cheap imports of ash trees from Holland – the first cases were confirmed in a nursery in Bucks early in 2012. Efforts were made to find and contain affected specimens but, throughout East Anglia and the South East, the disease seems out of control. It could be only a matter of time before the disease scars the landscape with dead trees in the same way that Dutch Elm Disease did in the 1970s.
From one poor management of trees to another – namely the ultra harsh pollarding of the London planes in Wanstead High Street. Whilst this style of management is nothing new and seems to be de rigeur among most London councils it does nothing for the scene of many roads and streets through the capital. What was once a rich canopy of green providing shady relief from the sun during high summer is just a few stumps. It takes a good few years for the canopies to regenerate – by which time it’s time for another visit from the tree surgeons…
Plane ugly: the harshly pollarded planes in Wanstead High Street
To blame, partly, is the spread of another tree pest – Massaria. This unseen pest ‘eats’ away the tops of branches – compromising the strength of the wood eventually to the point where, if unchecked, the whole limb comes crashing to the ground. London plane is very heavy wood – with branches weighing dozens of kilos there’s obviously safety issues with limbs dropping on peoples’ heads.
Though councils would argue otherwise I think the harsh pollarding is a cost saving measure – without this they would have the added cost of constant monitoring.
The fast-growing, non-native London plane was planted on the understanding that growth would be carefully managed and limited in height. But looking at some of the monster specimens around the capital that seems to have gone by the wayside a long time ago.
The City of London Corporation is well aware of the problem and is closely monitoring the capital’s stock.
If you have magnificent London plane near you make the most of it – the buzz of the tree surgeons’ chainsaws are getting closer.
The last time Liverpool won the league in 1990 (by league I mean top tier of English football) the South East enjoyed a mostly dry, warm and sunny summer. A particularly hot spell in August of that year saw the UK high temperature record broken when the mercury reached 37.1C at Cheltenham on August 3rd, a record that stood until 2003.
Since the middle of December last year the weather has been remarkably similar to that football season when the Reds won their 18th league title. Both winters were remarkably mild and stormy with January 1990 seeing the Burns’ Day storm.
The mean temperature this year over the same period, December 13th to April 26th, is just 0.2C cooler than 1989-90, while rainfall is 2.1% greater and sunshine is 2.5% less. A remarkable singularity.
Will history repeat itself come the end of the season and the end of the summer? Up until early Sunday afternoon the stage seemed set. But a slip by Liverpool skipper Steven Gerrard at the end of the first half gifted Demba Ba with a chance that opened the way for Chelsea to complete the double over their title rivals.
The Liverpool squad of the 1989-1990 season won the club’s 18th league title
It must have been agonising for the Kop to watch, 24 years on from the exact same weekend the Reds lifted the title with two games left. The weather that followed that memorable day was dry, sunny and warm with temperatures reaching the mid 20s on many days.
Fast forward two dozen years and the weather looks decidedly unsettled, with frequent showers or longer spells of rain interspersed with sunshine. Though there’s doubtless many twists and turns left I wonder if Reds fans believe their title hopes are going the same way as the change in the weather?
Football’s a funny old game – just like the weather.
March 2014 will be most remembered for glorious sunny days that brought welcome relief after a run of seemingly endless wet months.
Many trees blossomed early this year, thanks to the mild winter
It also continued the mild theme of the winter; the mean temperature of 9.1C was 1.4C above average, making it the 11th warmest March since 1797. Looking at my other series back to 1881 the March mean maximum was second only to March 1938!
Just 25.8mm of rain fell over the 31 days – that’s 63 per cent of average.
The month started on the chilly side but with plenty of sun around it felt pleasant. Though many days were warm clear skies led to frost and fog forming. Hail was observed on three days.
The most notable weather occured on the 26th when the temperature fell from 10C at 1.30pm to 4C by 3pm. Heavy showers accompanied what was an utterly foul day. The cold pool persisted into the 27th with towering thunder clouds surrounding Wanstead, north, east and south – with reports of hail in Berkshire and snow in Folkestone.
The month ended with warm, sunny weather – the southerly flow bringing Saharan dust that deposited on cars. There were 4 air frosts and 14 ground frosts.
A southerly airstream brought dust that originated from the Sahara Desert
‘Worst-ever!’, ‘in living memory’, ‘highest on record!’, ‘unprecedented!’. These phrases, used often by newsreaders on the main networks including Sky and BBC, always set an alarm bell ringing in my head. None more so than weather stories which, with the stormy winter we’ve just had, has been happening almost daily since the middle of December.
As the winter has progressed the networks have tried to out do one another with the severity-value of a story. What starts with a reporter gingerly standing by the side of a flooded field within days changes to the reporter, donning a pair of fisherman’s waders, trawling waist-deep through a flooded Berkshire housing estate.
The media also seem to delight in rushing out Met Office data to proclaim these armageddon scenarios before the season is over and the statistics can be properly studied, absorbed and commented upon.
Last summer, I started to build a dataset for my own area – Wanstead. Using local figures from the City of London Cemetery I was able to take the daily series back to 1959. Beyond this I then sourced monthly data for Greenwich, 6 miles away, back to 1881. Using W.A.L Marshall’s A Century of London Weather and Luke Howard’s The Climate of London enabled me to take the series right back to 1797.
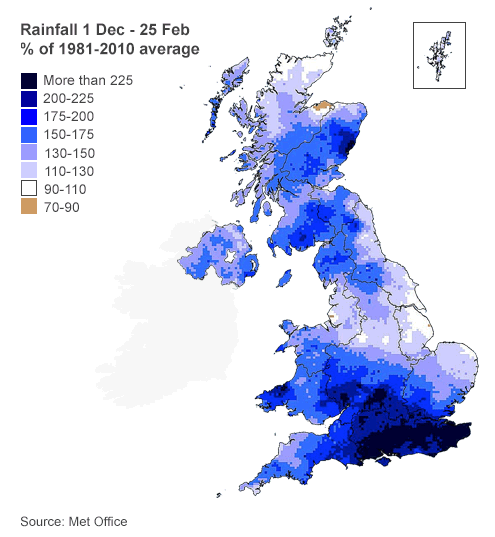
The series makes for interesting reading, putting this winter as 6th wettest since 1797. Scientists would say that because my series is only one dataset it cannot be regarded as a ‘catch-all’ for the country overall. But when statements like “England and Wales has had its heaviest rainfall since 1766” are put out by the media it is blatantly not true for the entire country. Just a quick look at the map shows that while parts of south and southeast England have been very wet – other parts of the country have been much less so.
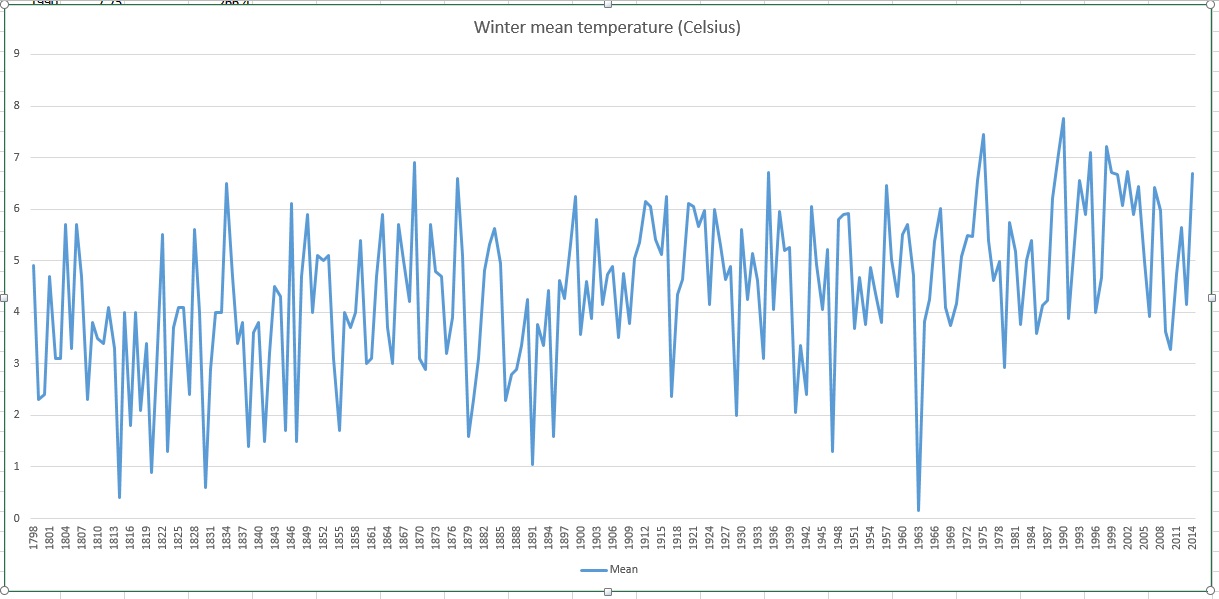
But in this age of 24-hour rolling news the message to anyone who takes the headlines at face value is that this has been the wettest winter ever. You can view the winter mean temperature and rainfall stats here.
Floods in Somerset have, up to now, seemed far removed from our own back yard. But with thousands of homes by the upper parts of the River Thames now at risk of flooding I wondered how safe we were from our own rivers.
A look back through the reference books show the geography of the Roding and Lea Valleys has made the area prone to inundations for hundreds of years.
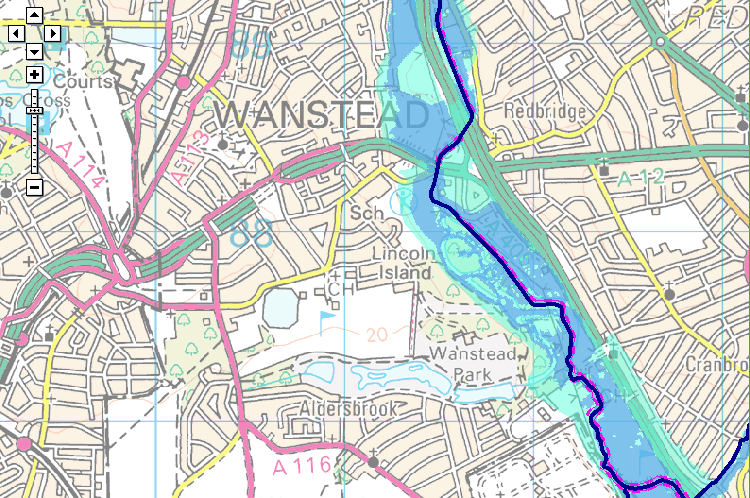
The Environment Agency’s Flood Map for Planning shows the flood zone risk of the area. And endorses Howard’s account that the river Lea was ‘a mile wide’ at its peak
In January 1809 the lower River Lea burst its banks in several places following a deluge that dumped two inches of rain in the space of 24 hours. The rain abruptly ended a snowy cold spell that had begun over a month before in the middle of December. From Luke Howard’s readings it is likely that up to half a metre of snow had fallen in the previous weeks in the upper parts of the surrounding countryside with only slight thawing. With the frozen ground unable to absorb any of the rapidly melting snow and rainfall the amount of water flowing downstream must have been immense. Howard takes up the story…
“The River Lea continued rising the whole of the 26th… The various channels by which it intersects this part of the country were united in one current above a mile in width which flowed with great impetuosity and did much damage.”
Howard, his chemical factory located on the banks of the river Lea close to what is now Bow flyover, wrote at length about the event, his account replacing the usual brief notes about daily weather in his book The Climate of London.
He talks of embanked pasture land being “filled to the depth of eight or nine feet” and people driven to their upper rooms relieved by boats plying under the windows.
The Environment Agency’s Flood Plan map of the Thames illustrates Howard’s comment that “the Thames was so full during this time that no tide was perceptible”
“The Thames was so full during this time that no tide was perceptible.” It took until February 23rd for things to return to normal.
Miraculously no lives were lost in the flood and cattle “by great exertions” were saved by being kept in their stalls. Howard, saying that the flood could have been far worse, believed a neap tide, strong westerly winds urging water down the Thames and mild weather helped avert a tragedy.
Howard’s statistics of the previous months show that the second half of 1808 were wetter than average – though not especially so. And nothing like the rainfall we have had this winter. From December 1st until February 8th Howard recorded 130mm of rain, which is about 100mm less than what I have recorded this winter.
This fact alone shows just how much the nature of the river has changed in the last 200-odd years thanks to spending on flood defences.
Work to improve the defences was prompted 67 years ago when similar catastrophic flooding came with the thaw that ended the severe winter of 1947, one of the coldest winters in recorded history and an episode remarkably similar to what Howard recorded in 1809.
Flood risk areas around the River Roding close to Wanstead are much smaller than the equivalent area in Lea Valley
The Lea Valley, along with many parts of the country, saw some of its worst flooding in a generation. The river burst its banks at several points bringing misery to surrounding communities. Valleys turned into lakes in 40 counties and East Anglia’s fens were a sandbagged inland sea. More than 100,000 properties were damaged and, then as now, heroic battles were fought by the military to keep water-pumping plants and power stations dry.
The sense of crisis was felt worldwide. Canada sent food parcels to stricken villages in Suffolk; the prime minister of Ontario even offered to help dish them out.
A marker of that flood, together with a history of flood defences, can be found here. There is also British Pathe footage of another flood between 1910 and 1919 here .
The River Lea Flood Relief Channel, that flows between Ware, Herts, and Stratford, took almost three decades to complete. The channel incorporates existing watercourses, lakes and new channels. Since it was completed in 1976, there have been no major flood events in the Lea Valley, although there have been three occasions when the river system was full virtually to its capacity: in 1987, 1993 and 2000. Since its completion, the level of protection afforded by the structure has declined, so that in some areas it offers 2 per cent protection, and in some, only 5 per cent protection. The Environment Agency published a strategic environmental assessment in 2008, which looked at ways to maintain the flood defences in the Lea Valley.
The water table appears to have come to the surface on Wanstead Flats
It remains to be seen whether we will see any flooding in Redbridge – a further 40mm of rain is forecast to fall up to Saturday morning. As well as the problem of rain there is also the issue of the water table which in the past week has risen to the surface in places. Inland lakes forming on Wanstead Flats have seen the cancellation of football fixtures and a couple of people I’ve spoken to say standing water has started to appear in their cellars
It is all too easy to blame the Environment Agency for the current flooding in Somerset and elsewhere but the meticulous planning by its forerunners brought, at least to date, an end to the widespread flooding problem in the Lea Valley.
As the government struggles to find a solution to the current problems with flooding it would do well to look to the grand schemes of the past and forget about any planned cuts to flood defences.
With flooding in the Somerset Levels dominating the headlines it is easy to get carried away with media hysteria that we are in unprecedented times in terms of rainfall. But as with so many media stories these days you don’t have to look far back in meteorological records to find that we’ve been here before.
The jetstream has been virtually ever present over the UK this winter, driving depression after depression over our isles
Although I base this blog on local figures – two series of stats going back to 1881 and 1959 – it is notable that this particular microclimate has actually been dryer than neighbouring areas, including east Essex where the rain crossing this area often peters out. With such power in the jet stream, however, bands of rain have been pushing right through this winter. Surrey has also been notably wetter, with orographic uplift only partly responsible for the increased wetness. Anyone driving around the M25 will have noticed the flooded fields at the side of the motorway.
It has been mentioned that this winter has been the most cyclonic in recent memory, but you only have to go back to the winter of 2000-01 to find a more cyclonic winter, though that season saw fewer severe gales.
Since the beginning of the meteorological winter on December 1st Wanstead has recorded 235.6mm of rain to February 6th. Considering the 1959 series that’s 7% wetter than the winter of 1989/90 – though this winter is actually 0.9C colder than that season 24 years ago.
Looking at the bigger picture, and with 22 days to go, this winter is currently 7th wettest in the series going back to 1881 – quite a way behind 1915 which saw 343.7mm recorded. Looking at the GFS model out to 9 days, however, there is much more rain to come.
The season so far, in terms of temperature and rainfall, has been notable in that autumn did not really offer any hints as to how winter would unfold. At the beginning of December I would have put the probability of a winter such as we have had so far at 10%. Should the rain continue to fall while the temperature stays mild the probability would fall to 1% – a truly exceptional winter in the same league as 1962/63 – but at the other end of the scale.
After my less than impressive stab at a winter forecast I am a bit loathe to make any more predictions. Trying to predict the weather more than a few days ahead with any detail is impossible. And seasonal forecasting is fraught with difficulty. However, precedent suggests we could be in for a warm and settled March. Indeed, if this year is anything like what followed in 1990 we could be in for a very nice summer. But then again we might not. As Mark Twain said: ‘Climate is what we expect; weather is what we get’.
The last time January was so wet Eddie ‘The Eagle’ Edwards was about to fly the flag for Great Britain in the ski jump at the Winter Olympics in Calgary, Canada, in 1988.
There was occasional respite from the persistent rain
Some 130.6mm of rain (251% of average) fell in January, beating the previous record set in 1988 by just 2.8mm around midnight on Saturday 1st. Unlike 1988, last month followed a December that was 154% wetter than average. The wet spell, which started on December 13th, is only now making a real impact on the river Roding which is now running very high.
January was also warmer than average with a mean temperature of 6.4C (1.5C above the 30-year average) – ranking it 20th in the series since 1881 – and the warmest January since 2008. Though the month was very mild no single day was particularly mild. Highest maximum was 12.7C on the 7th.
The most notable day was probably Saturday 25th when what started as a bright, fine day quickly changed around 4pm as a strong squall with heavy rain blew through with associated thunder and lightning and 6C fall in temperature in an hour. Wanstead escaped the damage of elsewhere. Numerous trees blocked rail lines in Kent and gusts of over 60mph were widely reported.
There were two other incidents of thunder and lightning on 5th and 6th – very unusual in the middle of winter and an average normally observed in high summer.
Air frosts: 5 : coldest night of winter so far was observed on morning of 12th with -2.9C
















You must be logged in to post a comment.