Tag Archives: Stratford

1816: the year without a summer in London

Tornadoes, earthquakes, heavy rainfall, abnormally low temperatures, pea-souper fogs and exploding meteors are phenomena that marked the Year Without a Summer around the world 200 years ago. But how did London fair?

1816 & 2015 monthly anomalies
The monthly anomalies of the two years closely follow the same pattern between March and August

When extreme weather affects Britain, such as the floods plaguing northern England and Scotland, conditions in the capital are benign by comparison.

There is not a great deal written in the press about the weather in London in 1816. So, as ever, Luke Howard’s The Climate of London, is a primary reference point.

After a wild end to 1815 that was marked with snow and lightning 1816 started dry, cold and frosty. Though cold by today’s standards January 1816 was fairly average and much warmer than the previous two when the last Thames frost fair was held.

annual
The highs and lows of 1816 and 2015 compared

Though the temperature reached 10C on 10th the rest of the month was marked with maxima around 6C and the odd frosty night.

Cold weather returned at the end of the month, turning severe in the second week of February. In the early hours of the 7th heavy snow, driven by gale-force north-easterly winds, brought possibly some of the worst winter weather this area has ever seen. Some 35mm of precipitation is recorded on the 8th – this would normally give at least one foot of level snow that could obviously be whipped up into huge drifts.

Luke Howard described the scene in his diary entry saying the abundance of snow “loaded the trees to their tops and weighed down the smaller shrubs to the ground.”

The snow and polar continental air also produced perfect conditions for a textbook radiative cooling night. The minimum recorded on the 10th: -20.6C has not, as far as I can tell, been repeated since.

To put that into perspective the lowest minimum of the severe winter of 1963 for this area was -12.2C recorded at Greenwich on January 21st. The coldest night I have personally recorded was -10.3C on January 12th 1987.

As often happens with severe cold snaps Howard reported on the 17th the the snow “was mostly gone but very thick ice remains on ponds”; a period of just under a week.

The cold snap saw the mean temperature for February over three degrees colder than average at 0.8C.

As well as keeping meticulous observations in Plaistow, Stratford and Tottenham, Howard always kept an eye on what was going on abroad and noted that earthquake activity was high.

On February 2nd an earthquake that ‘lasted nearly three minutes’ was felt at Lisbon. Three days later an earthquake was felt on Madeira.

“At midnight a severe shock of an earthquake was felt all over the island and the following morning at 4 o’clock another shock was felt.”

An extract of a letter from Captain Welsh of the Claudine described an event of an earthquake felt at sea on the 9th.

On the 9th of February off St Michael’s we experienced very tempestuous weather with a tremendous confused sea. The wind shifting from SW to SE and NE with constant lightning and heavy rain. On the 10th at 8.30pm, the ship then under reefed fore sail and mainstay sail, we were much alarmed by a severe shock of an earthquake which lasted four or five seconds.

east london wind data
The dominant wind direction in 1816 was north-west

Later in the month on 23rd it was reported that the snow in the Grampian hills was at its greatest depth for 20 years.

Howard reported a heavy short snowstorm in the capital on March 4th. He also mentions another earthquake on March 17th that affected the north of England in towns and cities including Doncaster, Bawtry, Blyth, Carlton, Worksop, Sheffield, Chesterfield, Mansfield, Nottingham, Lincoln and Gainsborough.

“A smart shock of an earthquake was perceptibly felt in Lincoln at about 12.50pm. The undulation appeared to be from west to east and lasted from about a minute and a half to two minutes.

“Pictures and other articles hanging on the walls were set in a swinging motion. At Newark also and the neighbouring villages the shock was distinctly felt as well as at Leicester and Loughborough.”

Snowy episodes in the capital lasted well into April. On 12th snow fell for two hours “turning the high ground of Hampstead in the distance white”.

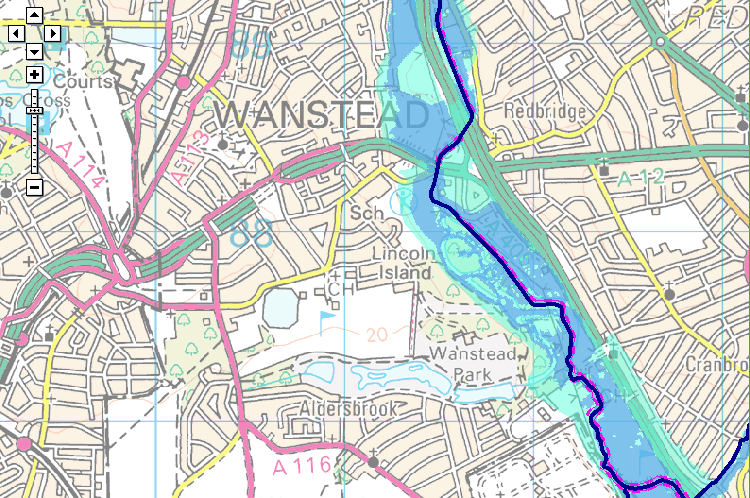
Very high tides were reported on the 15th with “much water out in the marshes”. By the 19th it was noted that the growing season was being severely hampered by the cold weather

April 1816 was nearly 1.5C below average. Despite this, by the 21st, the first swallows began to appear.

May and June were again cold. More than twice the average rainfall in June suggests the weather in the sixth month was very disturbed.

On the 25th a tornado, strong enough to carry objects weighing 60lbs, was reported in the Edgware Road area.

At two o’clock being a still sultry day a whirlwind passed over the nursery ground of Mr Henderson in the Edgware Road which lifted seven lights from the greenhouses and carried them to the height of the highest elm trees, each of the lights weighs 50 or 60lbs at least. At the same time two garden mats were carried to an immense height so that the eye could not distinguish them.

The following day “extremely heavy and prolonged rain from 9am (26th) to 9am on 27th gave 2.95 inches”. This total of over 52mm is notably high though not a record.

Overseas, meanwhile, the weather continued to confound observers. Several inches of snow fell in Quebec on June 8th while a letter from a friend of Howard mentioned a reading of -38F that had been recorded in New Hampshire earlier in the season.

July and August were similarly cold and wet. While events in London had quietened down Howard noted that the Kendal Chronicle was reporting snow on the summit of Helvellyn on July 4th while notable gales in Scotland were affecting ships.

More earthquakes shook locations around the world including one on August 14th in Scotland that caused panic and considerable damage in Inverness. Howard quotes a letter from north of the border:

“Last night, exactly a quarter before 11 o’clock the town of Inverness and the surrounding country was fearfully shook by an earthquake. We fled to the street where we found almost every inhabitant; women and children screaming and a very considerable portion of them naked. Many fled to the fields and there remained for the greater part of the night. Chimney tops were thrown down or damaged in every quarter of the town. The Mason Lodge occupied as an hotel was rent from top to bottom, the north sulk of the chimney partly thrown down one of the coping stones weighing, I should think, from 50lb to 60lb, was thrown to the other side of the street a distance not less than 60 feet.”

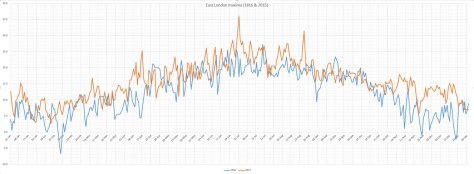
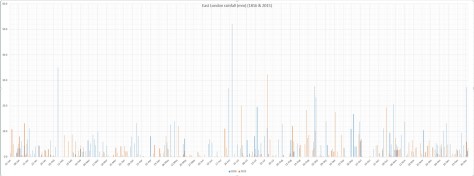
Though it is known as the Year without a Summer 1816 was actually only the 8th coolest summer in the local series going back to 1797. There were also 21 wetter summers – the 250mm that fell was actually less than half the rainfall of summer 1960.

1816 & 2015 monthly rainfall anomalies
1816 & 2015 compared: monthly rainfall anomalies

A change of month in September failed to bring a change in the weather and the mean temperature continued 2C below the average for the period. Howard mentions a 9-week tour of Europe at this time – his laboratory and climate reading duties left in the hands of his friend and partner, John Gibson.

Howard’s account of his tour explains how excessive summer rains had made life difficult from Amsterdam to Geneva.

“From the sources of the Rhine among the Alps to its embouchure in the German ocean and through a space twice or thrice as broad from east to west the whole season presented a series of storms and inundations. Not meadows and villages alone but portions of cities and large towns lay long underwater; dikes were broken, bridges blown up, the crops spoiled or carried off by torrents and the vintage ruined by the want of sun to bring out and ripen the fruit.

“While the middle of Europe was thus suffering from wet, the north for a time and to a certain extent was parched with drought and public prayers appear to have been ordered about the same time at Riga for rain and at Paris for sunshine.”

On September 16th Howard noted that a ‘dreadful’ hurricane had affected the Caribbean island of Guadalope. “Houses were levelled, plantations destroyed and the soil driven about like dust in a whirlwind.”

October 1816 was a blip during 1816 in that the mean temperature and rainfall were about average though Howard’s records reveal there were four air frosts.

By November the weather began mild but by the 6th the cold had returned with a brief snowy snap. A report from Chester said that day was almost night because of the thickness of the cloud:

“Candles or lamps were obliged to be lighted in all the houses this was succeeded by a slight shower. On Thursday successive falls of hail and rain took place. On Friday the frost was uncommonly severe and on Sunday the snow which fell was above 2ft deep in the streets.”

On the 14th reports came from France that a tempest on the night of the 11th and 12th had wrecked many ships: “winds blowing from the north then SSE”.

Chesterton House Balaam Street Plaistow C London Borough of Newham
Chesterton House, off Balaam Street, Plaistow, was the home of Luke Howard from 1806-13. The building has since been demolished

A solar eclipse on the 18th was followed by a sustained build in pressure from the 22nd with fog now becoming a problem in the capital.

The Evening Mail on November 27th reported that the problem was particularly acute in South London.

“The atmosphere was so darkened yesterday morning in the vicinity of the metropolis by the thick fog combined with smoke that in some parts it appeared like a cloudy night. In the neighbourhood of Walworth and Camberwell it was so completely dark that some of the coachmen driving stages were obliged to get down and lead their horses with a lantern.”

After the average October November had reverted to type and the month in London finished just over 3C cooler than average.

Pressure began to fall with the arrival of December. On the 12th reports of a meteor were made from Glasgow and Perth. The phenomena sounded spectacular:

“The meteor made its appearance in the SW in the form of a small star and gradually increased in magnitude till it reached the zenith when it subtended an angle nearly equal to that of the full moon. In shape it resembled a paper kite. After passing the zenith it again seemed to diminish in size owing no doubt to its gradually receding from the observer till its altitude was equal to about 30 miles when it exploded like a sky rocket. The report of the explosion, which is described as more tremendous than the noise of the loudest thunder, reached the ear about three minutes after the meteor vanished so that it could not be less than 40 miles distant and probably about 27 miles above the surface of the earth. From the various particulars collected its diameter must have been about 240 yards. The light which it yielded was very considerable being sufficient to render the smallest objects visible.”

Two days later the air pressure fell to its lowest point that year: 966.1mb. In the early hours of the 15th Howard wrote of an earth tremor that lasted 15 seconds.

A brief cold snap arrived on the 19th with the temperature falling to -10C on 21st – by the 26th, however, the temperature reached 10C.

Though December was relatively milder than November the month still finished 1.5C below average with 1.5 times average rain.

annual

East London Maxima (1816 & 2015)
1816 & 2015 compared: East London maxima
minima
1816 & 2015 compared: East london minima
East London rainfall
Enter 1816 & 2015 compared: East London rainfall


Advertisement

When the River Lea was a mile wide

Floods in Somerset have, up to now, seemed far removed from our own back yard. But with thousands of homes by the upper parts of the River Thames now at risk of flooding I wondered how safe we were from our own rivers.

A look back through the reference books show the geography of the Roding and Lea Valleys has made the area prone to inundations for hundreds of years.

The Environment Agency's Flood Map for Planning shows the flood zone risk of the area. And endorses Howard's account that the river Lea was 'a mile wide' at its peak
The Environment Agency’s Flood Map for Planning shows the flood zone risk of the area. And endorses Howard’s account that the river Lea was ‘a mile wide’ at its peak

In January 1809 the lower River Lea burst its banks in several places following a deluge that dumped two inches of rain in the space of 24 hours. The rain abruptly ended a snowy cold spell that had begun over a month before in the middle of December. From Luke Howard’s readings it is likely that up to half a metre of snow had fallen in the previous weeks in the upper parts of the surrounding countryside with only slight thawing. With the frozen ground unable to absorb any of the rapidly melting snow and rainfall the amount of water flowing downstream must have been immense. Howard takes up the story…

“The River Lea continued rising the whole of the 26th… The various channels by which it intersects this part of the country were united in one current above a mile in width which flowed with great impetuosity and did much damage.”

Howard, his chemical factory located on the banks of the river Lea close to what is now Bow flyover, wrote at length about the event, his account replacing the usual brief notes about daily weather in his book The Climate of London.

He talks of embanked pasture land being “filled to the depth of eight or nine feet” and people driven to their upper rooms relieved by boats plying under the windows.

The Environment Agency's Flood Plan map of the Thames illustrates Howard's comment that "the Thames was so full during this time that no tide was perceptible"
The Environment Agency’s Flood Plan map of the Thames illustrates Howard’s comment that “the Thames was so full during this time that no tide was perceptible”

“The Thames was so full during this time that no tide was perceptible.” It took until February 23rd for things to return to normal.

Miraculously no lives were lost in the flood and cattle “by great exertions” were saved by being kept in their stalls. Howard, saying that the flood could have been far worse, believed a neap tide, strong westerly winds urging water down the Thames and mild weather helped avert a tragedy.

Howard’s statistics of the previous months show that the second half of 1808 were wetter than average – though not especially so. And nothing like the rainfall we have had this winter. From December 1st until February 8th Howard recorded 130mm of rain, which is about 100mm less than what I have recorded this winter.

This fact alone shows just how much the nature of the river has changed in the last 200-odd years thanks to spending on flood defences.

Work to improve the defences was prompted 67 years ago when similar catastrophic flooding came with the thaw that ended the severe winter of 1947, one of the coldest winters in recorded history and an episode remarkably similar to what Howard recorded in 1809.

Wanstead
Flood risk areas around the River Roding close to Wanstead are much smaller than the equivalent area in Lea Valley

The Lea Valley, along with many parts of the country, saw some of its worst flooding in a generation. The river burst its banks at several points bringing misery to surrounding communities. Valleys turned into lakes in 40 counties and East Anglia’s fens were a sandbagged inland sea. More than 100,000 properties were damaged and, then as now, heroic battles were fought by the military to keep water-pumping plants and power stations dry.

The sense of crisis was felt worldwide. Canada sent food parcels to stricken villages in Suffolk; the prime minister of Ontario even offered to help dish them out.

A marker of that flood, together with a history of flood defences, can be found here. There is also British Pathe footage of another flood between 1910 and 1919 here .

The River Lea Flood Relief Channel, that flows between Ware, Herts, and Stratford, took almost three decades to complete. The channel incorporates existing watercourses, lakes and new channels. Since it was completed in 1976, there have been no major flood events in the Lea Valley, although there have been three occasions when the river system was full virtually to its capacity: in 1987, 1993 and 2000. Since its completion, the level of protection afforded by the structure has declined, so that in some areas it offers 2 per cent protection, and in some, only 5 per cent protection. The Environment Agency published a strategic environmental assessment in 2008, which looked at ways to maintain the flood defences in the Lea Valley.

Wanstead Flats by Scott Whitehead
The water table appears to have come to the surface on Wanstead Flats

It remains to be seen whether we will see any flooding in Redbridge – a further 40mm of rain is forecast to fall up to Saturday morning. As well as the problem of rain there is also the issue of the water table which in the past week has risen to the surface in places. Inland lakes forming on Wanstead Flats have seen the cancellation of  football fixtures and a couple of people I’ve spoken to say standing water has started to appear in their cellars

It is all too easy to blame the Environment Agency for the current flooding in Somerset and elsewhere but the meticulous planning by its forerunners brought, at least to date, an end to the widespread flooding problem in the Lea Valley.

As the government struggles to find a solution to the current problems with flooding it would do well to look to the grand schemes of the past and forget about any planned cuts to flood defences.

Snow Survey of London (1946 – 2022)

Winter 2021/22, considering the DJF mean, sits 68th out of 76 winters back to 1946/47.

It is currently the 11th snowless winter in the series though this could change if there is lying snow at 9am in March or April.

Late season snow is rare in the capital but it can happen. Examples include April 1983 and April 2008. Indeed the meteorological winter of 1974/75 was a full degree warmer than this winter but features higher in this list because of a snow event in the March.

The only ‘top 10’ winter for snowfall of the past 30 years was 2009/10!

Snow is a very rare commodity in lowland Great Britain – even rarer in the Home Counties, and in our part of east London. Pulling back the curtains on a cold winter’s morning to be greeted by a fresh fall of deep, crisp and even snow is something most children experience and hold dear for life. The slush, ice and chaos that inevitably follows all too quickly is forgotten.

OLYMPUS DIGITAL CAMERAMy memories of winters in the 1970s and 1980s is that they were far snowier and colder than they are today. But were they *always* cold and snowy? I decided to have a look back through the archives to find out. My first stop was the Met Office’s now defunct Snow Survey of Great Britain. This excellent compilation of reports logged by observers nationwide was printed annually as part of British Rainfall. But through lack of interest and cuts printing ceased after the 1991-92 season. Data continued to be collected though the modern version of the survey uses satellite technology to estimate daily UK snow depths – the Met Office website says that this is far less subjective than an individual nipping out at 9am every morning to ‘stick in a ruler’ and, those within sight of high ground, to observe where the snow line is. This does a disservice to the hundreds of observers who down the years diligently logged all their information as objectively as possible. But on to the data…

Regional data was not included in the survey until the 1965-66 season. Though Wanstead isn’t listed I have taken an estimate from data supplied from stations at Eastcote (53m), East Barnet (70m), Charlton Park (46m), Twickenham (13m), Teddington (9m). Because this area is influenced by Thames streamer snowfall that blows in off the North Sea and is funnelled upriver I have also considered readings from Epping (107m), Rayleigh (73m) and Southend (27m). Indeed, in some years Wanstead’s snowfall is much more similar to Rayleigh and Southend than it is to Greenwich and Teddington. Though my site is only 18m it seems to catch the snow much better than surrounding areas – probably to do with the fact that Aldersbrook is surrounded by greenery. People walking down from Wanstead village often remark that Wanstead Park is far snowier than the village a couple of dozen metres or so higher. Before 1965 I have used data from Woburn, Bedfordshire, which at 89m and 40 miles away as the crow flies, is the closest station in that long running series.

The mean temperature of a winter can look cold but it doesn’t always tell the full story. You can have a winter dominated by high pressure over the near continent making things very dry. But the anticyclones that ridge from Central Europe to the Azores can leave us in the ‘warm’ part of the high – and often lead to days of anticyclonic gloom; cold grey, dank and boring weather with little sunshine. On paper a season can look cold but in reality totally unremarkable; it is the number of days with ‘snow lying’ that people remember. For snow to settle it needs to be cold! For this reason I haven’t bothered with ‘snow falling’ data as it can snow at 4C in very dry air – yet nothing settles. Most weather geeks find ‘snow falling’ the most frustrating when it doesn’t stick. So on to the results.

The Top 20 winters in Wanstead, using 'snow lying' and 'mean temperature' in stats. Click the image to view all 67 winters
The Top 20 winters in Wanstead, using ‘snow lying’ and ‘mean temperature’ in stats. Click here to view all 71 winters back to 1946/47

Once I worked out the ‘snow lying’ days I decided to devise a winter index by dividing ‘snow lying’ by seasonal mean temperature. Because the results using Celsius were problematic in that 1962/63 becomes very skewed upwards I decided to use Kelvin.

The results are quite surprising. Coming out top, not surprisingly, is 1962-63 with an index of 25.2 and 69 days of snow lying. Second is 1946-47 with an index of 21.1. Third is 1981-82  with an index of 10.5 – surprisingly ahead of 1978/79, the first winter in the series that I can recall; I remember returning home from school one night in December 1978 and the snow being as deep as the twelve-inch step to our house.

The index of 25.2 for the 1962/63 winter and 21.1 for 1946/47 – over double the amount of 1981/82 – shows how ‘off the scale’ those two winters really were. My father, who doesn’t share my enthusiasm for the weather, can distinctly recall the severe conditions of 1962/63. He said the roads were so thick with snow that when the thaw finally arrived in March he’d become so used to driving on snow that he crashed through somebody’s front garden wall, after losing control of his Mini on surface water sat on the ice.

More recent winters, which pale by comparison, rank surprisingly highly. The 2009/10 winter comes in at Number 10, higher than the legendary 1986/87, where the coldest day in recent times was recorded in London, which came in at Number 12. It should be noted that January 1987, when on the 12th the temperature did not rise above -5.5C all day, was sandwiched by a mild December and February.

OLYMPUS DIGITAL CAMERAJust by looking at winters with a mean of, say, 5C doesn’t tell you much about snowfall. When you look at 1985-86 (mean 4.1C)  there were 22 days of snow lying at 9am – yet 2005/06 was colder (3.9C) and only 3 mornings saw snow lying – though that winter was particularly dry – the 13th driest in the series.

The median for ‘snow lying’ days in this series is six. The rolling median of the past 30 years, however, is only 2 so, with this in mind, if it does snow you should get out there and make the most of it.

You can view over 70 years of winters in this area, all ranked using my winter index here.

Screen Shot 2017-12-21 at 14.44.05

*It should be noted that a day of ‘snow lying’ only qualifies if there is more than 50% cover at the observation time of 9am. This means that it could snow 1cm at 10am – if that snow thaws by 9am the next day it won’t count. Though 8 winters appear snowless it is possible that these winters did see temporary coverings