‘Worst-ever!’, ‘in living memory’, ‘highest on record!’, ‘unprecedented!’. These phrases, used often by newsreaders on the main networks including Sky and BBC, always set an alarm bell ringing in my head. None more so than weather stories which, with the stormy winter we’ve just had, has been happening almost daily since the middle of December.
As the winter has progressed the networks have tried to out do one another with the severity-value of a story. What starts with a reporter gingerly standing by the side of a flooded field within days changes to the reporter, donning a pair of fisherman’s waders, trawling waist-deep through a flooded Berkshire housing estate.
The media also seem to delight in rushing out Met Office data to proclaim these armageddon scenarios before the season is over and the statistics can be properly studied, absorbed and commented upon.
Last summer, I started to build a dataset for my own area – Wanstead. Using local figures from the City of London Cemetery I was able to take the daily series back to 1959. Beyond this I then sourced monthly data for Greenwich, 6 miles away, back to 1881. Using W.A.L Marshall’s A Century of London Weather and Luke Howard’s The Climate of London enabled me to take the series right back to 1797.
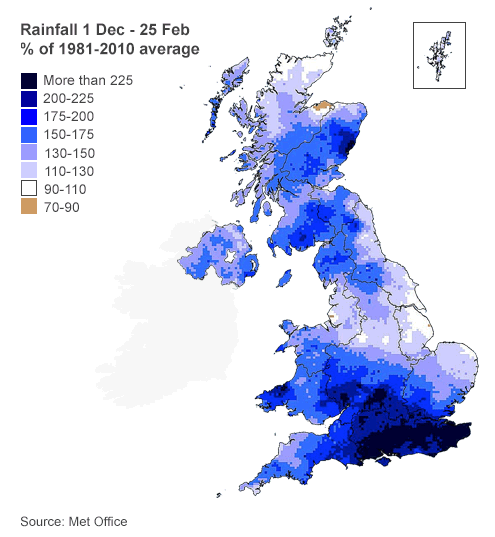
The series makes for interesting reading, putting this winter as 6th wettest since 1797. Scientists would say that because my series is only one dataset it cannot be regarded as a ‘catch-all’ for the country overall. But when statements like “England and Wales has had its heaviest rainfall since 1766” are put out by the media it is blatantly not true for the entire country. Just a quick look at the map shows that while parts of south and southeast England have been very wet – other parts of the country have been much less so.
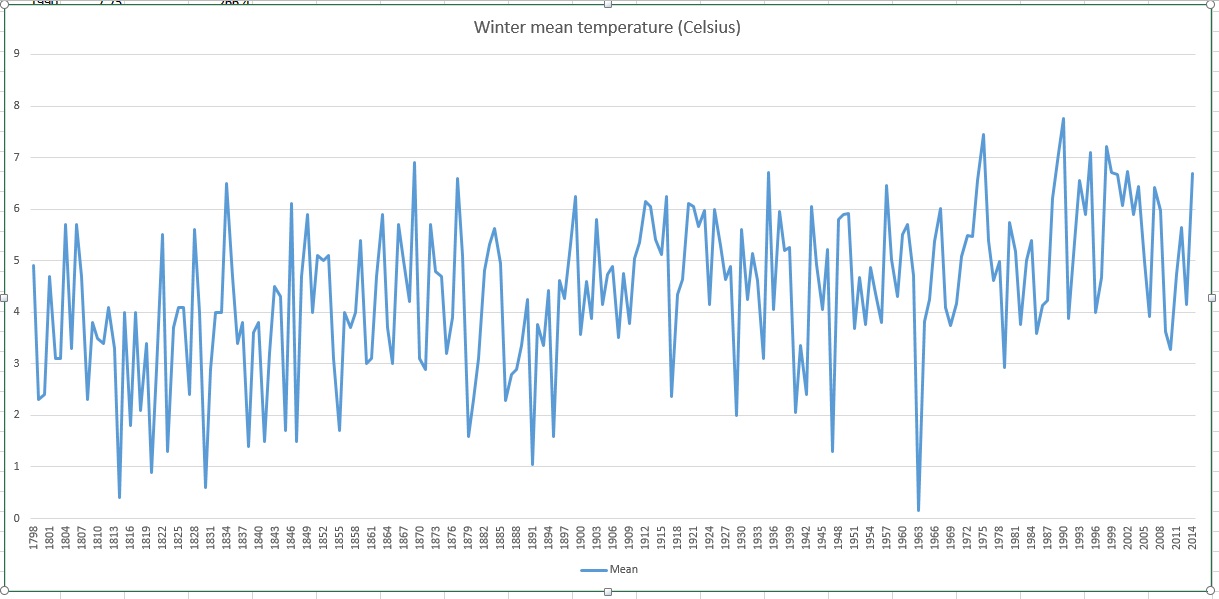
But in this age of 24-hour rolling news the message to anyone who takes the headlines at face value is that this has been the wettest winter ever. You can view the winter mean temperature and rainfall stats here.
Although February was wet it was relatively much dryer than January and calmer than the other two months. February often brings us our best snowfalls and coldest weather but this was completely absent this year, continuing the theme of a snowless December and January.
The water table appears to have come to the surface on Wanstead Flats
Some 69.9mm of rain (178% of average) fell in February – the wettest since 2010 – and 32nd wettest in the series back to 1797.
February was also warmer than average with a mean temperature of 7.5C (2.2C above the 30-year average) – ranking it 13th in the series since 1797 – and the warmest January since 2011. Though the month was very mild no single day was particularly mild. Highest maximum was 14.5C on the 24th.
The most notable day was a storm on the evening of Valentine’s Day into the 15th which saw yet more damage, resulting in two deaths including a man killed by a wave on a cruise ship in the Channel. A woman was killed when a 3ft by 3ft block of falling masonry crushed her car outside Holborn station.
Air frosts: 0 – very unusual for February
Ground frosts: 7
To view full stats follow this link: http://1drv.ms/1cBRoH3
Floods in Somerset have, up to now, seemed far removed from our own back yard. But with thousands of homes by the upper parts of the River Thames now at risk of flooding I wondered how safe we were from our own rivers.
A look back through the reference books show the geography of the Roding and Lea Valleys has made the area prone to inundations for hundreds of years.
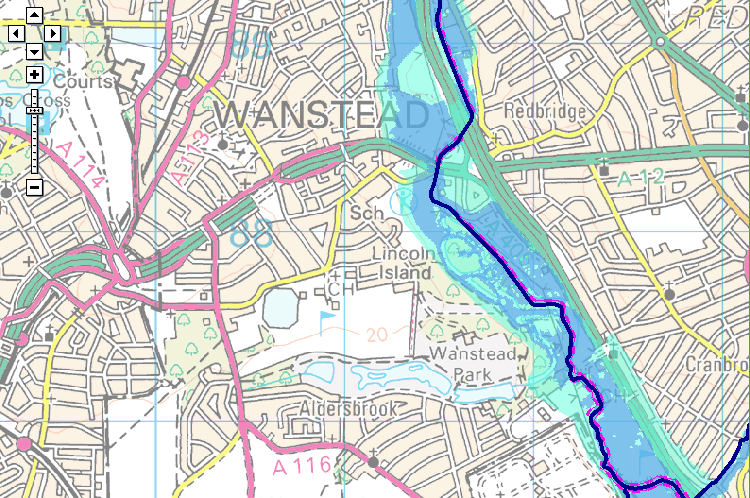
The Environment Agency’s Flood Map for Planning shows the flood zone risk of the area. And endorses Howard’s account that the river Lea was ‘a mile wide’ at its peak
In January 1809 the lower River Lea burst its banks in several places following a deluge that dumped two inches of rain in the space of 24 hours. The rain abruptly ended a snowy cold spell that had begun over a month before in the middle of December. From Luke Howard’s readings it is likely that up to half a metre of snow had fallen in the previous weeks in the upper parts of the surrounding countryside with only slight thawing. With the frozen ground unable to absorb any of the rapidly melting snow and rainfall the amount of water flowing downstream must have been immense. Howard takes up the story…
“The River Lea continued rising the whole of the 26th… The various channels by which it intersects this part of the country were united in one current above a mile in width which flowed with great impetuosity and did much damage.”
Howard, his chemical factory located on the banks of the river Lea close to what is now Bow flyover, wrote at length about the event, his account replacing the usual brief notes about daily weather in his book The Climate of London.
He talks of embanked pasture land being “filled to the depth of eight or nine feet” and people driven to their upper rooms relieved by boats plying under the windows.
The Environment Agency’s Flood Plan map of the Thames illustrates Howard’s comment that “the Thames was so full during this time that no tide was perceptible”
“The Thames was so full during this time that no tide was perceptible.” It took until February 23rd for things to return to normal.
Miraculously no lives were lost in the flood and cattle “by great exertions” were saved by being kept in their stalls. Howard, saying that the flood could have been far worse, believed a neap tide, strong westerly winds urging water down the Thames and mild weather helped avert a tragedy.
Howard’s statistics of the previous months show that the second half of 1808 were wetter than average – though not especially so. And nothing like the rainfall we have had this winter. From December 1st until February 8th Howard recorded 130mm of rain, which is about 100mm less than what I have recorded this winter.
This fact alone shows just how much the nature of the river has changed in the last 200-odd years thanks to spending on flood defences.
Work to improve the defences was prompted 67 years ago when similar catastrophic flooding came with the thaw that ended the severe winter of 1947, one of the coldest winters in recorded history and an episode remarkably similar to what Howard recorded in 1809.
Flood risk areas around the River Roding close to Wanstead are much smaller than the equivalent area in Lea Valley
The Lea Valley, along with many parts of the country, saw some of its worst flooding in a generation. The river burst its banks at several points bringing misery to surrounding communities. Valleys turned into lakes in 40 counties and East Anglia’s fens were a sandbagged inland sea. More than 100,000 properties were damaged and, then as now, heroic battles were fought by the military to keep water-pumping plants and power stations dry.
The sense of crisis was felt worldwide. Canada sent food parcels to stricken villages in Suffolk; the prime minister of Ontario even offered to help dish them out.
A marker of that flood, together with a history of flood defences, can be found here. There is also British Pathe footage of another flood between 1910 and 1919 here .
The River Lea Flood Relief Channel, that flows between Ware, Herts, and Stratford, took almost three decades to complete. The channel incorporates existing watercourses, lakes and new channels. Since it was completed in 1976, there have been no major flood events in the Lea Valley, although there have been three occasions when the river system was full virtually to its capacity: in 1987, 1993 and 2000. Since its completion, the level of protection afforded by the structure has declined, so that in some areas it offers 2 per cent protection, and in some, only 5 per cent protection. The Environment Agency published a strategic environmental assessment in 2008, which looked at ways to maintain the flood defences in the Lea Valley.
The water table appears to have come to the surface on Wanstead Flats
It remains to be seen whether we will see any flooding in Redbridge – a further 40mm of rain is forecast to fall up to Saturday morning. As well as the problem of rain there is also the issue of the water table which in the past week has risen to the surface in places. Inland lakes forming on Wanstead Flats have seen the cancellation of football fixtures and a couple of people I’ve spoken to say standing water has started to appear in their cellars
It is all too easy to blame the Environment Agency for the current flooding in Somerset and elsewhere but the meticulous planning by its forerunners brought, at least to date, an end to the widespread flooding problem in the Lea Valley.
As the government struggles to find a solution to the current problems with flooding it would do well to look to the grand schemes of the past and forget about any planned cuts to flood defences.
For anyone who likes cold weather it has been a dreadful winter so far with no snow falling or lying in this part of Britain.
An inversion during the first half of December saw the edges of ponds in Wanstead Park begin to ice up
A very mobile synoptic regime has seen numerous vigorous depressions blowing in off the Atlantic bringing flooding misery for many as swollen rivers burst their banks.
The predominantly maritime air over us has meant that even air frosts have been few and far between.
Since December 1st, Wanstead has recorded just 7 air frosts – half the number of last year. The coldest night was just -2.9C , warmer than the -6.9C recorded by this point last January.
The current mean temperature this winter to January 14th is 6.6C with rainfall 133mm – statistics that are remarkably similar to the winter of 1985/86 (mean 6.8C rainfall 130mm). That December and January was followed by a very cold February – the 4th coldest in a series stretching back to 1881.
However, before any coldies reading this get excited it should be noted that this season is also remarkably similar to winter 1989/90 (mean 6.8C, rainfall 128mm), which was followed by more stormy weather, including the Burns’ Day Storm, and the warmest February on record in this region.
Further scrutiny of stats for the Wanstead area reveal other years were similar. Using my method for finding patterns stretching back over 50 years to forecast this winter I picked out years that were +/- 10% of the mean. From these I then weeded out the seasons where the rain was +/- 10% of the 2013/14 rainfall total. This gave a list of five other winters with similar temperature and rainfall. Leaving aside 1985/86 and 1989/90 the other winters weren’t anything special with ‘snow lying’ days below the median for this area of six.
As I write this there are tentative signs on the weather models that a Scandinavian high may begin to form next week, introducing colder air from the east – exactly what we need to precipitate snow. However, they are just tentative signs and the cold air may never reach this far west anyway. Bear in mind also just how strong the influence from the Atlantic has been so far this winter. The Met Office have said the storms have been the worst in 20 years – which takes us back to the year in the above table of 1993/94. The only snow lying in that DJF season occurred in a short cold snap around February 15th – though, admittedly, an impressive fall of snow happened the previous November.
So, in summary, the probability at this point of at least one fall of snow before the end of February could be put at 75%. No snow: 25%. Abundant snow: 25%.
Damaging gusts associated with the depression on December 23rd felled this tree by the war memorial in Wanstead High Street
While compiling the figures I found that for my winter forecast to be correct would need a second half to winter exactly the same as 1985/86.
Some comparisons have been made between this winter and the balmy winter of 1988/89 – though that winter, the second warmest in the 1960-2014 series up to this halfway point, was a full degree warmer than this season and much drier, with only 30.9mm falling in over 6 weeks.
The culprit of the dry weather of that season 24 years ago was the influence of a very strong European high pressure which ‘blocked’ weather fronts from reaching this part of the UK, sending a conveyor belt of depressions skirting over Scotland bringing incessant rain instead of snow to Cairngorm resorts.
The nature of the weather this time round has been very different. Though December started with a strong anticyclone over Europe fronts associated with very deep depressions off the Atlantic have made inroads deep into the continent.
A classic Genoa low brought over 2 metres of snow above about 1,000m on Christmas day to resorts on the south side of the Alps. The nature of the airflow subsequent to that, however has brought some very high temperatures for the year.
Scottish and continental European winter sports enthusiasts will remember the season of 1988/89 well for all the wrong reasons, with little snow falling before March. I can vividly remember some amazingly cheap skiing holidays advertised on Teletext in January 1990. One deal was a week to Andorra for £19, including flights, transfers and half board in a 3-star hotel. A few of the lads in my A-level economics class took full advantage – only to return with tales about snowless mountains, sprained knees and wrecked skis, though it’s not clear how much of an influence the duty-free booze had.
Although many resorts were already investing in artificial snowmaking it was this season that quickened the pace of investment in snow cannons.

 As the winter has progressed the networks have tried to out do one another with the severity-value of a story. What starts with a reporter gingerly standing by the side of a flooded field within days changes to the reporter, donning a pair of fisherman’s waders, trawling waist-deep through a flooded Berkshire housing estate.


You must be logged in to post a comment.