Tag Archives: clouds

Summer forecast 2016: yo-yo weather

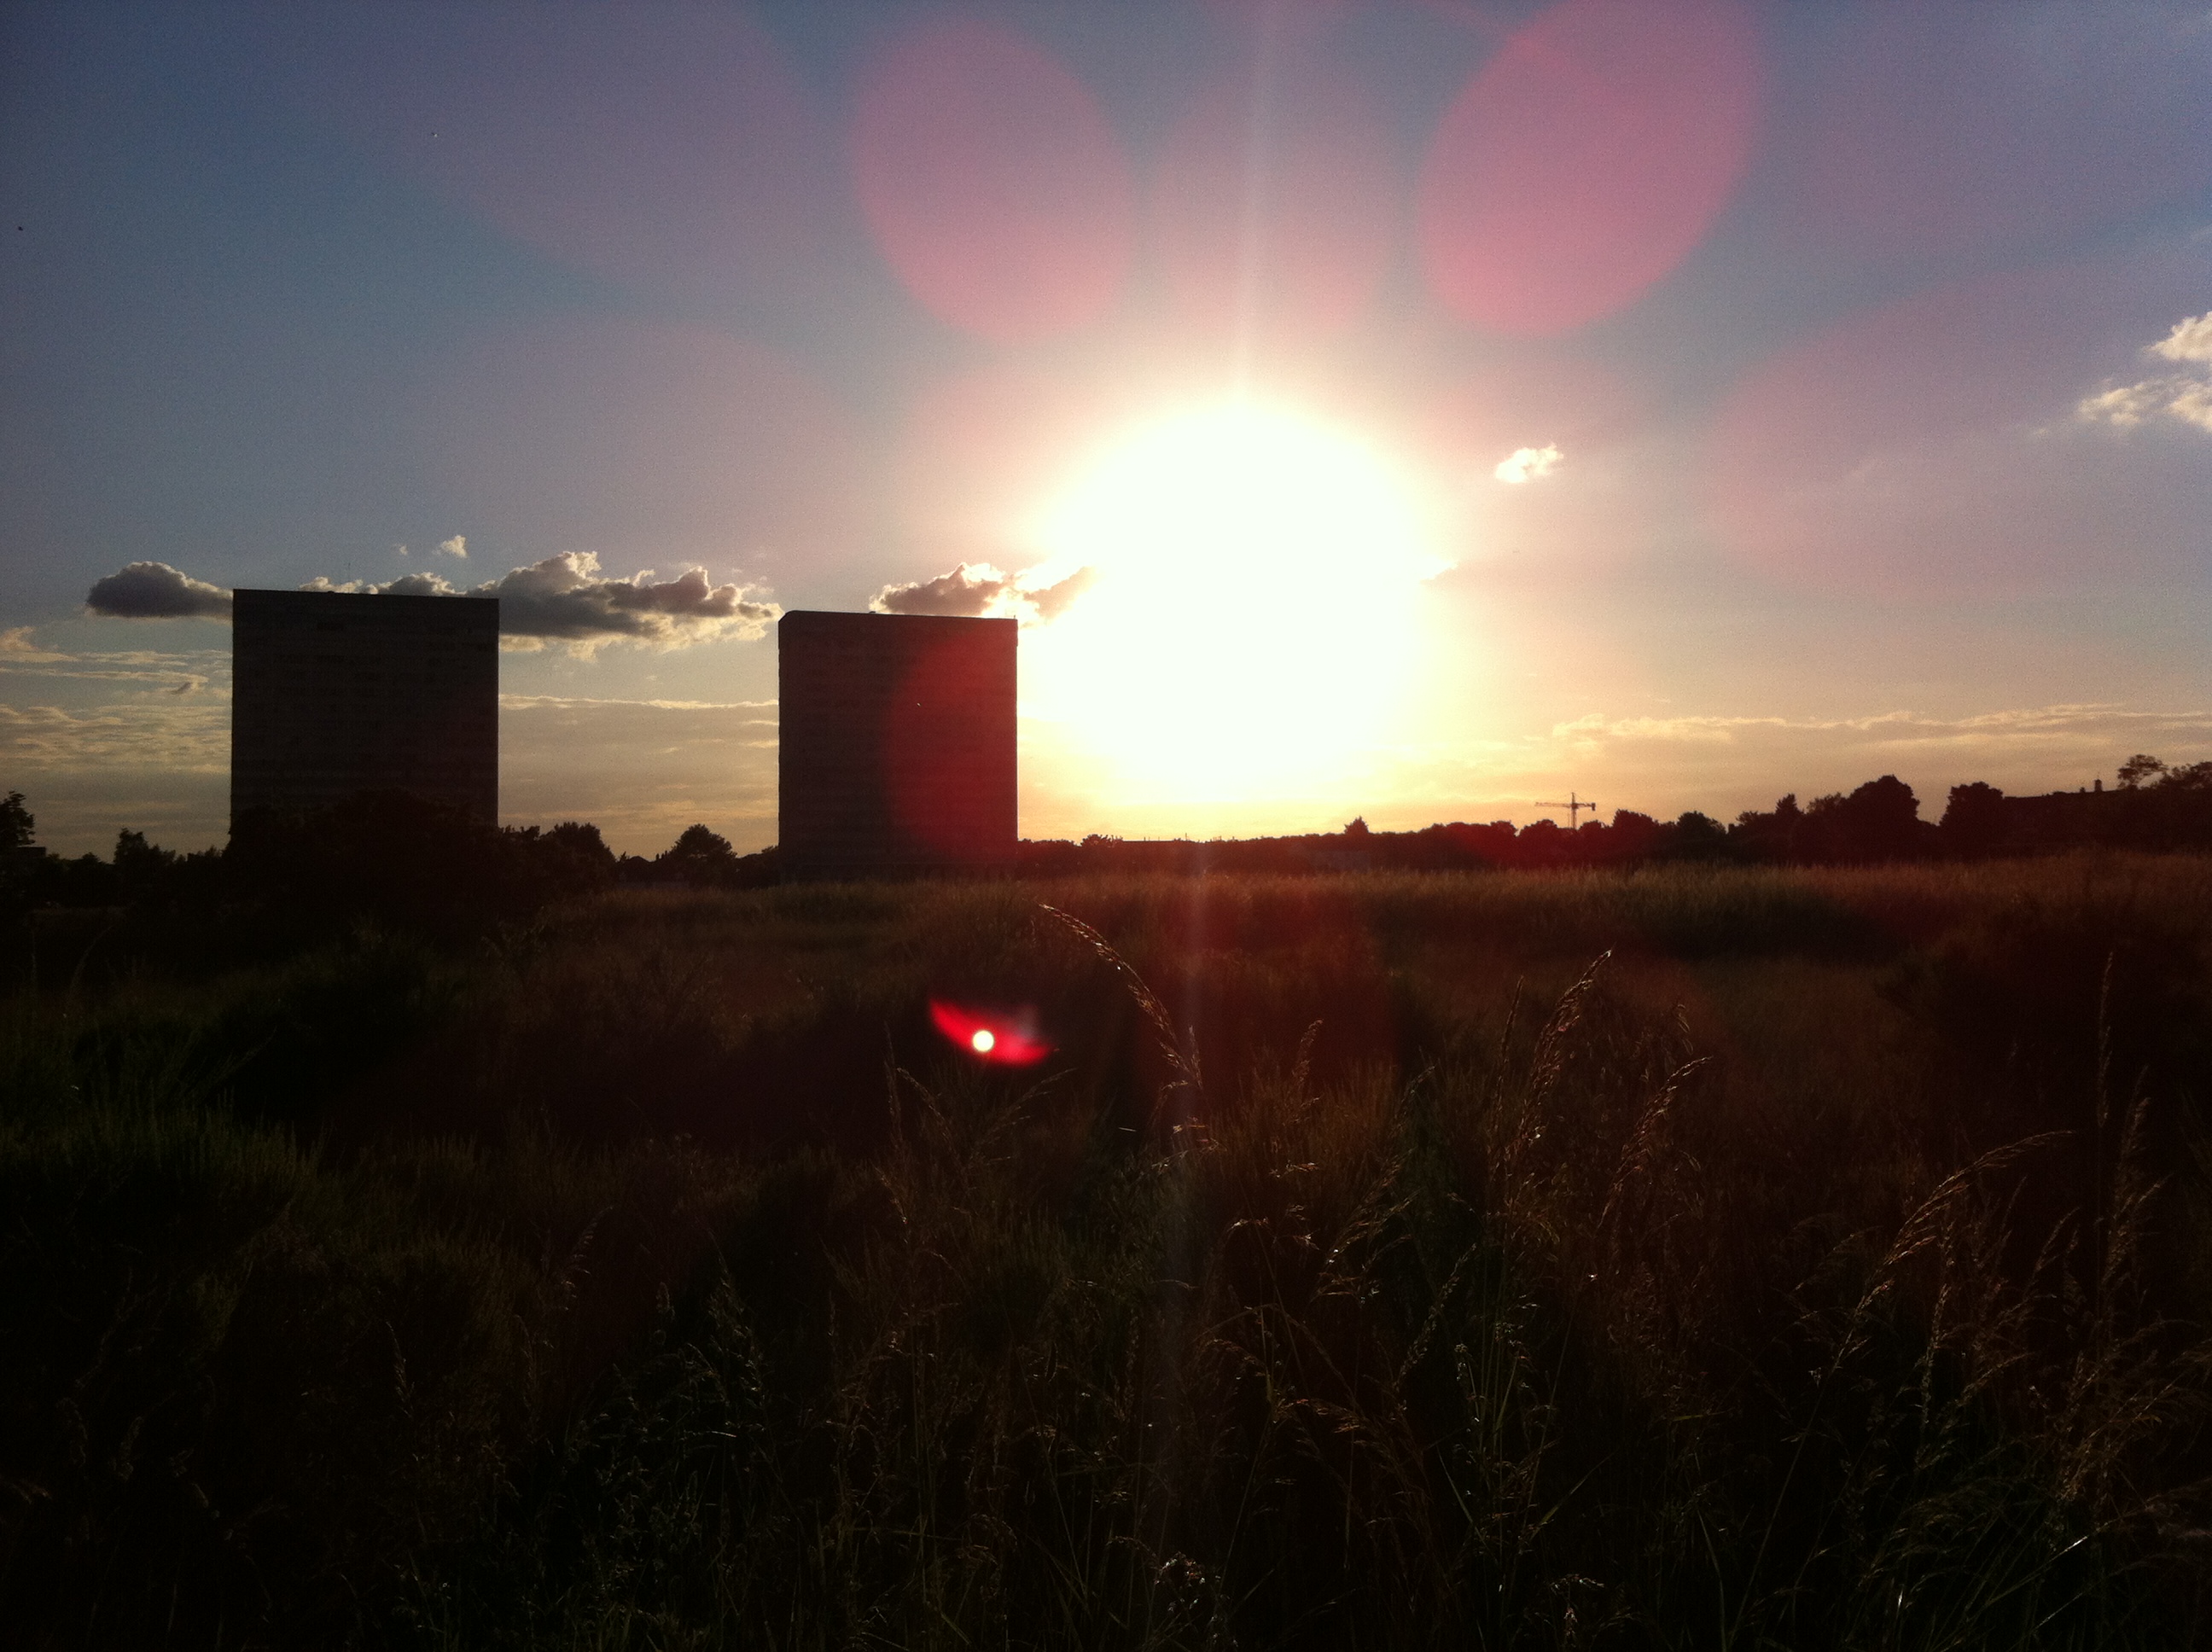
The cold start to June may soon be a distant memory once summer proper gets going in east London. But rather than a succession of prolonged hot, dry spells it’s looking like the season overall will be broadly average – you will hear the old saying: ‘an English summer consists of three fine days and a thunderstorm’ more than once this year.

Heavy shower cloud looking east over Wanstead Flats
Three fine days and a thunderstorm – the typical English summer

Looking at summers back to 1799 I’ve tried to find a pattern linked with a declining El Nino. And failed to find anything conclusive. With ENSO forecast to be approaching neutral by August I decided to discount it completely, instead relying on pattern matching of meteorological data from this area for March, April and May stretching back to 1799.

The mean for the spring season was 10C with 156.4mm of rain and 455 hours of sunshine.

If you take into account all years that were within +/- 10 per cent of these figures, for rainfall and then mean temperature, some 36 ‘best fit’ years emerged, far more than my previous two attempts to forecast summer. The years, ranging from 1805 through to 2007, saw all manner of summers – only one was a real corker, 1825, but most were fairly nondescript average affairs. As an average this summer could be expressed as: Mean: 16.7C (just above average) Rainfall: 166mm (exactly average) Sunshine: 546hrs (about average)

Or, expressed in probabilities, I concluded the following:

summer 2016 probs


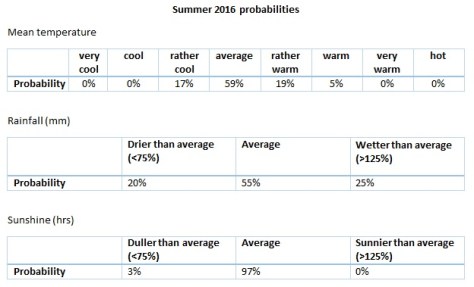
From the above you could deduce that the next three months will be slightly warmer than average, with average rainfall and sunshine.

Last year I tried to decipher, with fair success, when hot spells would occur. However,  looking at the data of these 36 summers very warm, dry spells happened through the three months – it was impossible to find any exact pattern to when it would be warm and dry.

Instead I’ve broken down the summer into June, July and August probabilities.

Looking at June, considering this cool and cloudy start, I would guess that we can look forward to a few very warm, thundery spells – a repeat of the Spanish plumes of the past couple of years.

june 2016 probs

Considering the above data perhaps there is a greater than evens chance of some thundery activity – and the nature of thunderstorms mean you can get a deluge or stay relatively dry / average. Sunshine average.

On to July. After a ‘rather warm’ June I wonder if the ‘return of the westerlies’ will happen just in time to affect this month?

July 2016 probs

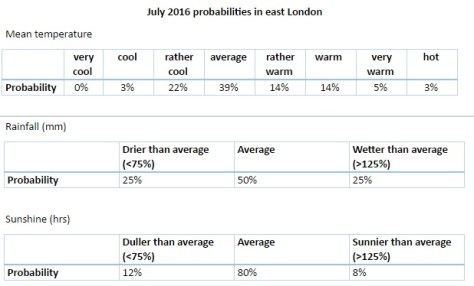
The above chart would suggest that July will be classically average overall. Fine, not too hot spells, with occasional depressions bringing cooler weather and showers.

On to August. This month has been a real disappointment the past couple of years. However, I think this year August may offer a bit more in the way of sunny weather.

August 2016 probs

Looking at the above probabilities there seems a fair chance of something average to rather warm overall. With rainfall below average and average sunshine I wonder if there will be two or three fine spells throughout August – perhaps more?

So, all-in-all, summer looks a mixed bag. How this summer will fair obviously only time will tell. One could argue that what I’m forecasting is just climatology which has a good chance of being correct should no external influences, such as a huge eruption on Mount Etna, have a bearing on the end result.

* Taking into account the fact that temperatures in London are up to 0.66C warmer than they were 100 years ago I have added 0.66C to mean temperatures before 1915.

** Obviously, in the event of a series of direct hits from thunderstorms, my rainfall estimate could be hopelessly short – a symptom of abundant solar energy at this time of year which creates a ‘noisy’ atmosphere compared with winter.

*** The 1981-2010 average mean for summer in this region is 17.6C, with 144.9mm of rain and 564 hours of sunshine

Advertisement

Summer forecast 2015: average

This summer is looking an average one. Before you write it off, however, average summers do come with decent spells of warmth and sunshine. But I think the old saying that an English summer consists of three fine days and a thunderstorm will be used more than once this year…impending

To reach my conclusion on this summer I have used pattern matching of meteorological data from this area for March, April and May stretching back to 1799.

The dry and sunny weather of March and April was tempered by a very average May. The mean for the spring season was 10.5C with 75.8mm of rain and 511 hours of sunshine.

If you take into account all years that were within +/- 10 per cent of these figures, for rainfall and then mean temperature, you get the following table.

The ‘best fit’ years were revealed as 1844, 1870, 1880, 1943, 1995, and 2009. As an average this summer could be expressed as: Mean: 17.4C (about average) Rainfall: 127.3mm (below average) Sunshine: 567hrs (about average)

spurOr, expressed in probabilities, I concluded the following:

Very Warm ( above 20.4) 0%

Warm (19.4 – 20.3) 0%

Rather warm (18.4-19.3) 17%

Average (16.9C – 18.3C) 50%

Rather Cool (15.9 – 16.8) 33%

Cool (14.9 – 15.8) 0%

Very cool (below 14.8C) 0%

Very Wet ( 3.8 x average) 0%

Wet (2.9  x average) 0%

Rather wet (1.9 x average) 0%

Average 50%

Rather dry (0.7 x average) 33%

Dry (0.5x average) 17%

Very dry (0.25 x average) 0%

So from the above you could deduce that the next three months will be average to rather cool, with average to slightly below average rainfall. Sunshine average.

Trying to predict daily detail over the next 3 months is impossible, but looking at the ‘best fit’ years mentioned above it is probable that the opening 10 days of June will be among the coolest of the summer. Screen Shot 2015-06-03 at 03.15.12

Of interest to most will be when are the hot spells most likely to happen. Considering the median of all rain days a dry spell happened without fail between the dates of June 28th – June 30th and August 15th – August 19th; both these spells likely ending with thundery breakdowns. Another date to bear in mind for a possible two-day fine spell is July 24th-25th.

So, all-in-all, a mixed bag. Looking at the ‘best-fit’ years, however, it is worthwhile noting that although the overall picture looks average there exists the record-breaking dry August of 1995 and the notably wet and thundery July of 1880.

My summer forecast last year was broadly correct. How this one will fair obviously only time will tell. One could argue that what I’m forecasting is just climatology which has a good chance of being correct should no external influences, such as a huge eruption on Mount Etna, have a bearing on the end result.

* Taking into account the fact that temperatures in London are up to 0.66C warmer than they were 100 years ago I have added 0.66C to mean temperatures before 1915.

** Obviously, in the event of a series of direct hits from thunderstorms, my rainfall estimate could be hopelessly short – a symptom of abundant solar energy at this time of year which creates a ‘noisy’ atmosphere compared with winter.

*** The 1981-2010 average mean for summer in this region is 17.6C, with 144.9mm of rain and 564 hours of sunshine

June 2014: warm and dry

June 2014 continued this year’s theme of being milder than normal; the mean temperature of 17.1C was 1C above average, making it the 22nd warmest June since 1797.

little fluffy clouds
June was marked by some spectacular cloudscapes and sunsets. This was the view across Wanstead Flats from Centre Road looking toward Ilford on the 21st

June, like  March and April, was dryer than average with just 15.2mm of rain, that’s just under 30 per cent of average.

The driest June since 2000 started off unsettled with frequent rain – 6mm falling on the 3rd. The following day was cool with the temperature reaching just 16.2C.

Though there were nine days when over 10 hours of sunshine was recorded the magic 80F was surpassed just once: on the 9th when 27.5C was reached under 6 hours of sunshine. This sunniest day was the 10th when 14 hours of sunshine nudged the thermometer to 24.5C. Overall there were 214.1 hours of sunshine – that’s 120% of average, the sunniest since 2011.

On many days during June, including the 30th shown here, the sky turned dark but just spits and spots of rain were often produced

Despite plenty of potential no incidents of thunder were recorded – the much-hyped weekend of the 7th / 8th saw less than 2mm of rain – all of the action staying well to our east in the France, Germany and the Low Countries. Further thundery potential on the 13th failed to produce anything in this area though a disturbance over Berkshire saw thunderstorms develop in the Oxford, Reading, Basingstoke and Wokingham region, with up to 38mm of rain falling over a wide area.

It is a typical feature of summer that rainfall can vary a great deal across a small area. The nearest official station to Wanstead, St James’s Park 8.4 miles to our south-west, recorded 33.8mm – more than double what fell here.

Some nights were chilly when the sky cleared but there was no air frost or ground frost.

To view full stats follow this link:http://1drv.ms/1kiTuzv

Yet another occasion of impressive cloud formation during June included this example of late evening cirrus. The formation, seen at ground level, seemed similar to a display of the Aurora
Circumhorizontal arc over Aldersbrook

Captivating clouds and superlative skies

Considering we had no thunder to speak of and the threatened thunderstorms failed to materialise in this region we still saw some amazing skies at the weekend. Testament to the fact that the weather is never boring…

I took this yesterday evening. Windless, still and humid at ground level it was fascinating to look skyward and see the multi-level cloud continue to build into strange shapes, illuminated from below by the setting sun. A wonderful weekend for cloudspotting.
Wanstead Flats sunset
Wanstead Flats looking west
little fluffy clouds
Little Fluffy Clouds over Wanstead Flats. The contrast of the deep blue, white clouds and green grass never fails to disappoint as we approach the Solstice
shard
A walk along the foreshore on the north bank of the Thames revealed this vista. The Shard looks very other worldly and looks like I’ve Photoshopped it in. Love it or hate it, the thing is there for good now…

swirl

Looking south from Borough

photo (2)

Heatwave? washout? Or just another changeable British summer?

chicken cloudWith all the talk of heatwaves this week it won’t be long before the media switches from piping on about the UK facing “10 years of miserable summers” to “Is our climate getting warmer?”.

But the simple fact is that the UK’s climate has always varied greatly – some years, as in the last two, the pattern for summer has brought mostly miserable weather. Other years we get a run of warm, dry summers.

A case in point was the heatwave of July 1808. Far removed from images of freezing Georgian winters and miserable summers the July of 205 years ago was among the warmest ever. The monthly mean for July 1808, according to the Central England Temperature series, was 18.4C – the 6th hottest July since the beginning of the series in 1659.

Readings taken by Luke Howard at Plaistow show the build up of heat to the 14th. The series on the right, taken in Wanstead, around 3 miles to the north-east, will be added to by the author as July unfolds
Luke Howard, the ‘father of meteorology’ who at the time lived in Plaistow, referred to the heatwave in his diary on July 13th: “Temperature at 9am 84F. The intense heat of the maximum lasted nearly three hours till about 4pm. At 6pm the temperature was 90F.” Another entry mentions a reading taken nearby. “Another at Plashet, a mile and a half eastward, indicated 96F as the maximum under the shade of a house.”
While Howard’s methods of measuring the temperature ran short of modern standards, his thermometer was hung under a laurel bush, the values still give a valid insight into the heatwave.

Tales of the heatwave, which particularly affected east and north-east England, can be seen in letters sent to local newspapers around the country. Many describe labourers dying from heat exhaustion while working in fields. Farm animals and horses suffered a similar fate. One letter from Hull, published in the Coventry Mercury, said: “At Sigglesthorne, the honey in some beehives melted, ran out upon the ground, and most of the bees drowned in it. At Sutton, a lamb and a dog belonging to the Rev Mr Croft of Rowley, expired in the heat; and several birds dropped down dead, while flying over the streets of this town.”
Of course it is impossible to know about the health of people and animals that died but that birds dropped out the sky suggests extreme heat.

screenWhile temperature records of July 1808 are not unheard of in an English summer one record that remains is the size of the hail – which fell in damaging storms when a thundery breakdown arrived on the 15th.

The main storm missed Wanstead and the surrounding area – though Howard, writing in his Plaistow observatory, knew the weather was on the turn: “Dew on the grass, a fine breeze from ENE. Much lightning in the west this night, a few drops of rain.” Howard would have been referring to all the action about 120-odd miles west where one of the most ferocious storms in recorded history was unfolding.

Much was reported in the local press on the days following the storm which affected an area from Somerset northwards. As well as local records Luke Howard also noted national events in his diary: “After several days of uncommon and oppressive heat the city of Gloucester experienced a storm of thunder and lightning which extended many miles round and exceeded in awful phenomena any one remembered for many years past.”

Trees were “shivered to atoms”, livestock killed by lightning, crops were ruined and countless windows and glasshouses smashed by huge hailstones. A lot of the detail of the storm was compiled by a man named Crocker, then governor of Frome school, Somerset. One account from Batcombe describes a hailstone that measured 13.5 inches in circumference. To give you an idea of the size of a 342mm circumference hailstone I, with the help of my daughters, made one of my own.

It is thought the size of the 1808 hailstone may, along with a storm in 1697, be the national record for hailstone size - being 20mm greater in diameter than those measured in a Horsham, Surrey, storm in 1958
It is thought the size of the 1808 hailstone may, along with a storm in 1697, be the national record for hailstone size – being 20mm greater in diameter than those measured in a Horsham, West Sussex, storm in 1958

Howard’s report continues: “The most tremendous circumstance of this storm was the destructive hail shower which accompanied its progress.”

The Tornado and Storm Research Organisation (TORRO) grades haistorms from H1-H10, where the hail increases in size from 5-10 to over 125mm in diameter. From the historic descriptions the 1808 storm was an H8/9.This exceeds the British record made during the Horsham, West Sussex, storm of September 5, 1958, which produced hailstones up to 80mm in diameter. Hailstones for the 1808 storm were about 109mm in diameter. Since 1650 there have been 119 independent H5 hailstorms in England and Wales.

Since 1900 there has been a halving in the frequency of recorded destructive hailstorms. Scientists are undecided on whether this is a result of climate change or just a variability of the British weather. But any future uptick in destructive hail should be tempered by this historic record.

It is my belief that people’s current expectations for summer were raised to unrealistic levels when we had a run of warm, dry summers a few years ago. The fact is that because of our maritime climate warm, dry summers occur in this country only occasionally. ‘Default’ summer weather is changeable, rather cloudy and, for many in the north, rather cool

So, if any media outlets do start coming out with any stories of “unprecedented heat” or “worst storm in history” bear in mind that it has probably all happened before.

Scott Whitehead
@wanstead_meteo
http://www.wansteadweather.co.uk