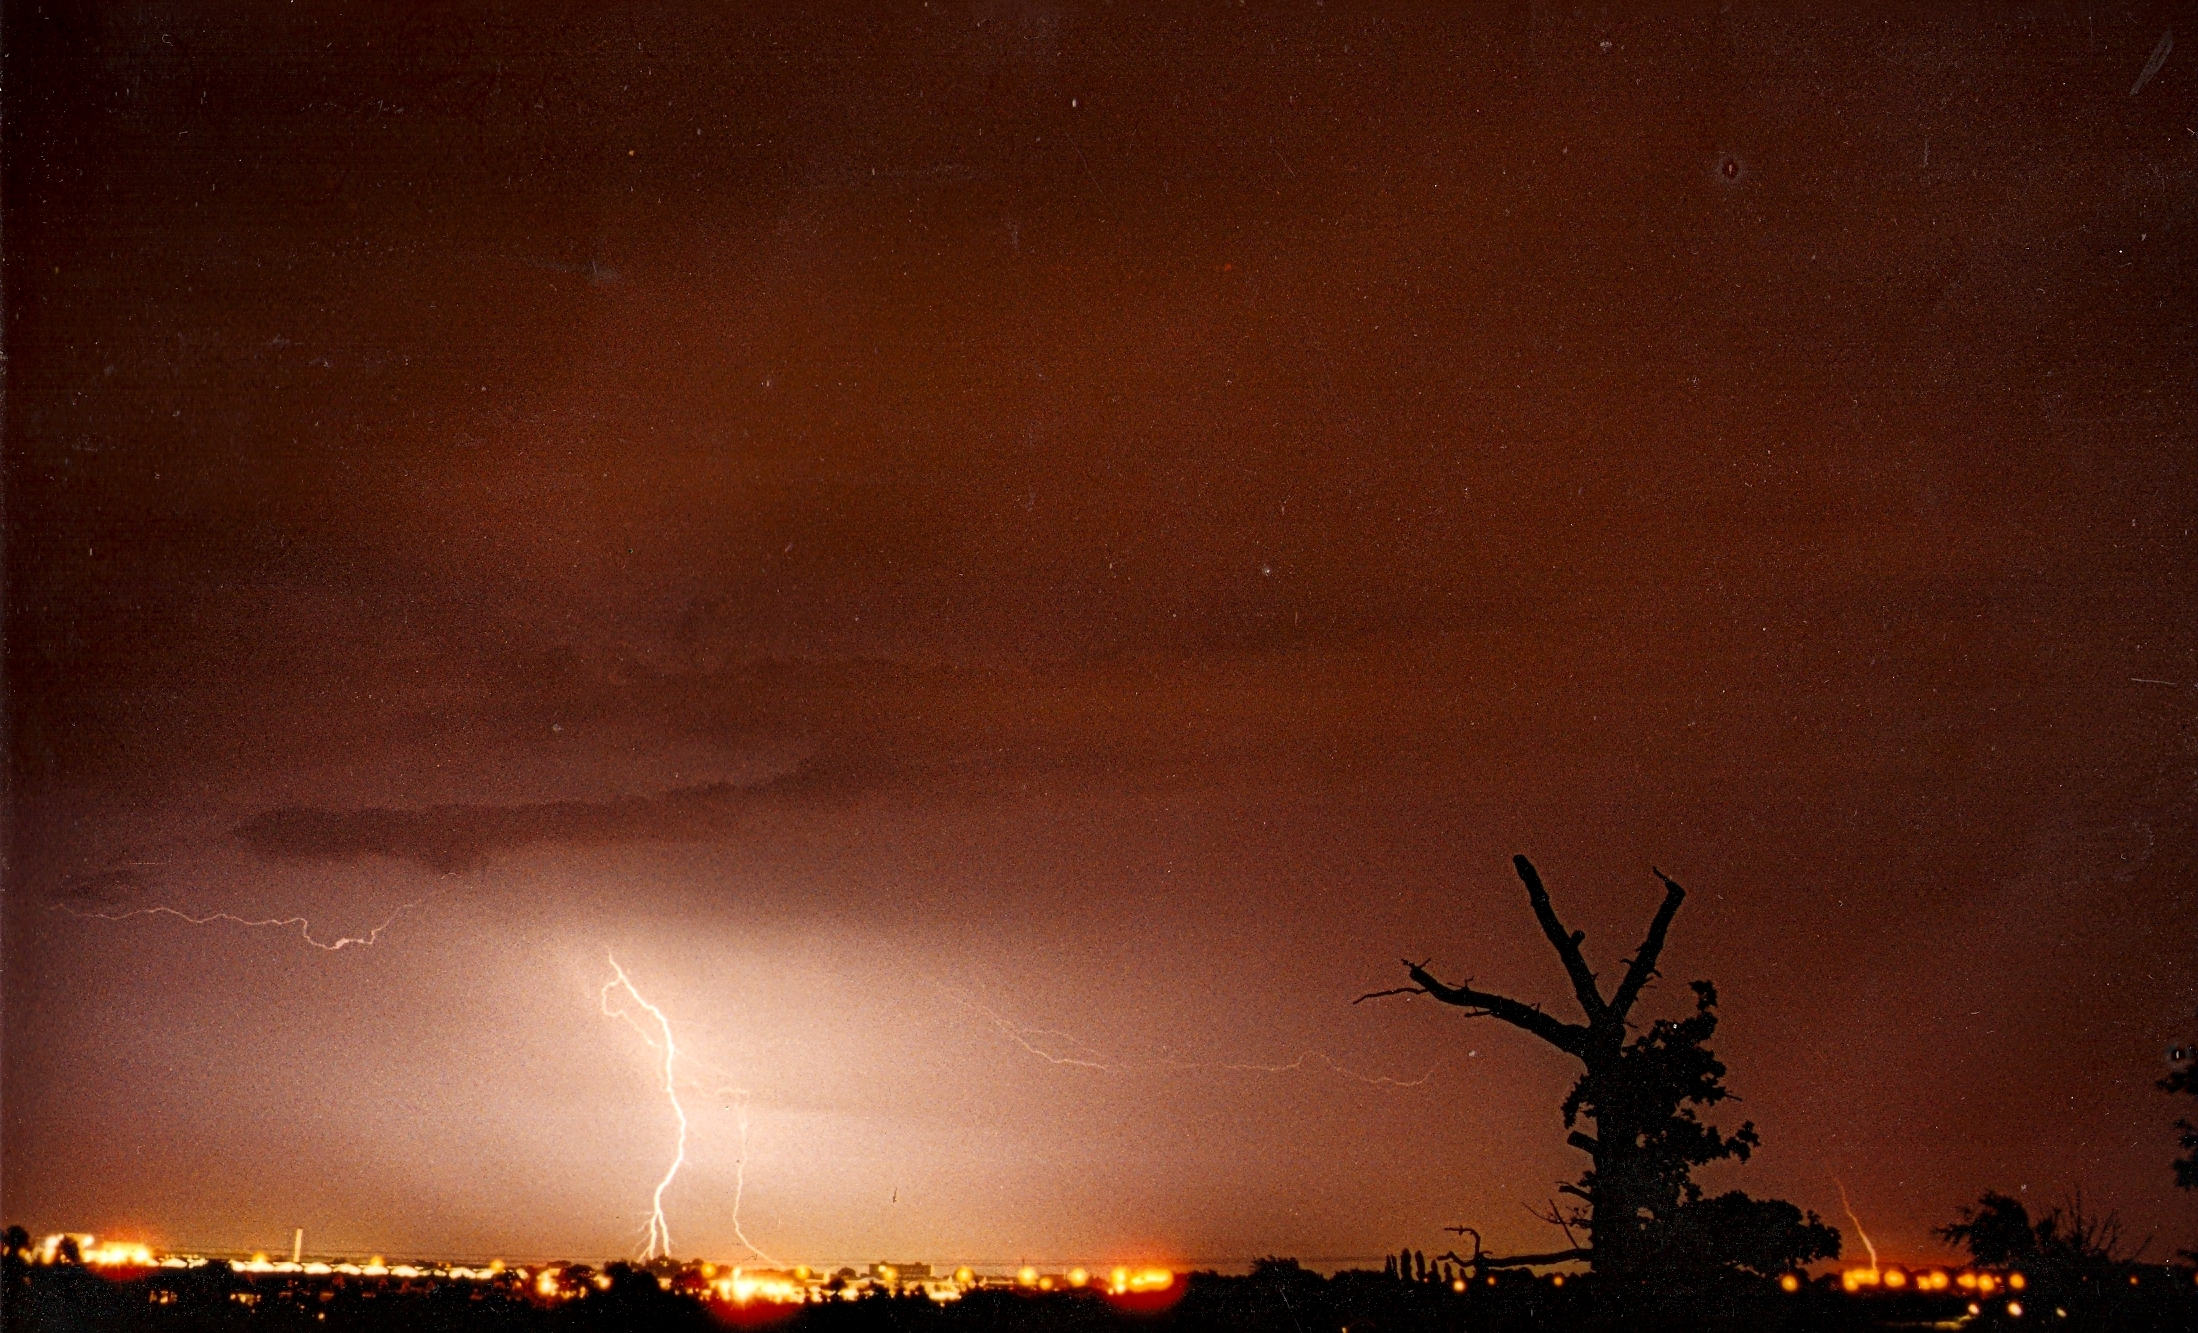
I’ve decided to cobble together a few lines on last night’s notable thunderstorms which reminded me so much of the stormy nights on the 1980s.
The radar at 3am, produced by the excellent Home and Dry, revealed that the storm’s rainfall was quite widespread. The white areas show the most intense rainfall
After writing off the risk of storms for our area last night I was awoken at 3am by loud, rumbling thunder – the kind that seems to resonate all around you. A quick look on the radar revealed quite a widespread thunderstorm, quite different from the smaller, more intense one that woke up most of Wanstead on July 23rd last year.
On viewing the live lightning map at 3.10am it became clear that this was no flash in the pan. Further rumbles and strikes had me leaping out of bed to monitor the station. EssexWeather reported 1809 lightning strikes in two hours for our region.
And on viewing the pressure graph the first storm saw a 6mb fall in pressure in a matter of minutes.
A second storm around 5.30am was less severe though still notable. The 9.4mm that the weather station recorded fell at a rate of 45mm/hr at 3am and 40mm/hr at 5.15am. Though the AWS is often out in heavy rainfall situations on this occasion it was more or less spot on – my 10am reading of my traditional 5″ raingauge revealed the official total to be 9.3mm. The rain took the July total to 108% of the 1981-2010 mean.
And a squall that blew through just before 4am is well portrayed on this wind graph.
So, all in all, a really lively sticky night where the temperature didn’t fall below 18.2C. I didn’t manage to get any of my own pictures but this one by @justinstokes on Twitter caught my eye.
According to the CAPE / lifted index further storms seem likely tonight. Indeed the situation across the Channel could be dire. It is probable a few will trundle their way across the sea to give us another sleepless night…
This wind graph shows a gust of 22.8mph at 0336z in my sheltered gardenRadar at 0519 shows another white blob (very heavy rain) about to cross Wanstead
This pressure trace shows the fall in pressure of the two thunderstorms that crossed our regionLive lightning map from http://www.lightningmaps.org/realtime at 3.10am
‘Worst-ever!’, ‘in living memory’, ‘highest on record!’, ‘unprecedented!’. These phrases, used often by newsreaders on the main networks including Sky and BBC, always set an alarm bell ringing in my head. None more so than weather stories which, with the stormy winter we’ve just had, has been happening almost daily since the middle of December.
As the winter has progressed the networks have tried to out do one another with the severity-value of a story. What starts with a reporter gingerly standing by the side of a flooded field within days changes to the reporter, donning a pair of fisherman’s waders, trawling waist-deep through a flooded Berkshire housing estate.
The media also seem to delight in rushing out Met Office data to proclaim these armageddon scenarios before the season is over and the statistics can be properly studied, absorbed and commented upon.
Last summer, I started to build a dataset for my own area – Wanstead. Using local figures from the City of London Cemetery I was able to take the daily series back to 1959. Beyond this I then sourced monthly data for Greenwich, 6 miles away, back to 1881. Using W.A.L Marshall’s A Century of London Weather and Luke Howard’s The Climate of London enabled me to take the series right back to 1797.
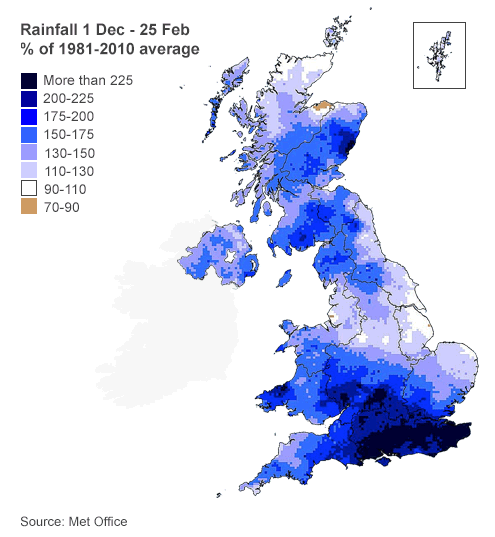
The series makes for interesting reading, putting this winter as 6th wettest since 1797. Scientists would say that because my series is only one dataset it cannot be regarded as a ‘catch-all’ for the country overall. But when statements like “England and Wales has had its heaviest rainfall since 1766” are put out by the media it is blatantly not true for the entire country. Just a quick look at the map shows that while parts of south and southeast England have been very wet – other parts of the country have been much less so.
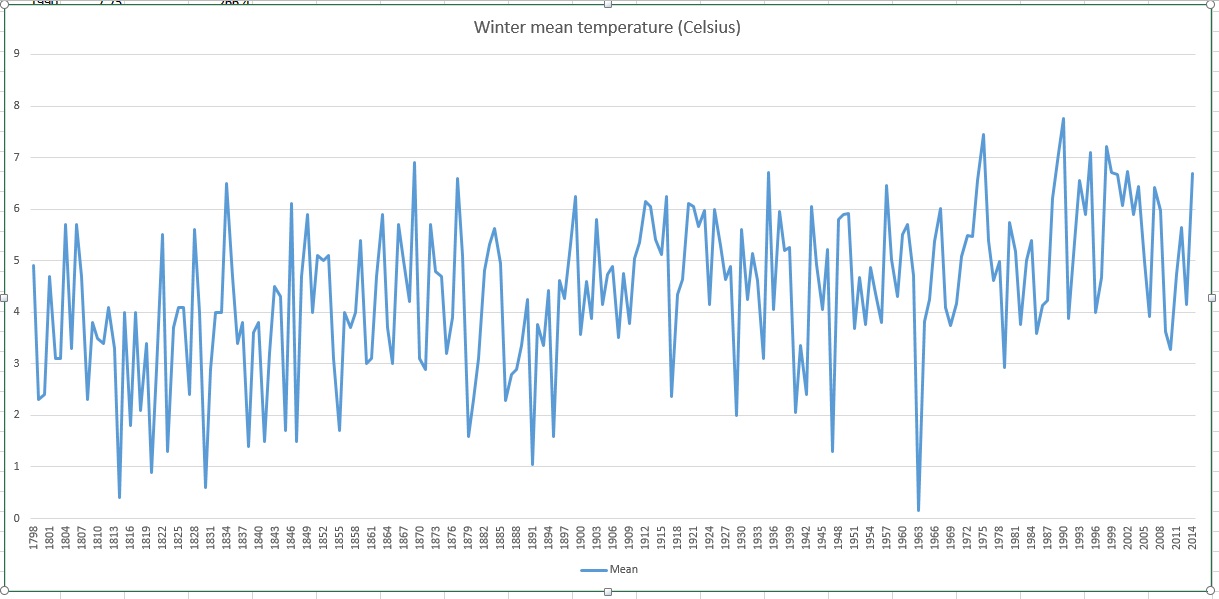
But in this age of 24-hour rolling news the message to anyone who takes the headlines at face value is that this has been the wettest winter ever. You can view the winter mean temperature and rainfall stats here.
Although February was wet it was relatively much dryer than January and calmer than the other two months. February often brings us our best snowfalls and coldest weather but this was completely absent this year, continuing the theme of a snowless December and January.
The water table appears to have come to the surface on Wanstead Flats
Some 69.9mm of rain (178% of average) fell in February – the wettest since 2010 – and 32nd wettest in the series back to 1797.
February was also warmer than average with a mean temperature of 7.5C (2.2C above the 30-year average) – ranking it 13th in the series since 1797 – and the warmest January since 2011. Though the month was very mild no single day was particularly mild. Highest maximum was 14.5C on the 24th.
The most notable day was a storm on the evening of Valentine’s Day into the 15th which saw yet more damage, resulting in two deaths including a man killed by a wave on a cruise ship in the Channel. A woman was killed when a 3ft by 3ft block of falling masonry crushed her car outside Holborn station.
Air frosts: 0 – very unusual for February
Ground frosts: 7
To view full stats follow this link: http://1drv.ms/1cBRoH3
Floods in Somerset have, up to now, seemed far removed from our own back yard. But with thousands of homes by the upper parts of the River Thames now at risk of flooding I wondered how safe we were from our own rivers.
A look back through the reference books show the geography of the Roding and Lea Valleys has made the area prone to inundations for hundreds of years.
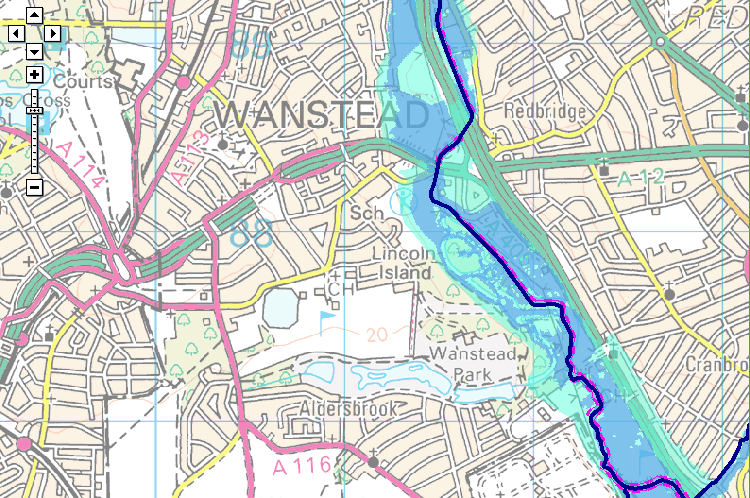
The Environment Agency’s Flood Map for Planning shows the flood zone risk of the area. And endorses Howard’s account that the river Lea was ‘a mile wide’ at its peak
In January 1809 the lower River Lea burst its banks in several places following a deluge that dumped two inches of rain in the space of 24 hours. The rain abruptly ended a snowy cold spell that had begun over a month before in the middle of December. From Luke Howard’s readings it is likely that up to half a metre of snow had fallen in the previous weeks in the upper parts of the surrounding countryside with only slight thawing. With the frozen ground unable to absorb any of the rapidly melting snow and rainfall the amount of water flowing downstream must have been immense. Howard takes up the story…
“The River Lea continued rising the whole of the 26th… The various channels by which it intersects this part of the country were united in one current above a mile in width which flowed with great impetuosity and did much damage.”
Howard, his chemical factory located on the banks of the river Lea close to what is now Bow flyover, wrote at length about the event, his account replacing the usual brief notes about daily weather in his book The Climate of London.
He talks of embanked pasture land being “filled to the depth of eight or nine feet” and people driven to their upper rooms relieved by boats plying under the windows.
The Environment Agency’s Flood Plan map of the Thames illustrates Howard’s comment that “the Thames was so full during this time that no tide was perceptible”
“The Thames was so full during this time that no tide was perceptible.” It took until February 23rd for things to return to normal.
Miraculously no lives were lost in the flood and cattle “by great exertions” were saved by being kept in their stalls. Howard, saying that the flood could have been far worse, believed a neap tide, strong westerly winds urging water down the Thames and mild weather helped avert a tragedy.
Howard’s statistics of the previous months show that the second half of 1808 were wetter than average – though not especially so. And nothing like the rainfall we have had this winter. From December 1st until February 8th Howard recorded 130mm of rain, which is about 100mm less than what I have recorded this winter.
This fact alone shows just how much the nature of the river has changed in the last 200-odd years thanks to spending on flood defences.
Work to improve the defences was prompted 67 years ago when similar catastrophic flooding came with the thaw that ended the severe winter of 1947, one of the coldest winters in recorded history and an episode remarkably similar to what Howard recorded in 1809.
Flood risk areas around the River Roding close to Wanstead are much smaller than the equivalent area in Lea Valley
The Lea Valley, along with many parts of the country, saw some of its worst flooding in a generation. The river burst its banks at several points bringing misery to surrounding communities. Valleys turned into lakes in 40 counties and East Anglia’s fens were a sandbagged inland sea. More than 100,000 properties were damaged and, then as now, heroic battles were fought by the military to keep water-pumping plants and power stations dry.
The sense of crisis was felt worldwide. Canada sent food parcels to stricken villages in Suffolk; the prime minister of Ontario even offered to help dish them out.
A marker of that flood, together with a history of flood defences, can be found here. There is also British Pathe footage of another flood between 1910 and 1919 here .
The River Lea Flood Relief Channel, that flows between Ware, Herts, and Stratford, took almost three decades to complete. The channel incorporates existing watercourses, lakes and new channels. Since it was completed in 1976, there have been no major flood events in the Lea Valley, although there have been three occasions when the river system was full virtually to its capacity: in 1987, 1993 and 2000. Since its completion, the level of protection afforded by the structure has declined, so that in some areas it offers 2 per cent protection, and in some, only 5 per cent protection. The Environment Agency published a strategic environmental assessment in 2008, which looked at ways to maintain the flood defences in the Lea Valley.
The water table appears to have come to the surface on Wanstead Flats
It remains to be seen whether we will see any flooding in Redbridge – a further 40mm of rain is forecast to fall up to Saturday morning. As well as the problem of rain there is also the issue of the water table which in the past week has risen to the surface in places. Inland lakes forming on Wanstead Flats have seen the cancellation of football fixtures and a couple of people I’ve spoken to say standing water has started to appear in their cellars
It is all too easy to blame the Environment Agency for the current flooding in Somerset and elsewhere but the meticulous planning by its forerunners brought, at least to date, an end to the widespread flooding problem in the Lea Valley.
As the government struggles to find a solution to the current problems with flooding it would do well to look to the grand schemes of the past and forget about any planned cuts to flood defences.
With flooding in the Somerset Levels dominating the headlines it is easy to get carried away with media hysteria that we are in unprecedented times in terms of rainfall. But as with so many media stories these days you don’t have to look far back in meteorological records to find that we’ve been here before.
The jetstream has been virtually ever present over the UK this winter, driving depression after depression over our isles
Although I base this blog on local figures – two series of stats going back to 1881 and 1959 – it is notable that this particular microclimate has actually been dryer than neighbouring areas, including east Essex where the rain crossing this area often peters out. With such power in the jet stream, however, bands of rain have been pushing right through this winter. Surrey has also been notably wetter, with orographic uplift only partly responsible for the increased wetness. Anyone driving around the M25 will have noticed the flooded fields at the side of the motorway.
It has been mentioned that this winter has been the most cyclonic in recent memory, but you only have to go back to the winter of 2000-01 to find a more cyclonic winter, though that season saw fewer severe gales.
Since the beginning of the meteorological winter on December 1st Wanstead has recorded 235.6mm of rain to February 6th. Considering the 1959 series that’s 7% wetter than the winter of 1989/90 – though this winter is actually 0.9C colder than that season 24 years ago.
Looking at the bigger picture, and with 22 days to go, this winter is currently 7th wettest in the series going back to 1881 – quite a way behind 1915 which saw 343.7mm recorded. Looking at the GFS model out to 9 days, however, there is much more rain to come.
The season so far, in terms of temperature and rainfall, has been notable in that autumn did not really offer any hints as to how winter would unfold. At the beginning of December I would have put the probability of a winter such as we have had so far at 10%. Should the rain continue to fall while the temperature stays mild the probability would fall to 1% – a truly exceptional winter in the same league as 1962/63 – but at the other end of the scale.
After my less than impressive stab at a winter forecast I am a bit loathe to make any more predictions. Trying to predict the weather more than a few days ahead with any detail is impossible. And seasonal forecasting is fraught with difficulty. However, precedent suggests we could be in for a warm and settled March. Indeed, if this year is anything like what followed in 1990 we could be in for a very nice summer. But then again we might not. As Mark Twain said: ‘Climate is what we expect; weather is what we get’.
Will it be a white Christmas this year? It’s the question most forecasters get asked year after year as the big day looms less than a month away.
The snow probably won’t arrive until after Christmas this year
It always fascinates me why Christmas and snow are so closely associated with each other when the odds, especially in London, are so stacked against it happening.
Perhaps it is the Christmas card scenes of Dickensian winters that get people yearning for the white stuff. Indeed, the image of snow covered cobbled streets can probably be blamed on Charles Dickens. The backdrop of A Christmas Carol, and a host of other books, were written when winters, and Yuletide, were generally much colder than they are now. Perhaps it was also the cold Decembers, which came during notably cold years as he was coming of age, that sowed the seed of his impressions of life in London. The Central England Temperature (CET) for December 1829 and 1830 were 1.4C and 1.8C respectively. To give you perspective the average mean temperature for the Wanstead region in December is 5.6C. Of course we had a taste of what a Dickensian December was like three years ago in 2010 when the average mean temperature was 1.5C. Though bear in mind the mean for 2010 was 10.5C – way above the 8.2C and 8.7C mean temps of 1829 and 1830!
Christmas toys of yesteryear also took every opportunity to perpetuate the snow myth
But back to this Christmas… First of all, what do we mean by a white Christmas? The definition used most widely – notably by the bookies – is for a single snowflake, even if it lands in the midst of heavy rain, to be observed falling in the 24 hours of 25 December at a specified location recognised by the Met Office. Interestingly, the Met Office uses weather observations from Gravesend-Broadness, some 12 miles away, to show current conditions in Wanstead. A lot, however, could be said by us weather anoraks about the different microclimates between here and south of the Thames.
Technically, there has not been a white Christmas in Wanstead for over 30 years. In 2010, we could still see the Christmas card Victorian snow scene in small patches of our gardens, but these were leftovers of a previous dump, so it doesn’t count. Frustratingly, there has been snow on several Boxing Days in Wanstead (1995 and 1996) and in the weeks running up to Christmas, but not on Christmas day itself. The most typical Wanstead Christmas day weather is mild and dry, although it has rained on 12 of the last 33 Christmas days.
So why does it often snow either side of Christmas but not on the actual day? For Wanstead, Christmas is at the beginning of the period when it’s likely to snow. Looking at climate history, wintry weather is more likely between January and March than December.
On average, snow or sleet falls in the UK 5 days in December, compared with 7.6 days in January, 6.8 days in February and 6 days in March. White Christmases were more frequent in the 18th and 19th centuries, even more so before the change of calendar in 1752, which effectively brought Christmas back by 12 days. Climate change has also brought higher average temperatures over land and sea and this generally reduces the chances of a white Christmas.
For snow to fall we need moisture in the atmosphere. Snowflakes start their lives as ice crystals thousands of feet up, and when these tiny ice crystals collide they stick together in clouds to become snowflakes. If enough ice crystals stick together, they’ll become heavy enough to fall to the ground.
Precipitation falls as snow when the air temperature is below 2°C. It is a myth that it needs to be below zero to snow. In fact, in this country, the heaviest snowfalls tend to occur when the air temperature is between zero and 2°C. The falling snow does begin to melt as soon as the temperature rises above freezing, but as the melting process begins, the air around the snowflake is cooled. If the temperature is warmer than 2 °C then the snowflake will melt and fall as sleet rather than snow, and if it’s warmer still, it will be rain.
It sounds a simple combination, but getting precipitation on the days when there are temperatures low enough for snow are few and far between.
Christmas day in Wanstead, on the balance of probability and from previous patterns, is most likely to be a green and mostly cloudy but dry one. Some brightness is possible with temperature peaking at around 10°C. You can read my full methodology on why I think this may happen here.
Though my attempt to find the probability of a White Christmas effectively rules one out, there is still an outside chance that one could happen.
At this time of year the UK can effectively become a battleground between cold polar continental air to the north or east and moisture-laden mild tropical maritime air to the south and west. Where these air masses meet, snow is possible, but a lot depends on which air mass wins the battle. When battleground situations occur, in one location it can be snowing, but just 20 miles or so down the road it can be raining. This is because there is a fine line between the boundary of the warm and cold air.
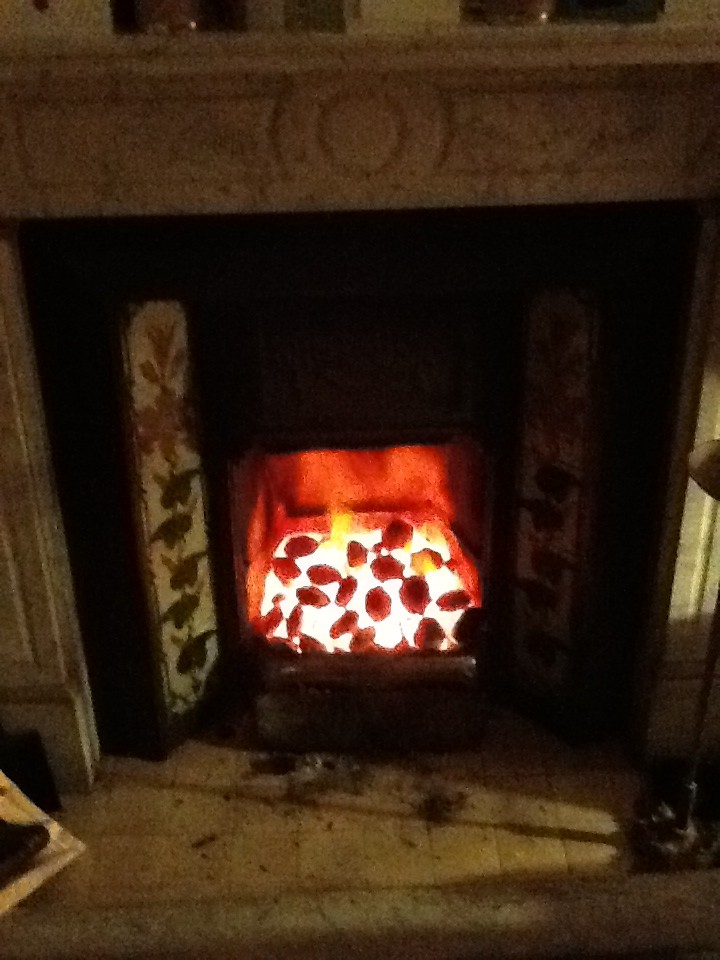
There’s nothing like an open coal fire. It’s even better when it is cold enough outside to have one
In years gone by, Wanstead and the surrounding area has often ended up in the cold air mass or the warm air mass. In these situations dry and mild or dry and cold weather is often the result. Of course, in a cold air mass situation there is always the chance of showery activity of the North Sea. The weather so far this winter has not been anything out of the ordinary, so I’m afraid there is nothing to suggest a white Christmas is likely.
If it does turn very cold on December 24, pray for clouds to appear and we could be in with a chance. But at the end of the day we still need that vital combination of temperature and moisture. Snow, like Christmas in that sense, requires some magic.
On looking at NOAA’s sea surface temperature anomaly in the North Atlantic tonight there seems to be a lot of orange (warmer than usual) off the coast of Ireland across the pond to the US.
A lot of energy therefore has to be displaced before we can start thinking about any sustained cold weather – and is a big part of the reason why the Atlantic has kicked back into life. The jet stream is centred over usExpect a succession of depressions, driven along by a brisk jet stream (currently right over us blowing at over 100knts) to whistle across us in the next 10 to 14 days bringing very mild temperatures together with a mix of rain, blustery winds and sunshine. Any HP ridges will probably be short-lived – though equally any rainfall should be average. In these situations most of the rain falls over western parts of the British Isles.
So, in summary, a changeable spell is coming up – just like autumn should be
One of the worst weather-related tragedies ever to hit the London area happened 86 years ago this month.
What started as a bright and sunny day in Valentines Park, Ilford, turned into disaster at ten minutes to five on Monday, 21 August 1939, when lightning struck a corrugated iron shelter where about 30 people, many of them children, had taken cover from a thunderstorm.
Seven people, including five adults and two children, were killed and 21 injured in the incident near an open air swimming pool where earlier families had been enjoying picnics.
The event was recorded in The Times the following day: “About 5 o’clock there was one final flash, followed by a deafening crash. Everyone in the shelter was thrown to the ground and rescuers who had heard the cries of the injured found them piled in a heap. One of the two women killed had most of her clothing torn off. A man was lying dead on the cross-bar of a cycle. A woman at the back of the shelter was lying unconcious with her arms round two screaming children.”
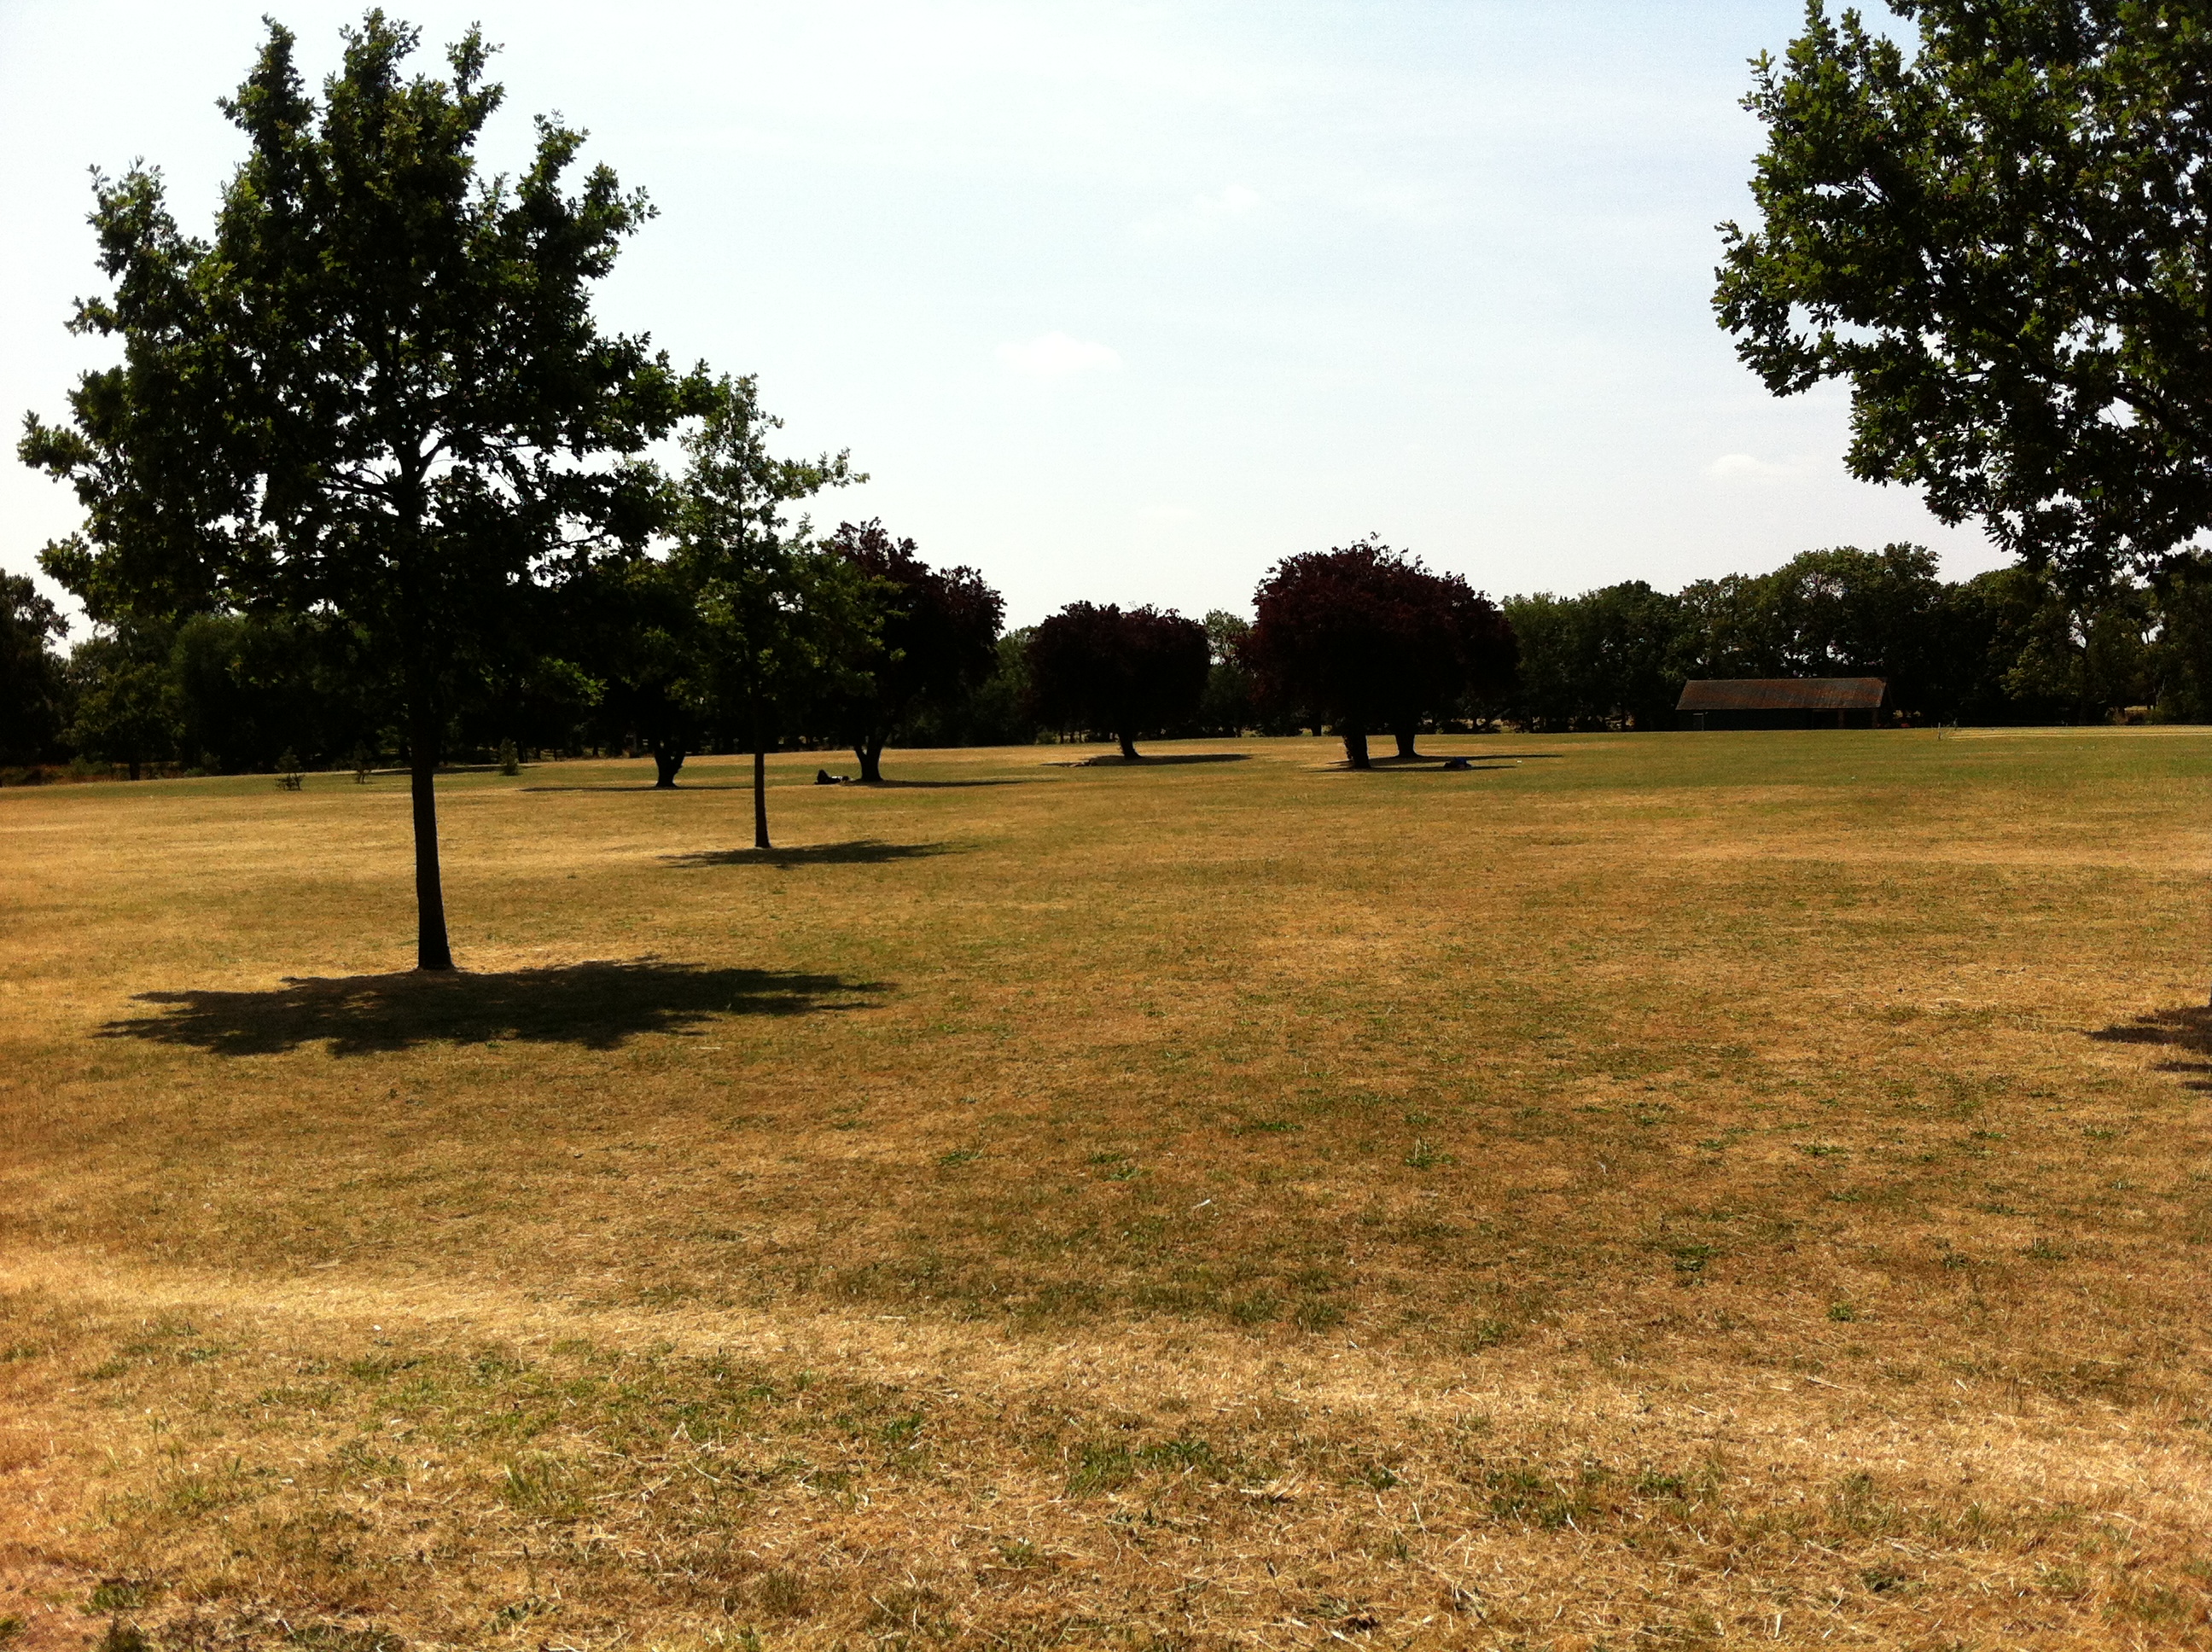
Looking south-east across the cricket pitches, and the site where the open-air swimming pool used to be, to where the tragedy is believed to have happened
A survivor of the tragedy, Mrs H. Treves, of Barkingside, told how she had gone to the park that day with her two daughters, June, three, and Shirley, seven, for a picnic. She told The Times: “Suddenly the storm broke, and we ran for the shelter. Inside there were about 30 people, and we were all huddled at the back away from the rain. I sat on a bench at the back of the shed with June in my arms and Shirley by my side. Suddenly I was flung from the bench. I must have been stunned for some minutes, because when I came to I found Shirley lying beside me and the ground heaped with people who seemed unconscious. I heard June whimpering, and eventually found her beneath three or four people. One of the men lying across her was dead. I escaped with only burns on my side. June had burns to her foot and Shirley burns on her shoulder and foot.”
One woman told how she had a lucky escape. Mrs A. Galey, of Ilford, said: “I stood in the shelter for about 20 minutes, and then something inside me urged me to leave. I had got about 50 yards when there was a flash and I felt numb. I turned around to go back to the shelter, and then saw all the people huddled on the ground. It looked like a battlefield”
Among the injured were a number of electrical workers who had been repairing a cable which ran through the 150-acre park. Neither the hut, which measured about 20ft by 12ft and had a sloping galvanised iron roof, or the two trees immediately behind it, were damaged.
The disaster was reported in the local paper The Recorder three days later
The local paper, The Recorder, reported the horrific scene that unfolded moments after the strike. It describes other park users frantically trying to help the stricken people in the shelter. One of the first on the scene was Mr A.B. Rowe, an A.R.P warden, from Romford. He said: “I was coming from the pool when a boy ran up and said ‘They have been struck’. I went over and found a heap of people, some terribly injured, in the shelter. During the war I saw some terrible sights, but none more horrible than this. Many were terribly burned and others were twisted into all kinds of positions and unable to move.”
Another helper was Mr H.G.B. Goater, of Eastern Avenue, Ilford. He had also been to the pool and was attracted to the scene by the screaming. “It was like a battlefield. I have seen nothing like it. The dead and injured were in a heap in the shelter.” Mr Goater spent several hours going back and forth to King George hospital with his car, first taking the injured for treatment and then waiting to take home some of those who were allowed to leave.
Among the dead was Dorothy Cribbett, of Capel Road, Forest Gate. She had taken shelter in the hut and was waiting for her 11-year-old daughter, Peggy, to join her when the lightning struck. Her grandson, Ian Braithwaite, 44, whom I managed to track down while researching this piece, takes up the story. “As my mother was making her way from the pool to the shelter lightning struck a bicycle that was leaning against the shelter – leading to the deaths of the people.”
Ian, who now lives in Auckland, New Zealand, commenting on the original article, said: “It makes for very grim reading and was far worse than I remember my mother ever talking about. I know my mother found my grandmother dead in the park and for anyone, let alone an 11-year-old to find someone in the condition that was reported must have been absolutely horrendous.”
He added: “It is one of those stories that you think must be made up, especially as I am drawing on childhood memories from over 20 years ago. Also my own mother died when I was 14 and I have no other known relatives from her side of the family. But I remember her telling me that is what happened.”
He continued: “It seems like it was a pretty miserable time for my mum back then. She was only 11 when her mother was killed and when the war started her father took her to Devon where he came from. In 1943 her grandfather was killed in a bombing raid on Torquay by the Germans. In the same raid a bomb was dropped on a nearby church killing 20 children at a Sunday school service. And we think we have it tough today.”
Ian has been trying to piece together memories of his mother and said: “I am hoping that someone may be able to give me more information surrounding this event or if anyone knew my grandmother or my mother. My grandfather’s name was Ernest Charles Cribbett.”
The synoptic chart from the Air Ministry (forerunner of the Met Office) for Monday, August 21, 1939
The violent storm, in what up to that point had been a mostly cool and changeable summer, brought flooding to areas around the town and several properties were struck by lightning. Whole chimney stacks were brought crashing to the ground when houses in Selborne Road and Courtland Avenue were hit. Another resident in Woodlands Avenue, Ilford, described the moment before their chimney stack crashed into their living room. “There was a blinding flash and a great crash. We thought the house was going to cave in on us: it seemed as though a bomb had dropped on it.”
The storm also affected the Barkingside area. As the rain fell in torrents a chimney stack on two houses in Tomswood Hill was struck by what an occupant of the house described as a “ball of fire that crashed on to the roof and came zig-zagging though the front room and out of the scullery door”.
Elsewhere in London severe flooding in Ealing is mentioned in The Times. And large hailstones were reported in Surrey.
Rainfall in thunderstorms varies greatly – and this storm was no exception. Met Office rainfall data from the day shows that Loxford Park, the closest rainfall station to Valentines Park about a mile to the south-east, recorded 30mm – almost double that of City of London Cemetery, just over 1.5 miles to the north-west of the storm’s centre, which recorded 15.7mm. In view of the rain and the lightning strikes which happened less than a mile away, across the River Roding, Wanstead had a lucky escape that day.
This selection of newspaper bills, produced by Mike Ashworth, shows a media fixated with build up to the start of WW2 while the Daily Sketch and Daily Mirror focused coverage on the horrifying event in Ilford
While researching this I found it strange that local memory of the incident is very vague. The oldest generation of my family, a few of whom lived off Ilford Lane, cannot recall the incident though I believe quite a few had already moved out of London as part of the evacuation before the Second World War. Perhaps it is also possible that while this incident by today’s standards is horrific it pales into comparison with what was to come just over a year later with the start of the Blitz in September 1940 – which would result in the loss of thousands of lives in the East End and across the UK.
The disaster in Valentines Park equalled the number of deaths of those under a tree on Wandsworth Common in 1914.
Other deaths caused by lighting in London include two women who were killed while walking in Hyde Park in September, 1999.
According to TORRO, the Tornado and Storm Research Organisation, about 30-60 people are struck by lightning each year in Britain of whom, on average, three may be killed. You can read further on lightning impacts and safety tips to avoid getting struck here. The Met Office also features a page of lightning advice.
I would like to thank Redbridge Central Library for their help in accessing the archives for this piece. And to Mike Ashworth who kindly gave permission to use the superb newspaper bills montage. You can see Mike’s work at his Flickr site. Thanks also to the Met Office.
St Swithun’s reputation as a weather saint is said to have arisen from the translation of his body from a lowly grave to its golden shrine within Winchester cathedral, having been delayed by incessant rain for 40 daysLegend has it that the weather on Monday will be the same for the next 40 days.
St Swithun’s day, if thou dost rain,
For forty days it will remain;
St Swithun’s day, if thou be fair,
For forty days ’twill rain na mair.
St Swithun’s Day is probably among the most well known of weather folklore – but, taken at face value, it is probably the most unreliable.
Since 1961 Wanstead has enjoyed 29 dry St Swithun’s Days (56%). From these the longest dry spell that followed was just 18 days, in 2000. On average, if St Swithun’s is dry, the weather stays fair for five days, with rain arriving on the 20th.
Another interesting observation is that the 40-day period that followed a dry St Swithun’s is on average 13% WETTER than if it rained on July 15th.
So what does this mean for the rest of July and the summer? Looking back at other years that have seen a dry and warm pattern in the run up to St Swithun’s Day we should see a continuation of the dry, warm and sunny conditions, perhaps with a thundery breakdown arriving on the 27th.
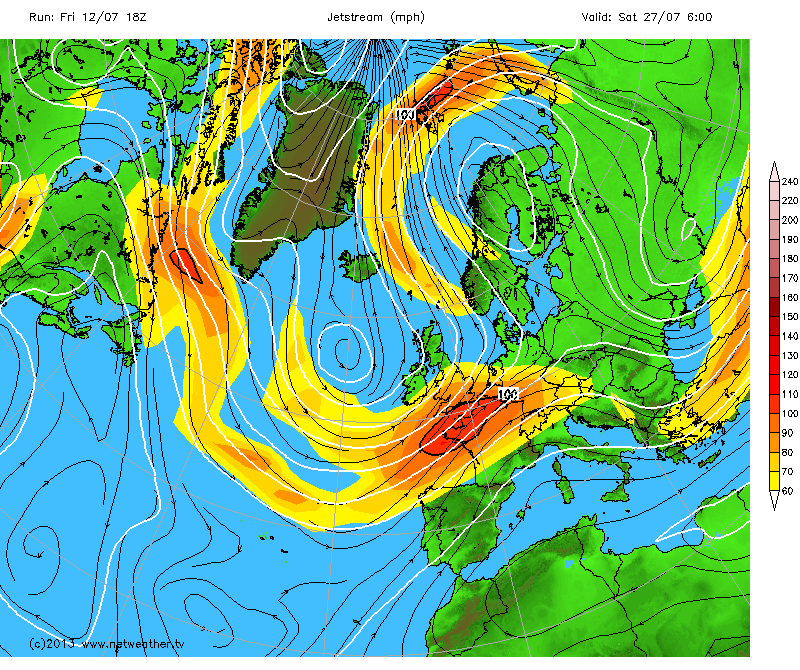
Putting superstition and singularities aside current weather models back this up, also suggesting an extended period of dry weather lasting well into July. However, the latest jet stream forecast this evening suggests a period of unsettled weather, ie rain, on… 27th. We shall see. The latest jet stream forecast on Friday, July 12, suggests that the jet will move south over the UK around the 27th
St Swithun was born around 800AD and died on July 2, 862, at Winchester, Hampshire. According to historians he was fond of building churches in places where there were none. St Swithun, who was bishop of Winchester, was buried in the churchyard of the Old Minster at Winchester, where passers by might tread on his grave and where the rain from the eaves might fall on it.
His reputation as a weather saint is said to have arisen from the translation of his body from this lowly grave to its golden shrine within the cathedral, having been delayed by incessant rain for 40 days.
The basis of the St Swithun’s saying follows the fact that by July 15th summer weather patterns are already well established and tend to persist through the coming weeks.
In meterological terms the position of the frontal zone around the end of June to early July, indicated by the position of the jet stream, determines the general weather patterns (hot, cold, dry, wet) for the rest of the summer. Like a little stream in its bed, the frontal zone tends to ‘dig in’ shortly after the summer solstice.
As the path of our weather systems is controlled by the jet stream, a more southerly location of the frontal zone – as happened last year – is likely to bring unsettled, wet and cool weather. On the other hand, a frontal zone shifted further to the north – as is happening this year – will help the Azores high to build over western Europe, thus bringing dry and pleasant weather to the UK.
Other western European countries also have similar St Swithun’s day sayings – that follow the principle rule. In France they say ‘Quand il pleut a la Saint Gervais Il pleut quarante jours apres’ – If it rains on St. Gervais’ day (July 19th), it will rain for fourty days afterward.
In Germany the Siebenschlaefer or seven sleepers day (July 7th, after the Gregorian calendar) refers to the weather patterns of the following seven weeks.
The next seven days look to be remaining cold, with a risk of snow at times. The temperature will struggle to get above freezing most days – maximums are likely to average 0.1c by the end of the week. Minimums are forecast to average -4.6C – so plenty of frost around again and some very low minima possible should any snow settle. Despite warnings to the contrary by the Met Office I am not expecting Friday / Saturday’s snow event to amount to much for our area – 5cm to 8cm at most – with all of the action well to the west of us and over high ground. There’s a chance that the front will fragment before reaching us – or even stalling over southern England before “pivoting” away into France. This scenario has happened many times before when we’ve had a “block” of very cold air to our east and north-east as we do now. Another event looks possible on Tuesday – but don’t be surprised if we see very little snow.
The past week, as discussed in the last bulletin, saw a change to progressively colder weather, the change being very marked last Wednesday with the appearance of the sun after days of cloud and gloom. The murk and cloud returned though it stayed cold, by Saturday with a chill east wind. Sunday failed to bring the predicted snow – the front just wasn’t powerful enough against the cold block to our east. However, Monday was different and snow began to fall around 5am on Monday, giving a 1cm covering. The track of the low saw a warm sector pass over up, raising the dew point and turning the snow to rain at low levels. Epping and areas of a similar height managed to remain snowy.
Mean temp: 1.2C; Mean min -0.8C (0.2c warmer than forecast), Mean max 3.1C (1.1c warmer than forecast),
lowest min -3.5C(15th), highest max 4.7C (3rd), total rain 3.9mm


You must be logged in to post a comment.