Tag Archives: wanstead

Will it be a white or green Christmas Day?

Over the next couple of weeks speculation on Christmas Day weather will inevitably build. Will Christmas be white or green?

Shoulder of Mutton lake, Wanstead PArk
Shoulder of Mutton pond, Wanstead Park

At this range it is impossible to tell from standard meteorological models though from the 15th, 10 days before the big day and when models can start to be relied upon for at least a general trend, the pieces of the weather jigsaw will start to fall into place.

Latest odds offered by bookies William Hill for a single snowflake at London Heathrow are currently 8-1, slightly longer than I’d expect at this time of year. With high pressure building and a general cooling trend this week I’d expect those odds to start to come down.

In terms of proper snow falling and settling, there has not been a white Christmas in Wanstead for over 30 years. In 2010, we could still see the Christmas card Victorian snow scene in small patches if our gardens, but these were leftovers of a previous dump, so it doesn’t count. Frustratingly, there has been snow on several Boxing Days in Wanstead (1995 and 1996) and in the weeks running up to Christmas, but not on Christmas day itself. The most typical Wanstead Christmas day weather is mild and dry, although it has rained on 12 of the last 33 Christmas days.

Tree damage by the war memorial in Wanstead High Street by Scott Whitehead
The period just before Christmas last year was very stormy

In an earlier blog I had a look at what the last 170 or so Christmas Days in London were like weatherwise and found that snow actually falling on the day is extremely rare. Since 1840 there have been just 19 occasions of snow or sleet falling on the capital on Christmas Day which equates to a probability of just under 11%. If you consider that the last ‘white Christmas’ (see note) was in 1996,  then we are well overdue one.

But the weather doesn’t adhere to human created calendars and behave like it should on any given day. But patterns in any given year can sometimes repeat though correctly predicting they will happen is more down to luck. Nevertheless I’ve had another look at my calculations for this winter and see if there is any way I can make a prediction for Christmas Day.

xmas day 2014
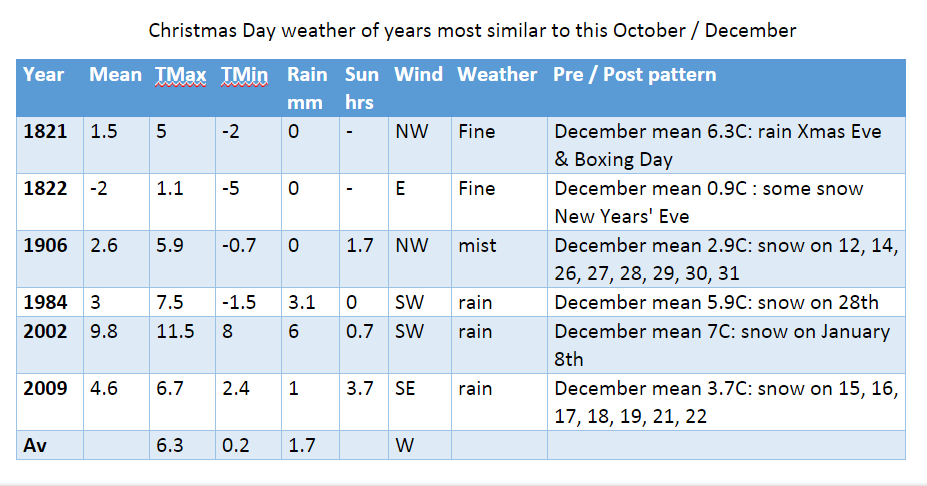
I firstly had a look at Christmas Day stats overall since 1840. The most common group of maxima in the series is 8.1C and above. This occurred 69 times or 40%. I then had a look at the years that most closely follow this October and November. None of the years saw a white Christmas, however it is interesting to note that five out of the six years saw some snow during the month. Snow often falls before and after Christmas. Why that is no-one knows.

So my guess for the weather on Christmas Day this year is for a maximum temperature of 6C after an overnight low of around 0C. With a little rain likely I suppose there is a chance of at least something sleety falling though I’d be surprised if, on Christmas Day morning, we pull back the curtains on a wintry Dickensian scene.

* The definition of a white Christmas used most widely – notably by the bookies – is for a single snowflake, even if it lands in the midst of heavy rain, to be observed falling in the 24 hours of 25 December at a specified location recognised by the Met Office.

** On average, snow or sleet falls in the UK 5 days in December, compared with 7.6 days in January, 6.8 days in February and 6 days in March. White Christmases were more frequent in the 18th and 19th centuries, even more so before the change of calendar in 1752, which effectively brought Christmas back by 12 days. Climate change has also brought higher average temperatures over land and sea and this generally reduces the chances of a white Christmas.

180 years of Christmas Day in London

Christmas in Victorian London is often portrayed as very cold and snowy – picture perfect images of Yuletides past always scream out at us every year we open a box of Christmas cards.

The Temple, Wanstead Park, always looks that much stunning with a covering of snow
The Temple, Wanstead Park, always looks that much more stunning with a covering of snow

But a look back through the meteorological records of the Royal Observatory at Greenwich reveals a very different reality.

The 1840s and 1850s, decades where most Christmas traditions marked today began, were often very mild, wet and windy – indeed before 2015 the warmest Christmas Day maximum temperature at Greenwich occurred in 1852 when the mercury reached 13.3C.

Like modern times, however, there were exceptions and 1840 was very cold – the record for Christmas Day mentions “trees coated with rime (ice) 3/8 inch thick”!

The following 20 years saw Christmas morning much milder – well over half had maxima of 6C or higher. In 1843, the year Charles Dickens first published A Christmas Carol and the public sent their first Christmas cards, the temperature reached a balmy 10.1C – though dense fog probably made it feel at least a bit more seasonal.

Frosted tree in Wanstead Park by Scott Whitehead
Frost is a common feature of Christmas Day

Four years later in 1847, the year the capital’s Tom Smith invented the Christmas cracker, things were a bit colder – a high of 4.2C and overcast with rain late evening. The following year an image of Victoria and Albert celebrating with their family around a Christmas tree appeared in the Illustrated London News. Like many things Royal down the years it really captured the public’s imagination of taking a spruce or similar evergreen into their living rooms and decorating it every Yuletide.

Christmas two years later, in 1849, was at least cold enough for something wintry to fall. London, however, was still coming to terms with its worst-ever cholera outbreak. With around 14,000 deaths from the disease Christmas was probably not a high priority that winter.

When Good King Wenceslas was first included in Carols for Christmas-Tide in 1853 the day was cold but there was still no “deep, crisp and even” snow or “rude wind’s wild lament”. The day stayed calm and clear.

OLYMPUS DIGITAL CAMERAThough the period either side of December 25th began to be marked with cold, snowy spells it would be another 11 years before London experienced its first official white Christmas in 1864. Sleet, which fell at the end of a 4-day cold spell, probably added to the drama of swimmers taking part in the first Christmas Day swim in the Serpentine, Hyde Park. With a high temperature of just 1.4C it’s quite feasible the few who braved it probably had to break the ice before they took the plunge.

Five years later London experienced another white Christmas with snow falling in a north-easterly breeze – the start of a four-day cold spell.

The joint-coldest Christmas Day on record followed in 1870 with a mean temperature of -7.2C. The building of the Royal Albert Hall was scheduled to be completed by December 25th but it was not until March 29th 1871 that it was officially opened by Queen Victoria.

The remainder of Victoria’s reign was marked with far more white Christmases, a period where nearly two-thirds of Decembers were marked with extended cold, snowy spells. Fog and frost were also frequent.

With a new century and new monarch Christmas-time turned milder and London would have to wait until close to the end of Edward VII’s reign in 1909 to see a ‘white Christmas’ – a poor affair with just a bit a sleet mixed in with the rain late morning. Many probably failed to notice it but it still counts as a white Christmas according to modern bookie’s standards.

Tree damage by the war memorial in Wanstead High Street by Scott Whitehead
Christmas Day can also be stormy

Four of the 26 Christmas Days of George V’s reign were white but the mean temperatures suggest they were all marginal affairs – the core cold weather happening either before or after the 25th. Of note also is the dominance of south-westerlies that brought mild and wet weather – nine out of ten Christmas Days in the 1920s saw rain falling – far in excess of the average for rain on Christmas Day which is 47 per cent.

Just one Christmas was white during George VI’s reign, a ‘good covering of snow’ was recorded by observers at Greenwich in 1938 – the snow falling at the end of a 7-day cold spell.

Sunshine was not a dominant feature of Christmas Day prior to Queen Elizabeth II coming to the throne – the average total in Greenwich from 1877 to 1951 was just under 0.8hrs. Yet the average sunshine total for Christmas Day for the first four years of Elizabeth’s reign jumped to 5.2 hours. The 6.5 hours on Christmas Day 1952 is a record that still stands today! It is remarkable that this record was set just over a fortnight after the Great Smog contributed to the deaths of 4,000 people though other studies put the figure at 12,000 people.

trees in fogThe Clean Air Act 1956 ironically saw the return of dull Christmas Days – though 1956 was a white Christmas with a light covering of snow and a maximum of zero Celsius.

White Christmas Days that followed included 1957 (showery sleet), 1964, 1968 (sleet), and 1970.

Christmas Day 1976 was the last time snow actually fell on Christmas Day in this area though, officially, the last white Christmas was 1996 when a few sleety flakes fell in the early morning.

Christmas Days since then have been mostly mild affairs in London. Of course we had a taste of what a Dickensian Christmas Day was like four years ago when the mean temperature for the day was -1.9C. There were still small patches of snow in our gardens but these were leftovers from a previous dump, so it doesn’t count as a white Christmas. Frustratingly, there has been snow on several Boxing Days in Wanstead (1995 and 1996) and in the weeks running up to Christmas, but not on Christmas day itself.

The warmest Christmas Day in this area occurred in 2015 when a maximum of 15.2C was recorded. Warm air sourced from off the west coast of Africa sent dew points soaring, the minimum on Christmas Day night into Boxing Day did not fall below 13.5C, another record.

25122015
The synoptic chart for 0000z Christmas Day 2015 shows ever-warmer air being pumped northwards over the British Isles.

It is surprising how varied the weather can be on Christmas Day – we always think that Yuletide in the ‘Olden Days’ was a cold affair but a look back to 1840 reveals there were times when it was just as mild as it has been in recent years.

1840 xmas

XMAS 1927
Christmas Day morning 1927: the wettest with some 24.9mm recorded

* Statistics for every Christmas Day since 1840 can be found here.

** The definition of a white Christmas used most widely – notably by the bookies – is for a single snowflake, even if it lands in the midst of heavy rain, to be observed falling in the 24 hours of 25 December at a specified location recognised by the Met Office.

*** In the past 170-odd years there has only been 19 white Christmases: in 1864 (sleet), 1869, 1876, 1878, 1884, 1895, 1909 (sleet), 1916, 1919, 1925, 1927, 1938, 1956, 1957 (sleet), 1964,  1968 (sleet), 1970, 1976, 1996 (sleet)

October 2014: warm but wet

Save for the warmest Hallowe’en on record and a notable depression on the 21st October was a relatively quiet month.

The month was warmer than average; the mean temperature of 13.7C was 1.9C above average, making it the 5th warmest October since 1797: 0.7C warmer than last October, though only the warmest since 2011.photo (7)

The dry and sunny start was replaced with a very unsettled regime at the end of the first week which lasted until the end of the second week – with 39.5mm of rain falling over the 12th and 13th, a notable total for this region. It was wetter than average: 82.4mm represents 123 per cent of what we’d expect to fall in a normal October.

Despite it being wet it was only the 74th wettest October in the series back to 1797.

The warmest day occurred on the 31st with 21.5C recorded. Many nights were warm with date records matched or broken. Cold nights, relative to the time of year were few. The lowest temperature occurred on 4th when the mercury fell to 2C – a ground frost was narrowly avoided with the grass minimum thermometer falling to 0.2C.

Sunshine was slightly below average with 103.6 hours recorded – that’s 97 per cent of mean. The sunniest day was on the 5th when 9 hours of sunshine were recorded.

To view full stats follow this link:http://1drv.ms/1kiTuzv


Wanstead hero fell victim to bad weather

One hundred years ago this week local newspapers were hailing the bravery of one of its residents who perished in the opening weeks of the Great War.

Claude Gould's obituary notice appeared in the October 30th 1914 edition of the Chelmsford Chronicle Image © Local World Limited. Image created courtesy of THE BRITISH LIBRARY BOARD
Claude Gould’s obituary notice appeared in the October 30th 1914 edition of the Chelmsford Chronicle
Image copyright of Local World Limited. Image created courtesy of  the British Library Board

Claude Gould died after the armored cruiser he was serving on, HMS Hogue, was torpedoed by a German U-boat during a naval engagement in the North Sea known as the Action of September 22nd 1914.  Two other cruisers were sunk, leading to the deaths of approximately 1,450 sailors.  The loss of the three ships remains the biggest maritime disaster in British naval history.

In the October 9th edition of the Essex County Chronicle Mr Gould, of Spratt Hall Road, was described as “a man of exceptionally fine physique, handsome presence, and frank, engaging manners”. The paper points out that he was the eldest son of George ‘Johnstone’ Gould, a “distinguished name in theatrical circles” in the West End and elsewhere.

Claude, who was Chief Yeoman of Signals, had been a member of the Royal Navy for 16 years and since 1912 had been stationed at Chatham, Kent, though he continued to spend most weekends in Wanstead before being mobilised at the beginning of August.

His abilities had been noted during his Naval manoeuvres and he had been recommended for appointment to the battleship Collingwood before he was lent to the Hogue when war broke out.

A survivor of the disaster noted Claude’s final act of bravery. As the ship sunk he was seen destroying his code-book to prevent it falling into the hands of the enemy.

This reanalysis chart shows the depression centred just off Denmark that brought gales in the North Sea, forcing naval destroyers away from escorting cruisers including Hogue
This reanalysis chart shows the depression centred just off Denmark that brought gales in the North Sea, forcing naval destroyers away from escorting cruisers including Hogue. The Air Ministry’s Daily Weather Report for September 17th reports SW’ly severe gale force 9 off Dungeness and Dover – the cause of the heavy seas that forced the destroyers to depart their patrol

Five days before the incident naval destroyers, which had been assigned to protect the cruisers as they patrolled the North Sea, were forced to depart by heavy weather, a blip in a month that overall was dry and bright. Had the weather been different the destroyers would have remained present and the ships would surely have not been such an easy target for the German submarine, the U-9.

The losses from the Action of September 22nd caused a public outcry, eroding confidence in the British government and damaging the reputation of the Royal Navy at a time when many countries were still considering which side in the war they might support.

.

Thunderstorms bring a Holyrood awakening

It was just before 3am that I was awoken by faint rumblings outside. I knew there was a risk of thunder before I’d retired to bed a few hours earlier but I’d discounted the risk along with any thoughts of staying up to watch the referendum results unfold in Scotland.

This radar shot shows the storm just beginning to hit Wanstead. The rain was far heavier to our east. 17.2mm was reported at Laindon, Essex. An observer at Woodford Wells recorded 19.9mm her in about 25 minutes 0310-0335 bst

Lightning then illuminated the room through the gaps in the curtains followed by more rumblings: it’ll pass, I thought. Crash – I grabbed my phone – was this an isolated event? The radar showed a line of slow moving storms moving up from the south. More lightning and loud thunder. My Twitter feed told me it wasn’t going too well for those wanting independence. At this point intensely bright lightning was rapidly followed by one of the loudest claps of thunder I’ve heard around 3.10am. Car alarms were set off – may as well get up I thought… The Inverclyde result was announced – ‘No’, by the narrowest of margins 50.1% to 49.9%. That’s it then, I thought. The lightning and thunder gradually began to fade away with hopes of an independent Scotland, on this night anyway. I glanced at my stats which seemed far less impressive than what was recorded elsewhere: 7.7mm, no big fall in temperature or pressure like previous storms during the summer.

Just a few hours later I walked my younger daughter into school, my bleary eyes struggling to focus – the humid and steamy atmosphere felt more like July than September. Indeed Thursday had been the warmest September 18th since 1997 which, strangely, was the same year that another momentous British event took place: the handover of Hong Kong to China. I remarked to a couple of parents that the only thing that had changed overnight was that Andy Murray will forever be the “Scottish” tennis player after his comment on Twitter.

The forecast advised that there was a continued threat of thunderstorms. It was humid but it didn’t ‘feel’ stormy – though around 2.30pm I could hear the beginning of faint rumblings in the distance.

Clouds above could be seen developing rapidly at 2.30pm

I left for work on my scooter at 3pm, carefully watching the sky for any developments all of which seemed to be in the distance. After stopping for petrol in Leytonstone High Road huge drops of rain began splattering the pavement. They were few and far between, however, and the sun defiantly continued to shine. After riding past Stratford I suddenly became aware that the buildings in the distance, past Bow flyover, were gradually beginning to disappear. I pulled in to a turning where Gala Bingo is situated. An electronic noticeboard enquired: “Do you feel lucky?” Not today I thought and retrieved my overtrousers that live under the seat, hastily pulling them on as I watched the impending storm begin to close in.

I continued on and was soon enveloped in the full force of another thunderstorm. Marble-sized hail clattered off my crash helmet while dangerous gusts, caused by wind funneling through the new high rise flats by the Olympic Park, did their best to push me off. Just as I crossed the canal a sheet of rain engulfed me and the drivers to my right. The road in front suddenly turned into a shallow river. I usually ride over the flyover – not today with the torrent of water cascading off the sides.

The 3.15pm storm that flooded large parts of East London. The white area shows where the heaviest rain was

By the time I reached Mile End the rain had almost stopped. The City looked fairly dry and on reaching London Bridge the roads were completely dry. The Friday crowds were out in force in Borough Market, enjoying the sunshine and seemingly oblivious to the chaos unfolding just a few miles away in East London. Within 10 minutes of walking into my office Alex Salmond announced his resignation. Another storm: another momentous event! It was another of those coincidental storms that, in my mind, seem to mark momentous events such as the Royal birth last July

I checked the stats of the storm back in Wanstead: 24.5mm  fell  with a peak rate of 76.5mm/hr at 15.47. The storm ended a run of 16 dry days bringing the total for the month up to 33mm – the 24hr total was 30.5mm. The explosive convection of this storm can be seen here. The associated hail and rain brought much flooding to Hackney, Hackney Wick and Leytonstone. This storm seemed to be the result of a convergence line over London between light southerlies to the south and easterlies to the north – the heavy rain was very localised.

Flooding images can be seen on the following links at Dalston, Wanstead Flats, Leytonstone Station, Wick Road. A short clip of flooding at Wick Road can be seen here.

The flooding wasn’t restricted to East London. In Southend water started pouring through the roof of the Dixons theatre though it failed to stop the performance. Shops in London Road were inundated.

http://www.echo-news.co.uk/news/11486080.Fire_crews_receive_100_calls_as_severe_flooding_hits_Southend/

See also:

http://www.echo-news.co.uk/news/local_news/11353521.FLOODING_CHAOS___Southend_Hospital_A_E_evacuated_as_south_Essex_is_battered_by_downpour/?ref=var_0

http://www.echo-news.co.uk/news/11486049.Updated__Flash_flooding_hits_homes_and_businesses/?ref=var_0


August 2014 – cool, wet and dull

Anyone hoping for a continuation of June and July’s hot weather would have been left sorely disappointed by last month which was characterised by frequent rain and the coldest August night for over 20 years.

A stunning example of sunlight illuminating the underside of cloud at sunset was seen mid-month

August 2014 was the first month this year to be cooler than average; the mean temperature of 17.2C was 1C below average, making it the 89th warmest August since 1797: 1.6C cooler than last August, the coolest for 7 years.

The month was marked with thunderstorms and heavy downpours, contributing to what was a much wetter than average month – some 76mm fell which is 152% of the monthly average and the wettest for 4 years.

The hottest day occurred on the 7th with 27.3C recorded – nothing special for August and a date that heralded the end of the hot spell during June and July.

A couple of nights were notably cool for August: 5C was recorded during the early hours of the 23rd – the coldest August night since 1993.

Sunshine was below average with 161 hours recorded – that’s 83 per cent of mean. The sunniest day was on the 3rd when 12 hours of sunshine were recorded. Throughout the month there were just 2 days with 10 hours or more of sunshine. There were 4 days with thunder recorded – the average for August is 3.

To view full stats follow this link:http://1drv.ms/1kiTuzv

Looking further afield there were many thunderstorms around the UK though many places missed out on the big downpours. It was yet another month where rainfall totals could vary greatly in the space of just a few miles.

On the 9th a station in Woodford Green recorded 24.4mm, double what fell in Wanstead. The legacy of TS Bertha coincided with the end of our extended hot spell – an excellent analysis of this storm can be found here.

There were some spectacular cloud formations not far from here. A particularly good one was seen in Witham. 

Squally storm line approaching Witham, panoramic shot!

Prolonged heavy rain on the 11th caused extensive flooding in Scotland.

On the 14th ‘Biblical’ flooding affected Lewisham in south east London.

On 25th a perfect curl could be seen on a depression centred off the west coast of Irleland. The rain associated with this low pressure brought the month's highest daily rainfall total: 23.4mm (the system bringing 27.5mm) - a thoroughly miserable Bank Holiday Monday where it rained ALL day, from 6am until 9.30pm. It was yet another example of how much even frontal rainfall can vary over a small area.
On 25th a perfect curl could be seen on a depression centred off the west coast of Irleland. The rain associated with this low pressure brought the month’s highest daily rainfall total: 23.4mm (the system bringing 27.5mm) – a thoroughly miserable Bank Holiday Monday where it rained ALL day, from 6am until 9.30pm. It was yet another example of how much even frontal rainfall can vary over a small area.

On 25th a perfect curl could be seen on a depression centred off the west coast of Irleland. The rain associated with this low pressure brought the month’s highest daily rainfall total: 23.4mm (the system bringing 27.5mm) – a thoroughly miserable Bank Holiday Monday where it rained ALL day, from 6am until 9.30pm. It was yet another example of how much even frontal rainfall can vary over a small area with St James Park recording 38.2mm. The top 30 totals for that day can be seen here.

sunset overlooking Wanstead Flats 2nd August

Looking even further afield four people were killed in a flash flood at an Italian festival early on in the month.


July 2014 – warm and wet on paper

July 2014 was yet another milder than normal month; the mean temperature of 20.2C was 1.7C above average, making it the 9th warmest July since 1797 – and 0.5C cooler than last July.

The month was marked with spectacular thunderstorms and torrential downpours, contributing to what was a much wetter than average month – some 73mm fell which is 168% of the monthly average. While on paper the month looks very wet it should be noted that 52% of the July total fell in two episodes: a stalling warm front on the 10th and a cloudburst on 25th. I was away for the thunderstorm though a friend remarked that the roads close to Redbridge Roundabout were like torrents, the rain was so intense for a short period. I’ve put together a series of radar images that show the evolution of the storm, together with graphs, that can be accessed here.

The hottest day was July 18th with 32.7C recorded. There were 12 occasions where the mercury reached or exceeded 80F – pretty respectable though last July saw that figure reached on 20 days!

The sunniest day was on the 3rd when 15 hours of sunshine were recorded. Throughout the month there were 11 days with 10 hours or more of sunshine. There were also 5 days with thunder recorded – the average for July is 3.

Looking further afield there were many thunderstorms around the UK though many places missed out on the big downpours. Perhaps the most impressive was the development of the MCS that moved up from France during the evening of July 18th. There were numerous superb pictures but my favourite is probably this shot taken by Richard Dixon in Whitstable, Kent. It shows, perfectly, the contrast betweeen the bright orange sunset and the impending doom of the approaching MCS from the continent.

shot taken by Richard Dixon in Whitstable, Kent. It shows, perfectly, the contrast betweeen the bright orange sunset and the impending doom of the approaching MCS from the continent
This shot was taken by Richard Dixon in Whitstable, Kent. It shows, perfectly, the contrast betweeen the bright orange sunset and the impending doom of the approaching MCS from the continent

A thunderstorm on Sunday, July 20th, saw three inches of rain fall on Canvey Island in a very short space of time. A good round up of events, including pictures, can be seen here. The thunderstorm on 25th was felt across London and the Home Counties – there’s an excellent picture of the approaching shelf cloud here. Brighton was rudely awoken by a storm on  28th by a slow-moving thunderstorm.

It is a typical feature of summer that rainfall can vary a great deal across a small area. The nearest official station to Wanstead, St James’s Park 8.4 miles to our south-west, recorded recorded just 25.9mm – 35% of what fell here.

The nights were mostly warm – the 14.8C average is higher than last July.

Overall July was a superb summer month – sunshine, heat, thunderstorms in abundance.

Sunset on 31st looking across Wanstead Flats. July was a classic summer month for weather

To view full stats follow this link:http://1drv.ms/1kiTuzv


Overnight storms of July 18th 2014

I’ve decided to cobble together a few lines on last night’s notable thunderstorms which reminded me so much of the stormy nights on the 1980s.

The radar at 3am, produced by the excellent Hone and Dry, revealed that the storm's rainfall was quite widespread. The white areas show the most intense rainfall
The radar at 3am, produced by the excellent Home and Dry, revealed that the storm’s rainfall was quite widespread. The white areas show the most intense rainfall

After writing off the risk of storms for our area last night I was awoken at 3am by loud, rumbling thunder – the kind that seems to resonate all around you. A quick look on the radar revealed quite a widespread thunderstorm, quite different from the smaller, more intense one that woke up most of Wanstead on July 23rd last year.

On viewing the live lightning map at 3.10am it became clear that this was no flash in the pan. Further rumbles and strikes had me leaping out of bed to monitor the station. EssexWeather reported 1809 lightning strikes in two hours for our region.

And on viewing the pressure graph the first storm saw a 6mb fall in pressure in a matter of minutes.

A second storm around 5.30am was less severe though still notable. The 9.4mm that the weather station recorded fell at a rate of 45mm/hr at 3am and 40mm/hr at 5.15am. Though the AWS is often out in heavy rainfall situations on this occasion it was more or less spot on – my 10am reading of my traditional 5″ raingauge revealed the official total to be 9.3mm. The rain took the July  total to 108% of the 1981-2010 mean.

And a squall that blew through just before 4am is well portrayed on this wind graph.

So, all in all, a really lively sticky night where the temperature didn’t fall below 18.2C. I didn’t manage to get any of  my own pictures but this one by @justinstokes on Twitter caught my eye.

According to the CAPE / lifted index further storms seem likely tonight. Indeed the situation across the Channel could be dire. It is probable a few will trundle their way across the sea to give us another sleepless night…
lightning canary wharf

This wind graph shows a gust of 22.8mph at 0336z in my sheltered garden
Radar at 0519 shows another white blob (very heavy rain) about to cross Wanstead


This pressure trace shows the fall in pressure of the two thunderstorms that crossed our region
Live lightning map from http://www.lightningmaps.org/realtime at 3.10am

A dry or wet St Swithun’s?

St Swithun's reputation as a weather saint is said to have arisen from the translation of his body from a lowly grave to its golden shrine within Winchester cathedral, having been delayed by incessant rain for 40 days
St Swithun’s reputation as a weather saint is said to have arisen from the translation of his body from a lowly grave to its golden shrine within Winchester cathedral, having been delayed by incessant rain for 40 days

Legend has it that the weather on Monday will be the same for the next 40 days.

St Swithun’s day, if thou dost rain,
For forty days it will remain;
St Swithun’s day, if thou be fair,
For forty days ’twill rain na mair.

St Swithun’s Day is probably among the most well known of weather folklore – but, taken at face value, it is probably the most unreliable.

Since 1961 Wanstead has enjoyed 30 dry St Swithun’s Days (57%). From these the longest dry spell that followed was just 18 days, in 2000. On average, if St Swithun’s is dry, the weather stays fair for five days, with rain arriving on the 20th.

Another interesting observation is that the 40-day period that followed a dry St Swithun’s is on average 13% WETTER than if it rained on July 15th.

So what does this mean for the rest of July and the summer? Looking back at other years that have seen a mostly dry and warm pattern in the run up to St Swithun’s Day we should see a continuation of the mostly dry, warm and sunny conditions, perhaps with frequent thundery breakdowns, the first arriving on Thursday into Friday.

Putting superstition and singularities aside current weather models back this up.

Featured Image -- 1745St Swithun was born around 800AD and died on July 2, 862, at Winchester, Hampshire. According to historians he was fond of building churches in places where there were none. St Swithun, who was bishop of Winchester, was buried in the churchyard of the Old Minster at Winchester, where passers by might tread on his grave and where the rain from the eaves might fall on it.

His reputation as a weather saint is said to have arisen from the translation of his body from this lowly grave to its golden shrine within the cathedral, having been delayed by incessant rain for 40 days.

The basis of the St Swithun’s saying follows the fact that by July 15th summer weather patterns are already well established and tend to persist through the coming weeks.

In meterological terms the position of the frontal zone around the end of June to early July, indicated by the position of the jet stream, determines the general weather patterns (hot, cold, dry, wet) for the rest of the summer. Like a little stream in its bed, the frontal zone tends to ‘dig in’ shortly after the summer solstice.

As the path of our weather systems is controlled by the jet stream, a more southerly location of the frontal zone – as happened last year – is likely to bring unsettled, wet and cool weather. On the other hand, a frontal zone shifted further to the north – as is happening this year – will help the Azores high to build over western Europe, thus bringing dry and pleasant weather to the UK.

Other western European countries also have similar St Swithun’s day sayings – that follow the principle rule. In France they say ‘Quand il pleut a la Saint Gervais Il pleut quarante jours apres’ – If it rains on St. Gervais’ day (July 19th), it will rain for fourty days afterward.
In Germany the Siebenschlaefer or seven sleepers day (July 7th, after the Gregorian calendar) refers to the weather patterns of the following seven weeks.

June 2014: warm and dry

June 2014 continued this year’s theme of being milder than normal; the mean temperature of 17.1C was 1C above average, making it the 22nd warmest June since 1797.

little fluffy clouds
June was marked by some spectacular cloudscapes and sunsets. This was the view across Wanstead Flats from Centre Road looking toward Ilford on the 21st

June, like  March and April, was dryer than average with just 15.2mm of rain, that’s just under 30 per cent of average.

The driest June since 2000 started off unsettled with frequent rain – 6mm falling on the 3rd. The following day was cool with the temperature reaching just 16.2C.

Though there were nine days when over 10 hours of sunshine was recorded the magic 80F was surpassed just once: on the 9th when 27.5C was reached under 6 hours of sunshine. This sunniest day was the 10th when 14 hours of sunshine nudged the thermometer to 24.5C. Overall there were 214.1 hours of sunshine – that’s 120% of average, the sunniest since 2011.

On many days during June, including the 30th shown here, the sky turned dark but just spits and spots of rain were often produced

Despite plenty of potential no incidents of thunder were recorded – the much-hyped weekend of the 7th / 8th saw less than 2mm of rain – all of the action staying well to our east in the France, Germany and the Low Countries. Further thundery potential on the 13th failed to produce anything in this area though a disturbance over Berkshire saw thunderstorms develop in the Oxford, Reading, Basingstoke and Wokingham region, with up to 38mm of rain falling over a wide area.

It is a typical feature of summer that rainfall can vary a great deal across a small area. The nearest official station to Wanstead, St James’s Park 8.4 miles to our south-west, recorded 33.8mm – more than double what fell here.

Some nights were chilly when the sky cleared but there was no air frost or ground frost.

To view full stats follow this link:http://1drv.ms/1kiTuzv

Yet another occasion of impressive cloud formation during June included this example of late evening cirrus. The formation, seen at ground level, seemed similar to a display of the Aurora
Circumhorizontal arc over Aldersbrook