With all the snow falling in Austria I noticed that next month is the 20th anniversary of the Galtür avalanche that left 31 dead, 26 injured and left a trail of devastation.
The avalanche was considered the worst in 40 years. Three weather systems originating from the Atlantic accounted for large snowfalls up to 4m deep. Freeze-thaw conditions created a weak layer on top of an existing snowpack; further snow then settled. This, together with high wind speeds, created large drifts and caused roughly 170,000 tons of snow to be deposited.
Even more snow is expected in this and surrounding regions.
The extreme amounts will fall mostly on the north of the range with very little on the south side, more or less the opposite of what happened last year.
Of course Alpine snowfall, from year to year, has always varied greatly as this study of San Bernadino shows.
The Alpine snowfall season finished just below average in the Splügen area of the Swiss Alps. Abnormally warm weather after decent snowfalls in February and March curtailed the season; mean temperatures finished over a degree warmer than average between November and April.
The figures make depressing reading for anyone who enjoys winter sports and come after a study suggested that bare Alpine slopes could become a much more common sight in the future.
I first visited this area of the Alps in 1981, returning most February half-terms, apart from 1989 when the snows failed to arrive until after Easter. The season that hastened the installation of artificial snowmaking in resorts across Europe has always left me wondering just how much snowfall has varied.
Using San Bernardino, a village at 1636m in the southwest of Grisons canton, I had a look at temperature and rainfall data back to 1999 to see what patterns were present. The figures confirm that some years see metres fall while others have barely enough to cover the pistes.
Temperatures, meanwhile, show a general upward tick from 2005-06.
While the above graphs show typical variability they don’t reveal much about month to month conditions.
Closer scrutiny of the data shows that early season dumps of over 30cm, the kind that really get the snow bases going and keep the earth below chilled for a long season, are becoming rarer. Indeed, apart from a blip in 2013/14 there have been no big early season dumps since 2009/10. The seasons are taking much longer to get going.
As the second graph shows big dumps of snow are happening later in the season. If there is not already a decent snow base these snowfalls can thaw much faster because spring sunshine has already warmed the ground.
Another way of trying to find how the climate has changed is to look at how many ‘ice days’ there were in a given period – ice days are when the maximum temperature reaches -0.1C or lower over 24hrs.
The graph below shows the past three years have been fairly constant though this season’s total of 83 is 37 days fewer than the highest total in the series, 2005-06 which clocked up 119 days.
I’ve visited many resorts in the Alps which, obviously, will be affected differently by the changing climate – the range of microclimates in the Alps is staggering.
In conclusion, considering the data and my experience, I’d say that though the Alps have definitely warmed the variability and ebb and flow of the climate means it is impossible to say with confidence that by the end of this century the slopes won’t be covered in the white stuff.
I chose San Bernardino because it is fairly central in the entire Alpine range and is also the most local SYNOP station I can find to the Valtellina range that I have been visiting most years since 1981. Any climatologists reading this would point out that my data range does not stretch back the necessary 30 years to make a judgment on the stats. If anyone can point me to a site that offers data back to 1980 I would happily update my figures and graphs.
My trip this year to Madesimo, 8 miles as the crow flies from San Bernardino, was timed just right for a dump of snow in February that followed weeks of dry weather.
Temperature inversions were seen in February (above). Snow was only deep enough to descend Madesimo’s Canelone run, reached by the Groppera lift to 3,000m once February snows had arrived
The area has enjoyed some epic snowfalls over the years including 2013/14 when many found themselves snowed-in following a 2m dump of snow. The first of many snowfalls during what was an epic season.
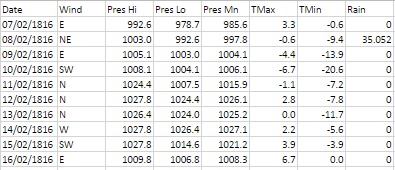
During the opening months frequent cold blasts brought much wintry weather. Cold weather at the end of January turned severe during the second week of February.
In the early hours of the 7th heavy snow, driven by gale-force north-easterly winds, brought some of the worst winter weather this area has ever seen. Some 35mm of precipitation is recorded on the 8th – this would normally give at least one foot of level snow that could obviously be whipped up into huge drifts.
Luke Howard described the scene in his diary entry saying the abundance of snow “loaded the trees to their tops and weighed down the smaller shrubs to the ground.”
The snow and polar continental air also produced perfect conditions for a textbook radiative cooling night within two days of the snowfall. The minimum recorded on the morning of the 10th: -20.6C has not, as far as I can tell, been repeated since.
To put that into perspective the lowest minimum of the severe winter of 1963 for this area was -12.2C recorded at Greenwich on January 21st. The coldest night I have personally recorded was -10.3C on January 12th 1987.
Howard, who would have taken readings at his laboratory in Stratford and home in Tottenham, remarked on the rare occurrence of the cold and said that the thermometer had remained below 0F (-17.8C) for a number of hours: “an occasion that happened less than five times within a century – the last appearing to be 19 years previous.”
Howard’s theory of the day was that such extremes didn’t occur during long continued frosts but rather at an interval of one winter after such a season. He mentions the frost of 1794-95, which lasted 44 days, immediately before which the thermometer fell to -2F. The following year a low temperature of -6.5F was recorded. The year 1816 followed the cold winter of 1813/14 – the same pattern, so Howard was prepared for the night of February 9th 1816.
Modern climatologists tend to discount these old records by arguing that standard conditions set by the World Meteorological Organisation were not met. However, Howard backs up his findings with a very thorough explanation of how he went about measuring the record low temperature that followed a freezing day where the maximum thermometer didn’t rise above -6.7C.
“Early in the evening on trying the experiment of placing a wet finger on the iron railing it was found to adhere immediately and strongly to the iron. I exposed several thermometers in different situations.
“At 8 pm, a quicksilver thermometer with the bulb supported a little above the snow stood at 0F. At 11pm a spirit thermometer in the same position indicated -4F, the former which had a pretty large bulb had not sunk below -3F. At 7.30am the 10th a quicksilver and a spirit thermometer hung overnight about 8ft above the ground indicated respectively -3F and were evidently rising.
“The thermometer near the surface of the snow had fallen to 5F and probably lower, but at the usual height from the ground of my standard thermometer the temperature was at no time below -5F. The exposure is north and very open.”
Howard goes on to describe the following day:
“From 8am the thermometer continued to rise steadily at noon a temperature of 25F was pleasant by contrast to the feeling and it was easy to keep warm in walking without an upper coat. Even at 0F, however, the first impression of the air on the skin was not disagreeable; the dryness and stillness greatly tending to prevent that sudden abstraction of heat which is felt in moist and quickly flowing air.
“Early in the afternoon the wind changed all at once to SW some large cirri which had appeared all day passed to cirrocumulus and cirrostratus with obscurity to the south. I now confidently expected rain as had happened in former instances but was deceived and the thaw took place with a dry air for the most part and with several interruptions by night.
As often happens with severe cold snaps Howard reported on the 17th that the snow “was mostly gone but very thick ice remains on ponds”; a period of just over a week.
The cold snap saw the mean temperature for February 1816 over three degrees colder than average at 0.8C.
Such extreme temperatures are rare in the capital though not unheard of. I know that there have been cases of sub -20C readings in, for example, the Rickmansworth frost hollow and Ian Currie’s Chipstead Valley, but I have never seen anything so low in east London. Could it be repeated again? Possibly, but like 1816, the synoptics would have to be absolutely perfect for it to happen.
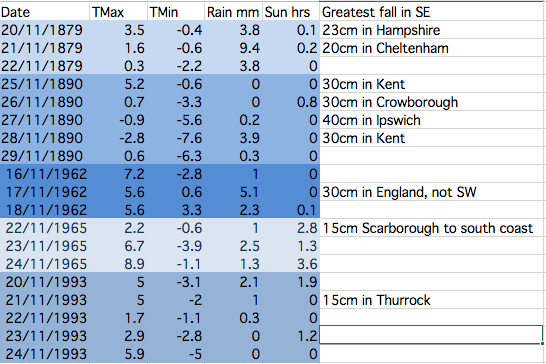
This table shows the stats for Greenwich during spells when there has been heavy snowfall somewhere in the south-east. The figures reveal that it is very hit and miss and that the associated air doesn’t stay cold for long. There is a link to UK-wide November snowfalls here: http://1drv.ms/1PjOB9H
November has produced some potent snowfalls in Scotland and northern England over the past 150 years. These brief shots of cold air, often direct from the North Pole, however very rarely produce anything that can sustain long-lasting low-level snow in London and the Home Counties.
With the GFS weather model occasionally hinting at a blast of polar maritime air I decided to have a look back through the records to see how frequently the capital has turned white during the eleventh month.
Anyone who is familiar with the Objective Lamb Weather Type (LWT) data series will know that there may be an increased likelihood of things turning colder at some point this month. Last month was the joint 5th most anticyclonic October in the LWT series data series that runs from 1871; resulting stats closely resemble both October 1946 and 1962 as being very anticyclonic. Another similar year is 1972.
November 1972 was mild till mid month and then turned much colder with snow in places. November 1962 was cyclonic till the 24th, and then anticyclonic, with a cold northerly outbreak from the 18th for a few days with snow, before turning rather mild. November 1946 in complete contrast to both years, was a mild, dull and very wet month.
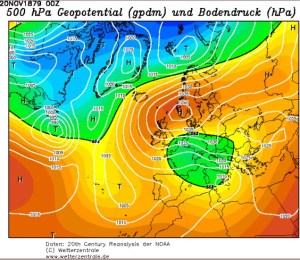
The most impressive November snowy spells seem to have occurred in the late 1800s. These two 500mb reanalysis charts show a cold feed from Scandinavia in both cases.
Snow and sleet falling in the London area is obviously much more common than snow lying. The snowiest Novembers were in 1919 and 1952 when snow or sleet fell for 10 days at Wallington and Hampstead respectively.
Kew saw snow or sleet on 8 days in 1919, while Heathrow and Northolt recorded snow or sleet on eight days in 1952.
This small article appeared on the front page of Reynold’s Newspaper in November 1890
The only decent snowfall that occured in London in my lifetime was November 1993 – and I was abroad for that. I remember my dad mentioning it in a letter written to me as I travelled round China. It arrived in the early hours of one Sunday morning and fell to a depth of five inches.
Given that was the last time London saw a decent fall I won’t be holding my breath that we’ll see any this month – though, if you live in Scotland, the odds are much narrower.
Before 1861 information on snowfalls becomes scarce – at least in terms of correct quantity. However, heavy snowfalls obviously did occur. On November 17, 1816, the Inverness Journal contained this report:
“The winter has commenced with a severity almost beyond example. Frost, rain and snow have been almost incessant during the last week and the greater proportion of corn still uncut or in stocks has suffered material injury.
“We regret to say that several lives have been lost. A postboy of Bennet’s coming from the south was obliged to leave his chaise on the road and would have been lost but for the lights shown from the windows of Moyhall which he reached nearly in a frozen state. The obvious advantage of keeping lights in stormy nights in the windows of houses in the country has thus been illustrated
“The winter it appears has set in with extreme severity in the interior of the continent. At Augsburg on the 19th of November the eclipse of the sun was entirely obscured by a fall of snow which commenced at 7 o’clock in the morning and lasted till noon. The ground was covered with snow a foot in depth. There was a great fall of snow at Frankfurt on the same day and Reaumur’s thermometer showed at from 9 to 10 degrees below the freezing point.”
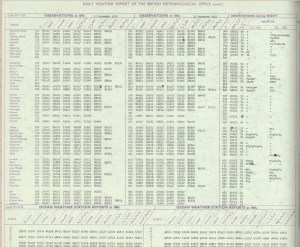
Perhaps the most impressive, modern day snowfall in the south of the UK occurred around November 18th 1972 when observers recorded 60cm of snow on Dartmoor. Synoptic charts and other data are attached below.
Image courtesy of the Met Office
Image courtesy of the Met Office
Image courtesy of the Met Office
Image courtesy of the Met Office
Inspiration for this piece came from Dr Richard Wild’s PhD study on snowfall which you can find here.
For anyone who likes cold weather it has been a dreadful winter so far with no snow falling or lying in this part of Britain.
An inversion during the first half of December saw the edges of ponds in Wanstead Park begin to ice up
A very mobile synoptic regime has seen numerous vigorous depressions blowing in off the Atlantic bringing flooding misery for many as swollen rivers burst their banks.
The predominantly maritime air over us has meant that even air frosts have been few and far between.
Since December 1st, Wanstead has recorded just 7 air frosts – half the number of last year. The coldest night was just -2.9C , warmer than the -6.9C recorded by this point last January.
The current mean temperature this winter to January 14th is 6.6C with rainfall 133mm – statistics that are remarkably similar to the winter of 1985/86 (mean 6.8C rainfall 130mm). That December and January was followed by a very cold February – the 4th coldest in a series stretching back to 1881.
However, before any coldies reading this get excited it should be noted that this season is also remarkably similar to winter 1989/90 (mean 6.8C, rainfall 128mm), which was followed by more stormy weather, including the Burns’ Day Storm, and the warmest February on record in this region.
Further scrutiny of stats for the Wanstead area reveal other years were similar. Using my method for finding patterns stretching back over 50 years to forecast this winter I picked out years that were +/- 10% of the mean. From these I then weeded out the seasons where the rain was +/- 10% of the 2013/14 rainfall total. This gave a list of five other winters with similar temperature and rainfall. Leaving aside 1985/86 and 1989/90 the other winters weren’t anything special with ‘snow lying’ days below the median for this area of six.
As I write this there are tentative signs on the weather models that a Scandinavian high may begin to form next week, introducing colder air from the east – exactly what we need to precipitate snow. However, they are just tentative signs and the cold air may never reach this far west anyway. Bear in mind also just how strong the influence from the Atlantic has been so far this winter. The Met Office have said the storms have been the worst in 20 years – which takes us back to the year in the above table of 1993/94. The only snow lying in that DJF season occurred in a short cold snap around February 15th – though, admittedly, an impressive fall of snow happened the previous November.
So, in summary, the probability at this point of at least one fall of snow before the end of February could be put at 75%. No snow: 25%. Abundant snow: 25%.
Damaging gusts associated with the depression on December 23rd felled this tree by the war memorial in Wanstead High Street
While compiling the figures I found that for my winter forecast to be correct would need a second half to winter exactly the same as 1985/86.
Some comparisons have been made between this winter and the balmy winter of 1988/89 – though that winter, the second warmest in the 1960-2014 series up to this halfway point, was a full degree warmer than this season and much drier, with only 30.9mm falling in over 6 weeks.
The culprit of the dry weather of that season 24 years ago was the influence of a very strong European high pressure which ‘blocked’ weather fronts from reaching this part of the UK, sending a conveyor belt of depressions skirting over Scotland bringing incessant rain instead of snow to Cairngorm resorts.
The nature of the weather this time round has been very different. Though December started with a strong anticyclone over Europe fronts associated with very deep depressions off the Atlantic have made inroads deep into the continent.
A classic Genoa low brought over 2 metres of snow above about 1,000m on Christmas day to resorts on the south side of the Alps. The nature of the airflow subsequent to that, however has brought some very high temperatures for the year.
Scottish and continental European winter sports enthusiasts will remember the season of 1988/89 well for all the wrong reasons, with little snow falling before March. I can vividly remember some amazingly cheap skiing holidays advertised on Teletext in January 1990. One deal was a week to Andorra for £19, including flights, transfers and half board in a 3-star hotel. A few of the lads in my A-level economics class took full advantage – only to return with tales about snowless mountains, sprained knees and wrecked skis, though it’s not clear how much of an influence the duty-free booze had.
Although many resorts were already investing in artificial snowmaking it was this season that quickened the pace of investment in snow cannons.
Winter 2024/25, considering the DJF mean, sits 68th out of 79 winters back to 1946/47.
It was the 13th snowless winter in the series . The only ‘top 10’ winter for snowfall of the past 30 years was 2009/10!
Snow is a very rare commodity in lowland Great Britain – even rarer in the Home Counties, and in our part of east London. Pulling back the curtains on a cold winter’s morning to be greeted by a fresh fall of deep, crisp and even snow is something most children experience and hold dear for life. The slush, ice and chaos that inevitably follows all too quickly is forgotten.
My memories of winters in the 1970s and 1980s is that they were far snowier and colder than they are today. But were they *always* cold and snowy? I decided to have a look back through the archives to find out. My first stop was the Met Office’s now defunct Snow Survey of Great Britain. This excellent compilation of reports logged by observers nationwide was printed annually as part of British Rainfall. But through lack of interest and cuts printing ceased after the 1991-92 season. Data continued to be collected though the modern version of the survey uses satellite technology to estimate daily UK snow depths – the Met Office website says that this is far less subjective than an individual nipping out at 9am every morning to ‘stick in a ruler’ and, those within sight of high ground, to observe where the snow line is. This does a disservice to the hundreds of observers who down the years diligently logged all their information as objectively as possible. But on to the data…
Regional data was not included in the survey until the 1965-66 season. Though Wanstead isn’t listed I have taken an estimate from data supplied from stations at Eastcote (53m), East Barnet (70m), Charlton Park (46m), Twickenham (13m), Teddington (9m). Because this area is influenced by Thames streamer snowfall that blows in off the North Sea and is funnelled upriver I have also considered readings from Epping (107m), Rayleigh (73m) and Southend (27m). Indeed, in some years Wanstead’s snowfall is much more similar to Rayleigh and Southend than it is to Greenwich and Teddington. Though my site is only 18m it seems to catch the snow much better than surrounding areas – probably to do with the fact that Aldersbrook is surrounded by greenery. People walking down from Wanstead village often remark that Wanstead Park is far snowier than the village a couple of dozen metres or so higher. Before 1965 I have used data from Woburn, Bedfordshire, which at 89m and 40 miles away as the crow flies, is the closest station in that long running series.
The mean temperature of a winter can look cold but it doesn’t always tell the full story. You can have a winter dominated by high pressure over the near continent making things very dry. But the anticyclones that ridge from Central Europe to the Azores can leave us in the ‘warm’ part of the high – and often lead to days of anticyclonic gloom; cold grey, dank and boring weather with little sunshine. On paper a season can look cold but in reality totally unremarkable; it is the number of days with ‘snow lying’ that people remember. For snow to settle it needs to be cold! For this reason I haven’t bothered with ‘snow falling’ data as it can snow at 4C in very dry air – yet nothing settles. Most weather geeks find ‘snow falling’ the most frustrating when it doesn’t stick. So on to the results.
The Top 20 winters in Wanstead, using ‘snow lying’ and ‘mean temperature’ in stats. Click here to view all 79 winters back to 1946/47
Once I worked out the ‘snow lying’ days I decided to devise a winter index by dividing ‘snow lying’ by seasonal mean temperature. Because the results using Celsius were problematic in that 1962/63 becomes very skewed upwards I decided to use Kelvin.
The results are quite surprising. Coming out top, not surprisingly, is 1962-63 with an index of 25.2 and 69 days of snow lying. Second is 1946-47 with an index of 21.1. Third is 1981-82 with an index of 10.5 – surprisingly ahead of 1978/79, the first winter in the series that I can recall; I remember returning home from school one night in December 1978 and the snow being as deep as the twelve-inch step to our house.
The index of 25.2 for the 1962/63 winter and 21.1 for 1946/47 – over double the amount of 1981/82 – shows how ‘off the scale’ those two winters really were. My father, who doesn’t share my enthusiasm for the weather, can distinctly recall the severe conditions of 1962/63. He said the roads were so thick with snow that when the thaw finally arrived in March he’d become so used to driving on snow that he crashed through somebody’s front garden wall, after losing control of his Mini on surface water sat on the ice.
More recent winters, which pale by comparison, rank surprisingly highly. The 2009/10 winter comes in at Number 10, higher than the legendary 1986/87, where the coldest day in recent times was recorded in London, which came in at Number 12. It should be noted that January 1987, when on the 12th the temperature did not rise above -5.5C all day, was sandwiched by a mild December and February.
Just by looking at winters with a mean of, say, 5C doesn’t tell you much about snowfall. When you look at 1985-86 (mean 4.1C) there were 22 days of snow lying at 9am – yet 2005/06 was colder (3.9C) and only 3 mornings saw snow lying – though that winter was particularly dry – the 13th driest in the series.
The median for ‘snow lying’ days in this series is six. The rolling median of the past 30 years, however, is only 2 so, with this in mind, if it does snow you should get out there and make the most of it.
You can view over 70 years of winters in this area, all ranked using my winter index here.
*It should be noted that a day of ‘snow lying’ only qualifies if there is more than 50% cover at the observation time of 9am. This means that it could snow 1cm at 10am – if that snow thaws by 9am the next day it won’t count. Though 8 winters appear snowless it is possible that these winters did see temporary coverings


 Just
Just

You must be logged in to post a comment.